20/40/6020/40/60 candle separator. Three lines only on all timeframes. Range length and height included. Doesn't mess up the scaling. Togglable elements and movable lines.
Candlestick analysis

Pre-Market High/Low//@version=5
indicator("Pre-Market High/Low", overlay=true)
startTime = timestamp("America/New_York", year, month, dayofmonth, 04, 00)
endTime = timestamp("America/New_York", year, month, dayofmonth, 09, 30)
inPremarket = (time >= startTime and time < endTime)
var float premktHigh = na
var float premktLow = na
if inPremarket
premktHigh := na(premktHigh) ? high : math.max(premktHigh, high)
premktLow := na(premktLow) ? low : math.min(premktLow, low)
if (not inPremarket) and (time >= startTime and time < endTime)
premktHigh := na
premktLow := na
plot(premktHigh, title="Pre-Market High", color=color.green, linewidth=1, style=plot.style_line)
plot(premktLow, title="Pre-Market Low", color=color.red, linewidth=1, style=plot.style_line)

Consolidation Zones - Working (v5)Updated from v4 to v5
need to write and entry strategy for breakouts

Nadaraya,poly100,MA ribbon,volume nến,RSInadaraya
polynomial 100
volume nến
rsi break out 75,25
MA Ribbon

EMA Reclaim Alert - FVG StrategyThis script identifies momentum-based trend reclaims using two Exponential Moving Averages (EMAs), and plots entry, stop-loss, and take-profit levels for trade signals. It also highlights potential fakeouts.

HTF Candle Extremes Zigzag (Drawn on LTF)HTF Candle Extremes Zigzag (Drawn on LTF)
This indicator plots zigzag lines connecting the extremes (highs and lows) of Higher Timeframe (HTF) candles directly on your lower timeframe (LTF) chart. It visually highlights trend changes and HTF candle structure by drawing colored lines representing uptrends and downtrends based on HTF candle extremes.
"Key Features"
Higher Timeframe Tracking: Select any HTF to track candle extremes using the built-in security function.
Zigzag Lines: Connects HTF candle lows to highs in an intuitive zigzag pattern.
Trend Indication: Uptrend lines are green, downtrend lines are red (customizable colors).
Customizable Line Width: Adjust the thickness of the zigzag lines for better visibility.
Drawn on Lower Timeframe: All lines appear on your active lower timeframe chart, allowing easy visual correlation.
"How It Works"
The script fetches the open, high, low, close, and time data of the specified HTF candle. It detects new HTF bars and identifies trend direction changes by comparing the highs and lows of consecutive HTF candles.
- When an uptrend is detected, vertical lines are drawn from low to high of the HTF candle, connected to the previous extreme low.
- When a downtrend is detected, vertical lines are drawn from high to low, connected to the previous extreme high.
- Transitions between trends are highlighted by connecting the last extreme of the previous trend to the current extreme, creating a clean zigzag pattern.
Usage Notes:
Ideal for traders who want to visualize HTF market structure and trend changes while analyzing price action on lower timeframes.
---
© The_Forex_Steward
(mozilla.org)

Chiaroscuro Scalp Model A [Signal + Visuals]This indicator is based on the Chiaroscuro Scalp Model A — a precision-based scalping system that identifies high-probability trade setups during the London and New York sessions. It combines daily range expansion, order blocks, fair value gaps, and W/M reversal patterns to generate 20-pip scalping opportunities with clearly plotted stop loss and take profit levels. Ideal for intraday traders seeking structured, rule-based entries.

Casper sessions + fvgDraws lines for the 5 minute and 30 minute opening candle along with FVG's as per Casper's recent YouTube videos "Stupid Easy" series. There are options to toggle Asia and London ranges on and off as well as the opening candles. All lines reset at 16:30

Black-Scholes + Smart Money StrategyAn AI Test script.
The Black-Scholes option pricing model to extract institutional sentiment and implied volatility signals, empowering Smart Money-style entries.

GG ADRGG ADR Indicator
A compact volatility and price position table displaying key daily metrics:
• ADR% – Average Daily Range Percentage over a custom period
• ATR – Average True Range (daily), measuring market volatility
• LoD Dist – Distance from the current close to the Daily Low, expressed as a % of the ATR
• 8 EMA Distance – % distance from the current price to the 8-day EMA (based on daily timeframe only)
Customize visibility of each metric using the built-in input toggles. Ideal for tracking intraday positioning relative to historical ranges and key dynamic levels.
Based on ADR Indicator by © ArmerSchlucker


5-Indicator Swing StrategyCustom 5-Indicator Swing Strategy for 4H Chart
---
Key Features:
1. Price Uptrend Detection
Uses 50-period EMA as trend filter
Only takes long positions when price is above EMA
2. RSI Momentum Confirmation
RSI must be above 40 and rising (3-bar confirmation)
Includes overbought exit at RSI > 70
3. MACD Bullish Crossover
Detects when MACD line crosses above signal line
Uses standard 12/26/9 settings (customizable)
4. Volume Spike Detection
Identifies volume spikes 1.5x above 20-period average
Confirms breakout strength
5. Fibonacci Retracement Levels
Calculates dynamic Fibonacci levels from recent swing high/low
Enters when price is near 38.2% to 61.8% support levels
Additional Features:
Risk Management: Stop Loss: 2 x ATR below entry price / Take Profit: 3 x ATR above entry price
ATR Length: 14 periods
Visual Indicators: Clear entry/exit signals with shapes
Information Table: Real-time status of all 5 conditions
Multi-Panel Display: RSI, MACD, and Volume in separate panels
Customizable Parameters: All inputs can be adjusted
Alert System: Built-in alerts for entry and exit signals

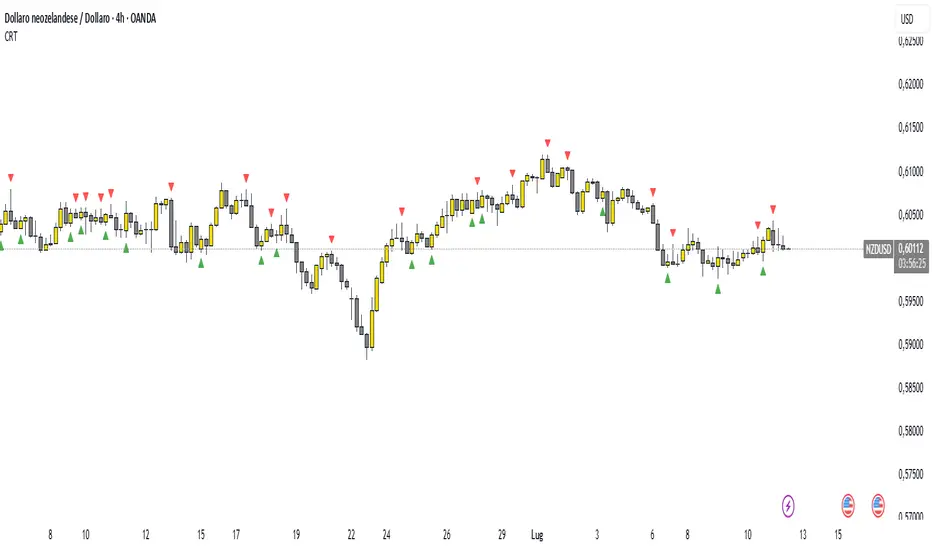
Candle Range Theory (CRT) indicator📌 Indicator Name: Candle Range Theory (CRT) indicator
This indicator detects potential bullish and bearish reversal setups based on specific candlestick price action behavior. It is designed to highlight moments when the market may be rejecting extremes and preparing to reverse direction — but only after confirmation with the closing price.
🔍 How It Works:
Bullish Setup (Long Signal):
The previous candle is bearish (closes lower than it opens).
The current candle makes a lower low than the previous one.
The current candle closes above the previous candle’s close.
Bearish Setup (Short Signal):
The previous candle is bullish (closes higher than it opens).
The current candle makes a higher high than the previous one.
The current candle closes below the previous candle’s close.
Signals are only triggered after the bar is fully closed, to avoid premature entries.
🔔 The script includes alert conditions for both long and short setups so you can receive notifications instantly.
🎥 Inspiration:
The idea for this indicator came from the excellent educational content presented in this video:
"How to Read Candlesticks Like a Pro"
We highly recommend watching it to better understand the price action principles behind this signal.
Quarterly Theory Levels - Period BasedOpen, true open, market close for daily weekly, monthly, quarterly, yearly.

NY Open Breakout [ATR-5000]# **New York Open Breakout Indicator **
## **📌 Overview**
This **Pine Script** indicator identifies high-probability breakout opportunities at the **New York market open (13:30 UTC)** based on **volatility filters** using **customizable ATR periods and thresholds**.
### **🔹 Key Features**
✅ **Fully Customizable ATR Periods** (2 to **5000** bars)
✅ **Adjustable Thresholds** (0.01% to 5.00%)
✅ **Opening Range (OR) Filter** (0.01% to 5.00%)
✅ **Clean Visuals** – Only highlights the **13:30 UTC candle** when conditions are met
✅ **Real-Time Info Panel** – Displays current ATR & threshold settings
✅ **Automatic Daily Reset** – Fresh signals every trading day
---
## **📊 How It Works**
### **1️⃣ Volatility Check (13:25 UTC)**
- Calculates **two ATR values** (user-defined periods)
- Compares them against **custom % thresholds**
- Only proceeds if **both ATRs exceed** their required volatility levels
### **2️⃣ Opening Range Confirmation (13:30 UTC)**
- Measures the **high-low range** of the 13:30 candle
- Validates if the range meets the **minimum % threshold**
- If all conditions pass → **Highlights the candle** in your chosen color
### **3️⃣ Visual Feedback**
- **🟣 Colored Candle** → Valid breakout signal
- **📊 Info Table** → Shows current ATR settings & thresholds
---
## **⚙️ Customization Options**
| **Setting** | **Default** | **Adjustable Range** |
|---------------------------|------------|----------------------|
| **First ATR Period** | 14 | **2–5000** bars |
| **Second ATR Period** | 161 | **2–5000** bars |
| **First ATR Threshold** | 0.42% | **0.01%–5.00%** |
| **Second ATR Threshold** | 0.40% | **0.01%–5.00%** |
| **OR Range Threshold** | 0.42% | **0.01%–5.00%** |
| **Candle Color** | Purple | **Any color** |
---
## **📈 Best Use Cases**
✔ **Forex (EURUSD, GBPUSD)** – Captures NY session momentum
✔ **Indices (SPX, NASDAQ)** – Works well with opening volatility
✔ **Commodities (Gold, Oil)** – Filters out low-energy days
---
## **🔧 How to Adjust Settings**
1. **Click the gear icon (⚙️)** on your TradingView chart
2. **Modify ATR periods & thresholds** as needed
3. **Change the candle color** for better visibility
---
## **🚀 Why This Indicator?**
- **No repainting** – Signals lock in after candle close
- **No clutter** – Only marks valid 13:30 candles
- **Adaptable** – Works on **any market & timeframe**
- **Fully automated** – No manual adjustments needed
---
### **📥 Apply & Start Trading!**
Simply **load the script** on TradingView and customize it to fit your strategy! 🚀

Estilo Pako Mejorado - Tendencia, Liquidez y ConfirmaciónThis indicator is designed to replicate the entry logic used in high-accuracy institutional-style trading, specifically inspired by strategies used on XAU/USD (gold) in 15-minute timeframes.
It generates high-probability trade signals based on the following key conditions:
Clear market trend: Identified using the 20 EMA and 50 EMA crossover (trend confirmation).
Liquidity sweep detection: Triggers when price takes out recent highs/lows (20-bar lookback), suggesting stop-hunt behavior.
Candle confirmation: Requires a bullish or bearish engulfing candle as price reverts after the sweep.
Optional visual features include:
Order Blocks (OB): Displays the last opposite candle before a strong market move.
Liquidity zones: Marks recent swing highs/lows where liquidity likely sits.
The indicator only plots entry signals when all three conditions are aligned, aiming to reduce false positives and improve trade precision.
Best used on:
XAU/USD or major FX pairs
15-minute timeframe
In trending markets with clean structure
You can combine this indicator with alerts or automation tools to build a semi-automated or fully automated trading system.

شمعة ابتلاعية صاعدة أو هابطة - أسودAn engulfing candle, whether bullish or bearish, will appear on the chart in black

Multi-TF Candle Pattern Table — last 3 + formingUsing strat pattern, including 4 timeframe, you can directly modify timeframe on code. The up means it is a 2 candle, and separate them between 2U and 2D

Variance and Moving Averages StrategyThe Variance and Moving Averages Strategy is a long-only trend-following system that combines volatility filtering with classic moving-average signals. It computes 5-, 15-, and 30-period simple moving averages (MA5, MA15, MA30) to identify a clear uptrend (MA5 > MA15 > MA30) and only enters when recent price variance (measured over the past 30 bars as the variance of (high–low)/close) is very low—avoiding choppy or noisy conditions. Once in a position, it employs a dual exit: a trend-based stop-loss (closing when MA5 falls below MA30) and a volatility-based take-profit (exiting when variance spikes above a high threshold), thus “buying low-volatility breakouts” and “selling on trend reversal or volatility expansion.”


Chiaroscuro Scalp Model A [Signal + Visuals]This indicator is based on the Chiaroscuro Scalp Model A — a precision-based scalping system that identifies high-probability trade setups during the London and New York sessions. It combines daily range expansion, order blocks, fair value gaps, and W/M reversal patterns to generate 20-pip scalping opportunities with clearly plotted stop loss and take profit levels. Ideal for intraday traders seeking structured, rule-based entries.
