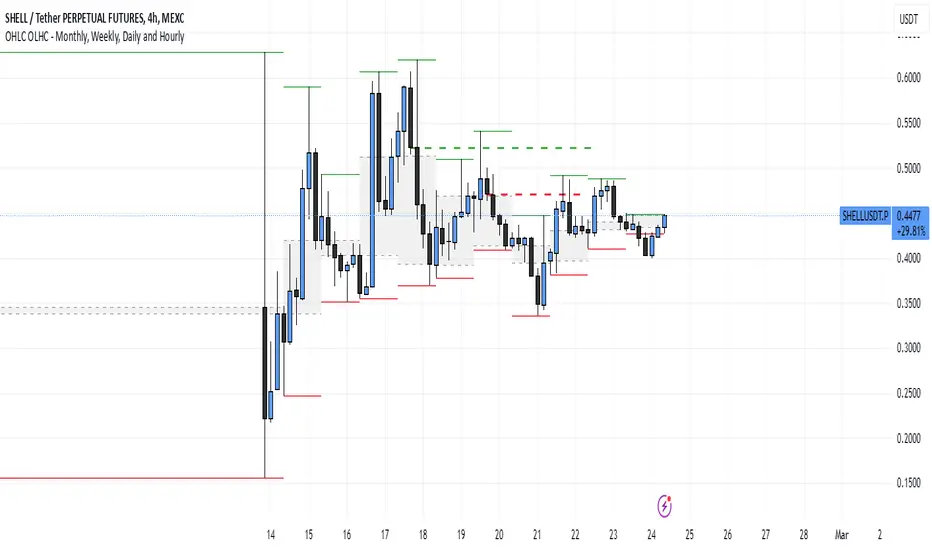
OHLC OLHC - Monthly, Weekly, Daily and HourlyThis indicator plots the previous day's (or any selected timeframe’s) Open, High, Low, and Close (OHLC) levels on the current chart. It helps traders analyze historical price levels to identify support and resistance zones.
Key Features:
Multi-Timeframe Support:
Users can select a timeframe (D, W, M, etc.) to fetch previous OHLC data.
The script requests OHLC values from the selected timeframe and overlays them on the current chart.
Customizable Display Options:
Users can choose to display only the last OHLC levels instead of all past session levels.
Users can extend the OHLC lines across the chart.
Background Highlighting:
The script fills the background only for the Previous Open and Previous Close levels, making them visually distinct.
Previous High and Low levels do not have background color.
This script is particularly useful for day traders and swing traders who rely on key price levels to make trading decisions. Let me know if you need further refinements!
Candlestick analysis
Trading Sessions with TableTrading Sessions with Table is a dynamic TradingView indicator that displays the status of major global trading sessions directly on your chart. The script features a customizable table listing key sessions—Sydney, Tokyo, London, and New York—along with their open and close times and current status ("Open" or "Closed").
Key features include:
Custom Time Inputs: Easily set your session times by entering HH:MM formatted strings.
Dynamic Timestamps: The script calculates session timestamps for the current day and automatically adjusts for sessions that span midnight.
Visual Cues: Active sessions are highlighted with distinct background colors for quick reference.
Alert Conditions: Built-in alerts notify you when each session starts and ends, so you can stay informed of market shifts.
Ideal for traders managing multi-market strategies, this tool offers a clear, at-a-glance overview of session activity and helps streamline your trading decisions across different time zones.

Gap Detector RSTThis script detects and visualizes price gaps in the market using customizable settings. It identifies bullish and bearish gaps over a specified lookback period and marks them with clearly defined boxes. Users can adjust the minimum gap percentage threshold and customize colors for better visibility.

Advanced Candlestick Pattern DetectorWhat Does This Indicator Do?
This indicator looks at the way price moves in the market using candlesticks (those red and green bars you see on charts). It tries to find special patterns like Bullish Engulfing, Hammer, Doji, and others. When one of these patterns shows up, the indicator checks a bunch of filters to decide if the pattern is strong enough to be a signal to buy or sell.
The Main Parts of the Indicator
1. Candlestick Pattern Detection
Bullish Engulfing:
Imagine you see a small down candle (red) and then a big up candle (green) that completely “covers” the red one. That’s a bullish engulfing pattern. It can signal that buyers are taking over.
Bearish Engulfing:
The opposite of bullish engulfing. A small up candle (green) is followed by a big down candle (red) that covers the previous candle. This suggests sellers might be in control.
Hammer & Shooting Star:
Hammer: A candle with a very short body and a long shadow at the bottom. It shows that buyers stepped in after a drop.
Shooting Star:
Similar to the hammer but with a long shadow on top. It can indicate that sellers are starting to push the price down.
Doji:
A candle with almost no body. This means the opening and closing prices are very close. It shows indecision in the market.
Harami Patterns (Bullish & Bearish):
These are two-candle patterns where the second candle is completely inside the body of the first candle. They signal that the previous trend might be about to change.
Morning Star & Evening Star:
These are three-candle patterns.
Morning Star:
Often seen at the bottom of a downtrend, it can signal a reversal to an uptrend.
Evening Star:
Seen at the top of an uptrend, it can signal that the price may soon go down.
2. Filters: Making the Signals Smarter
The indicator doesn’t just rely on patterns. It uses several “filters” to decide if a pattern is strong enough to trade on. Here’s what each filter does:
a. Adaptive Thresholds (ATR-Based)
What It Is:
The indicator uses something called ATR (Average True Range) to see how much the price is moving (volatility).
How It Works:
Instead of using fixed numbers to decide if a candle is a Hammer or a Doji, it adjusts these numbers based on current market activity.
User Settings:
Use Adaptive Thresholds: Turn this on to let the indicator adjust automatically.
Body Factor, Shadow Factor, Doji Factor: These numbers are multipliers that decide how small or big the body and shadows of the candle should be. You can change them if you want the indicator to be more or less sensitive.
b. Volume Filter
What It Is:
Volume shows how many trades are happening.
How It Works:
The filter checks if the current volume is higher than the average volume (multiplied by a set factor). This helps ensure that the signal isn’t coming from a very quiet market.
User Settings:
Use Volume Filter: Turn this on if you want to ignore signals when there’s not much trading.
Volume MA Period & Volume Multiplier: These settings determine what “normal” volume is and how much higher the current volume must be to count.
c. Multi-Timeframe Trend Filter
What It Is:
This filter looks at a bigger picture by using a moving average (MA) from a higher timeframe (for example, daily charts).
How It Works:
For a bullish (buy) signal, the indicator checks if the price is above this MA.
For a bearish (sell) signal, the price must be below the MA.
User Settings:
Use Multi-Timeframe Trend Filter: Enable or disable this filter.
Higher Timeframe for Trend: Choose which timeframe (like Daily) to use.
Trend MA Type (SMA or EMA) & Trend MA Period: Choose the type of moving average and how many candles to average.
d. Additional Trend Filters (ADX & RSI)
ADX Filter:
What It Is:
ADX stands for Average Directional Index. It measures how strong a trend is.
How It Works:
If the ADX is above a certain threshold, it means the trend is strong.
User Setting:
ADX Threshold: Set the minimum strength the trend should have.
RSI Filter:
What It Is:
RSI (Relative Strength Index) tells you if the price is overbought (too high) or oversold (too low).
How It Works:
For a buy signal, RSI should be low (under a set threshold).
For a sell signal, RSI should be high (above a set threshold).
User Settings:
RSI Buy Threshold & RSI Sell Threshold: These set the levels for buying or selling.
3. How the Final Signal Is Determined
For a signal (buy or sell) to be generated, the indicator first checks if one of the candlestick patterns is present. Then it goes through all these filters (trend, volume, ADX, RSI). Only if everything is in line will it show:
A BUY signal when all bullish conditions are met.
A SELL signal when all bearish conditions are met.
4. Visual Elements on the Chart
Trend MA Line:
A blue line is drawn on your chart showing the moving average from the higher timeframe (if you enable the trend filter). This helps you see the overall direction of the market.
Labels on the Chart:
When a signal is detected, you’ll see:
A BUY label below the candle (green).
A SELL label above the candle (red).
Background Colors:
The chart background might change slightly (green for bullish and red for bearish) to give you a quick visual cue.
Histogram:
At the bottom, there is a histogram that shows +1 for bullish signals, -1 for bearish signals, and 0 when there’s no clear signal.
5. Alerts
Alerts are built into the indicator so you can get a notification when a signal appears. The alert messages are fixed strings, meaning they always say something like “BUY signal on at price .” You can set up these alerts in TradingView to be notified via sound, email, or pop-up.
How to Use and Adjust the Filters
Deciding on Patterns:
You can choose which candlestick patterns you want to detect by toggling the options (e.g., Bullish Engulfing, Hammer, etc.).
Adjusting Adaptive Thresholds:
If you feel that the indicator is too sensitive (or not sensitive enough) during volatile times, adjust the Body Factor, Shadow Factor, and Doji Factor. These change how the indicator recognizes different candle shapes based on market movement.
Volume Filter Settings:
Use Volume Filter:
Turn this on if you want to ignore signals when there’s not enough trading activity.
Adjust the Volume MA Period and Volume Multiplier to change what “normal” volume is for your chart.
Multi-Timeframe Trend Filter Settings:
Choose a higher timeframe (like Daily) to see the bigger picture trend. Select the type of moving average (SMA or EMA) and its period. This filter ensures you only trade in the direction of the overall trend.
ADX & RSI Filters:
ADX:
Adjust the ADX Threshold if you want to change the minimum strength of the trend needed for a signal.
RSI:
Set the RSI Buy Threshold (for oversold conditions) and RSI Sell Threshold (for overbought conditions) to refine when a signal is valid.
Summary
This indicator is like having a smart assistant that not only looks for specific price patterns (candlesticks) but also checks if the overall market conditions are right using several filters. By combining:
Pattern Detection
Adaptive thresholds (based on ATR)
Volume Checks
Multi-Timeframe Trend Analysis
Additional Trend Strength and Overbought/Oversold Indicators (ADX & RSI)
...it helps you decide if it might be a good time to buy or sell. You can customize each part to fit your trading style, and with the built-in alerts, you can be notified when everything lines up.
Feel free to adjust the settings to see how each filter changes the signals on your chart. Experimenting with these will help you learn how the market behaves and how you can best use the indicator for your own strategy!

Daily True Range (DTR) vs Average True Range (ATR)Overview
The "DTR vs ATR with Color-Coded Percentage" indicator is a powerful volatility analysis tool designed for traders who want to understand daily price movements in the context of historical volatility. It calculates the Daily True Range (DTR)—the raw measure of a single day’s volatility—and compares it to the Average True Range (ATR), which smooths volatility over a user-defined period (default 14 days). The indicator presents this data in an intuitive table, featuring a color-coded percentage that visually represents how the current day’s move (DTR) stacks up against the average volatility (ATR). This helps traders quickly assess whether the current day’s price action is unusually volatile, average, or subdued relative to recent history.
Purpose
Volatility Comparison: Visualize how the current day’s price range (DTR) relates to the average range (ATR) over a specified period.
Decision Support: Identify days with exceptional movement (e.g., breakouts or reversals) versus normal or quiet days, aiding in trade entry/exit decisions.
Risk Management: Gauge daily volatility to adjust position sizing or stop-loss levels based on whether the market is exceeding or falling short of typical movement.
Features
Daily True Range (DTR) Calculation:
Computes the True Range for the current day as the greatest of:
Current day’s High - Low
High - Previous Close
Low - Previous Close
Aggregates data on any timeframe to ensure accurate daily values.
Average True Range (ATR):
Calculates the smoothed average of DTR over a customizable period (default 14 days) using Wilder’s smoothing method.
Updates in real-time as the day progresses.
Timeframe Flexibility: Works on any chart timeframe (e.g., 1-minute, 1-hour) while always calculating DTR and ATR based on daily data.
Color-Coded Display in either compact or table mode
The percentage value is color-coded in the table based on configurable thresholds:
Safe (default 75): Normal range, within typical volatility
Warning: (default 75-125): Above-average volatility.
Danger (default 125): Exceptionally high volatility

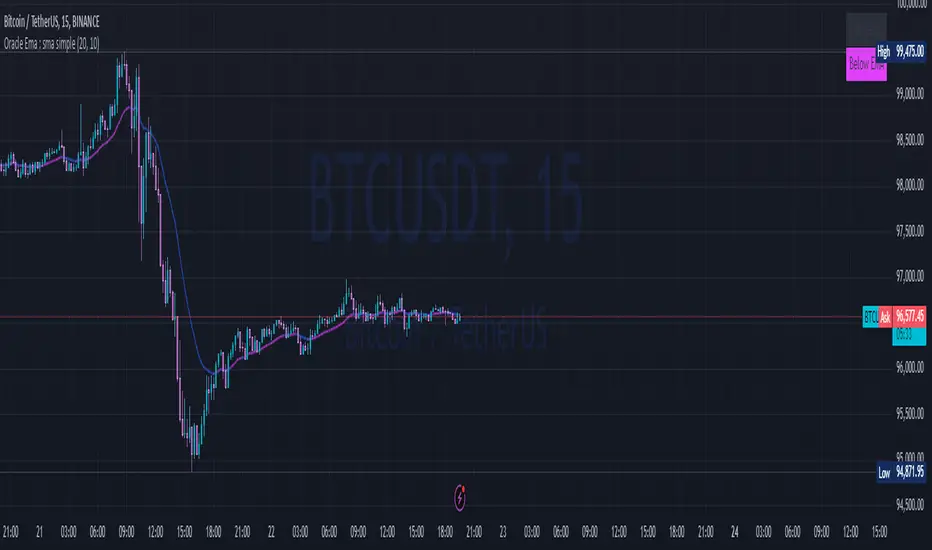
Oracle Ema : sma simple Indicator: Gradient Moving Average with Table
Overview
The Gradient Moving Average with Table is a visual-enhanced moving average indicator that dynamically changes its color based on price movements. It provides a smooth gradient effect on the moving average line and includes a table that indicates whether the price is above or below the MA, using turquoise and pink colors for clear visibility.
🔹 Key Features
✅ Dynamic Gradient Effect on EMA/SMA
The moving average line gradually changes color based on price movement.
Fuchsia (pink) when the MA is decreasing.
Blue when the MA is increasing.
✅ Price Position Table (Top-Right Corner)
Displays whether the price is above (turquoise) or below (pink/fuchsia) the moving average.
Adapts automatically based on EMA or SMA selection.
✅ Customizable Inputs
Choose EMA or SMA as the base moving average.
Adjust gradient intensity to control color transparency.
Toggle the table display ON/OFF.
📊 How It Works
1️⃣ The script calculates a moving average (SMA or EMA).
2️⃣ It determines price movement (uptrend or downtrend) based on price difference.
3️⃣ A gradient color effect is applied dynamically:
The more volatile the movement, the stronger the gradient effect.
Less transparency for strong trends, more transparency for stable zones.
4️⃣ A real-time table shows whether the price is above or below the MA, with colors:
Turquoise (Above)
Pink/Fuchsia (Below)
🛠 Customization Options
Moving Average Type: Select EMA or SMA.
Gradient Intensity: Adjust the transparency and color effect strength.
Table Display: Toggle the table ON or OFF.
🎯 Ideal For
Traders who want a clear visual representation of market trends.
Scalpers and swing traders needing quick trend recognition.
Users who prefer color-coded visual aids over complex charts.
This indicator enhances traditional moving averages with a modern gradient effect and real-time status updates for quick decision-making. 🚀
Three Bar Reversal Pattern [ActiveQuants]This indicator identifies bullish and bearish three-bar reversal patterns , offering traders a visual tool to spot potential trend reversals. By analyzing consecutive candlesticks, volume trends, and candlestick morphology, it highlights signals while filtering out false patterns. Ideal for traders using price action strategies, it simplifies pattern recognition and enhances decision-making with customizable parameters.
█ KEY FEATURES
Pattern Detection Logic :
Bullish Reversals : Detects two consecutive bearish candles followed by a bullish candle that closes above the open of the first bearish candle .
Bearish Reversals : Identifies two consecutive bullish candles followed by a bearish candle that closes below the open of the first bullish candle .
Volume Confirmation :
Filters signals using a Volume SMA (user-defined length) to ensure reversals occur with above-average volume, adding validity to the pattern.
Candlestick Filtering :
Shooting Star Filter : Discards bullish patterns if the third candle is a Shooting Star (body confined to the lower portion of the candle’s range, adjustable via Shooting Star Body Limit ).
Hammer Filter : Discards bearish patterns if the third candle is a Hammer (body confined to the upper portion of the candle’s range, adjustable via Hammer Body Limit ).
Customizable Display :
Toggle visibility of bullish/bearish patterns and customize their colors.
Adjust the Show Last parameter to limit plotted labels to recent bars.
Alerts Integration :
Separate Bullish/Bearish Alerts : Generate independent alerts for bullish and bearish patterns. Traders can selectively enable one or both alerts via TradingView’s alert system.
Real-time notifications ensure you never miss a potential reversal signal.
█ CONCLUSION
The Three Bar Reversal Pattern Indicator streamlines the identification of reversal setups by combining candlestick patterns, volume analysis, and customizable filters. Its focus on price action dynamics makes it invaluable for traders seeking to capitalize on trend exhaustion or market sentiment shifts.
█ IMPORTANT NOTES
⚠ Use with Confluence : Reversal signals should be validated with additional tools like support/resistance levels, trendlines, or momentum oscillators.
⚠ Adapt Parameters : Adjust Volume SMA Length , Show Last , and body limits ( Shooting Star Body Limit and Hammer Body Limit ) to suit your timeframe and asset volatility.
█ RISK DISCLAIMER
Trading involves significant risk, and you may lose capital. Past performance is not indicative of future results. This tool provides informational signals only and does not constitute financial advice. Use it at your own risk and consult a qualified financial professional before making trading decisions.
Incorporate this indicator into your strategy to refine reversal entries, manage risk, and align with market momentum.
📈 Happy trading! 🚀

ICT Liquidity Levels [TakingProphets]Overview
This indicator is designed to dynamically identify and display key liquidity levels—areas where market participants are likely to engage. By analyzing price swing points, it highlights potential support and resistance zones that can signal reversals or breakouts. The script distinguishes between buyside and sellside liquidity levels, presenting them with customizable visual cues and labels for immediate clarity.
How It Works
Swing Point Detection:
The indicator uses a pivot-based method (with a configurable “Base Swing Strength”) to detect swing highs and lows. Each detected swing is evaluated for its “swing size” (percentage price movement), and if it exceeds a user-defined threshold, the level is classified as major.
Level Creation and Classification:
Overview
Built on core ICT principles, this indicator identifies key liquidity zones—areas where market imbalances can lead to liquidity sweeps. By dynamically analyzing swing points, it offers traders a real-time view of where liquidity is clustering, allowing for a deeper understanding of market structure. 🚀
How It Works
Swing Point Detection 🔍
• Uses a pivot-based method with a configurable “Base Swing Strength” to detect significant price swings.
• Calculates the swing size (percentage change) to flag zones that exceed the “Major Level Threshold” as major liquidity zones.
Level Creation & Classification 🛠️
• Buyside Liquidity Levels (BSL):
Identified from swing highs, marking zones where buying liquidity clusters.
• Sellside Liquidity Levels (SSL):
Identified from swing lows, highlighting zones of concentrated selling liquidity.
• Each zone is stored with its price, bar index, and classification (major or standard) before being drawn as a horizontal line on the chart.
Dynamic Level Management 🔄
• Extension: Liquidity lines automatically extend from their detection point to the current bar.
• Consolidation: When levels are close in price, the script merges them—updating labels (e.g., “REQH” or “REQL”) to denote unified liquidity zones.
• Traded-Through Detection: Adjusts or removes levels if the market moves beyond them, based on your settings.
• Age-Based Cleanup: Inactive zones are automatically removed after a set number of bars to maintain clarity.
Customization Options ⚙️
Visual Settings:
• Choose from solid, dashed, or dotted line styles and adjust line width.
• Option to display labels with customizable placement (left or right) for optimal clarity.
Color & Opacity:
• Set distinct colors for buyside and sellside liquidity zones.
• Configure opacity for zones that have been traded through, keeping them visible yet de-emphasized.
Detection & Cleanup Parameters:
• Adjust “Base Swing Strength” to control pivot detection sensitivity.
• Set the “Major Level Threshold %” to filter for significant liquidity zones.
• Decide whether to retain or remove zones once price moves through them.
• Define how many bars should pass before inactive zones are automatically deleted.
How to Use 🚀
Apply the Indicator:
Simply add the script to your chart—it automatically detects and marks key liquidity zones based on recent price action.
Adjust Inputs:
Fine-tune parameters like swing strength, threshold percentages, and visual settings to match the asset’s characteristics and your trading strategy.
Interpret the Visuals:
• Major Liquidity Zones:
Highlighted with thicker lines and distinct labels (e.g., “Major BSL/SSL”), indicating areas of heightened liquidity concentration.
• Consolidated Zones:
Merged labels (e.g., “REQH/REQL”) denote unified liquidity zones where clustering is significant.
• Traded-Through Zones:
Changes in opacity signal that the market has moved beyond a previously identified liquidity zone.
Underlying ICT Concepts 💡
Liquidity Pools & Sweeps:
Focused on identifying where liquidity is concentrated, the indicator aligns with ICT methodologies that highlight zones crucial for liquidity sweeps.
Pivot Analysis for Liquidity:
Enhances traditional pivot detection to spotlight liquidity clusters, providing a deeper insight into market structure.
Real-Time Adaptation:
With continuous updates and built-in cleanup, the indicator ensures that liquidity zones accurately reflect current market conditions.

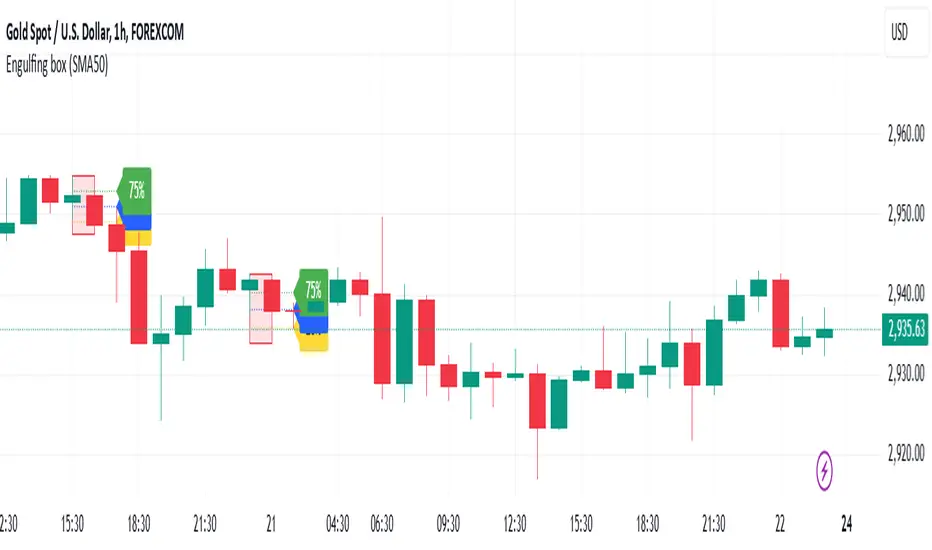
Engulfing BoxEngulfing Day Trading Strategy | Version 1.0
This indicator highlights Bullish and Bearish Engulfing candlestick patterns, designed for day trading strategies. It identifies key market reversals and potential breakout points using simple price action principles.
🔑 Features:
Detects Bullish and Bearish Engulfing patterns based on customizable trend filters.
Automatically draws percentage levels (20%, 50%, and 75%) for target zones.
Bullish Engulfing → Levels drawn top to bottom.
Bearish Engulfing → Levels drawn bottom to top.
Highlights the engulfing candle and previous bar with colored boxes.
Supports trend detection using SMA50 or SMA50 & SMA200.
Alert conditions for both bullish and bearish setups.
Ideal for scalping, day trading, and identifying potential reversals.
📊 How to Use:
Apply the indicator on your preferred time frame (5M, 15M, 1H, etc.).
Wait for the engulfing pattern to form and monitor the drawn levels for potential entry/exit points.
Use in combination with volume or momentum indicators for enhanced confirmation.
⚠️ Disclaimer:
This is a tool for educational purposes and should not be considered financial advice. Always manage your risk and backtest before live trading.
VWAP [cryptalent]VWAP Indicator with Adjustable Source
Overview
This TradingView indicator calculates Daily, Weekly, and Monthly VWAP (Volume Weighted Average Price) with the flexibility to select different price sources (Open, High, Low, Close, HLC3, etc.). It also displays previous period VWAP levels, helping traders analyze past liquidity zones.
Key Features:
✅ Adjustable Source – Users can choose the price used for VWAP calculations (e.g., Close, High, Low, Open).
✅ Multi-Timeframe VWAP – Tracks Daily, Weekly, and Monthly VWAP to provide a broader market view.
✅ Historical VWAP Levels – Displays previous VWAP values for comparison and reference.
✅ Step Line Style – Ensures clear distinction between different periods and prevents overlapping.
✅ Visible in the Price Scale – The latest and historical VWAP values are displayed in the right-hand price scale for easy reference.
Customization:
You can easily modify the input settings to match your trading style.
Adjust the VWAP source price to test different perspectives (e.g., Open vs. High vs. Close).

[TehThomas] - MA Cross with DisplacementThis TradingView script, "MA Cross with Displacement," is designed to detect potential long and short trade opportunities based on moving average (MA) crossovers combined with price displacement confirmation. The script utilizes two simple moving averages (SMA) and highlights potential trade signals when a crossover occurs alongside a strong price movement (displacement).
Why This Indicator is Useful
This indicator enhances the standard moving average crossover strategy by incorporating a displacement condition, making trade signals more reliable. Many traders rely on moving average crossovers to determine trend reversals, but false signals often occur due to minor price fluctuations. By requiring a significant price movement (displacement), this indicator helps filter out weak or insignificant crossovers, leading to more high-probability trade opportunities.
How It Works
Calculates Two Moving Averages (MA)
The user can set two different MA periods:
MA 1 (blue line): Default period is 9 (shorter-term trend).
MA 2 (red line): Default period is 21 (longer-term trend).
These moving averages smooth out price fluctuations to identify overall trends.
Detects Crossovers
Bullish crossover: The blue MA crosses above the red MA + displacement candle → Potential long signal.
Example of bullish cross with displacement:
Bearish crossover: The blue MA crosses below the red MA + displacement candle → Potential short signal.
Example of bearish cross with displacement:
Confirms Displacement (Strong Price Move)
A price displacement threshold is used (default: 1.1% of the previous candle size).
For a valid trade signal, a crossover must occur alongside a strong price movement.
Bullish Displacement Condition: Price increased by more than the threshold.
Bearish Displacement Condition: Price decreased by more than the threshold.
Visual Indicators on the Chart
Bars are colored green when there is a bullish displacement.
Bars are colored red when there is a bearish displacement.
These color changes help traders quickly identify potential trade setups.
How to Use the Indicator
Add the Script to Your Chart
Copy and paste the script into TradingView's Pine Script Editor.
Click "Add to Chart" to activate it.
Customize the Settings
Adjust the moving average periods to fit your trading strategy.
Modify the displacement threshold based on market volatility.
Change the bar colors for better visualization.
Look for Trade Signals
Long Trade (Buy Signal)
The blue MA crosses above the red MA (bullish crossover).
A green bar appears, confirming bullish displacement.
Short Trade (Sell Signal)
The blue MA crosses below the red MA (bearish crossover).
A red bar appears, confirming bearish displacement.
Use in Conjunction with Other Indicators
This indicator works best when combined with support & resistance levels, RSI, MACD, or volume analysis to improve trade accuracy.
Final Thoughts
The MA Cross with Displacement Indicator improves the reliability of moving average crossovers by requiring strong price movements to confirm a trade signal. This helps traders avoid false breakouts and weak trends, making it a powerful tool for identifying high-probability trades.
__________________________________________
Thanks for your support!
If you found this idea helpful or learned something new, drop a like 👍 and leave a comment—I’d love to hear your thoughts! 🚀
Make sure to follow me for more price action insights, free indicators, and trading strategies. Let’s grow and trade smarter together! 📈✨

Wick Size in USD with 10-Bar AverageWick Size in USD with 10-Bar Average
Version: 1.0
Author: QCodeTrader
🔍 Overview
This indicator converts the price wicks of your candlestick chart into USD values based on ticks, providing both raw and smoothed data via a 10-bar simple moving average. It helps traders visualize the monetary impact of price extremes, making it easier to assess volatility, potential risk, and plan appropriate stop loss levels.
⚙️ Key Features
Tick-Based Calculation:
Converts wick sizes into ticks (using a fixed tick size of 0.01, typical for stocks) and then into USD using a customizable tick value.
10-Bar Moving Average:
Smooths out the wick values over the last 10 bars, giving you a clearer view of average wick behavior.
Bullish/Bearish Visual Cues:
The chart background automatically highlights bullish candles in green and bearish candles in red for quick visual assessment.
Stop Loss Optimization:
The indicator highlights long wick sizes, which can help you set more accurate stop loss levels. Even when the price moves in your favor, long wicks may indicate potential reversals—allowing you to account for this risk when planning your stop losses.
User-Friendly Customization:
Easily adjust the USD value per tick through the settings to tailor the indicator to your specific instrument.
📊 How It Works
Wick Calculation:
The indicator calculates the upper and lower wicks by measuring the distance between the candle’s high/low and its body (open/close).
Conversion to Ticks & USD:
These wick sizes are first converted from price points to ticks (dividing by a fixed tick size of 0.01) and then multiplied by the user-defined tick value to convert the measurement into USD.
Smoothing Data:
A 10-bar simple moving average is computed for both the upper and lower wick values, providing smoothed data that helps identify trends and deviations.
Visual Representation:
Columns display the raw wick sizes in USD.
Lines indicate the 10-bar moving averages.
Background Color shifts between green (bullish) and red (bearish) based on candle type.
⚡ How to Use
Add the Indicator:
Apply it to your chart to begin visualizing wick sizes in monetary terms.
Customize Settings:
Adjust the Tick Value in USD in the settings to match your instrument’s tick value.
(Note: The tick size is fixed at 0.01, which is standard for many stocks.)
Optimize Your Stop Loss:
Analyze the raw and averaged wick values to understand volatility. Long wicks—even when the price moves in your favor—may indicate potential reversals. This insight can help you set more accurate stop loss levels to protect your gains.
Analyze:
Use the indicator’s data to gauge market volatility and assess the significance of price movements, aiding in more informed trading decisions.
This indicator is perfect for traders looking to understand the impact of extreme price movements in monetary terms, optimize stop loss levels, and effectively manage risk across stocks and other instruments with similar tick structures.

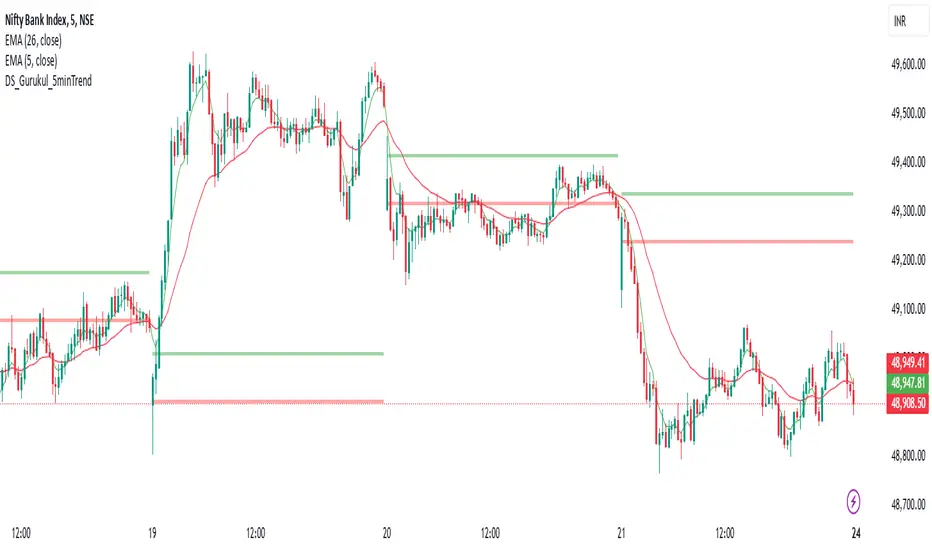
DS_Gurukul_5minTrendDS Gurukul (DS_5minTrend) Indicator: A Simple Yet Powerful Trend Tool
The Tushar Daily Bands (DS_5minTrend) indicator is a straightforward tool designed to help traders quickly visualize potential trend reversals and identify profitable trading opportunities. This indicator plots two bands—an upper band (green) and a lower band (red)—based on a small percentage deviation from the closing price of the first candle of each trading day.
How it Works:
The DS_5minTrend indicator calculates these bands at the start of each new trading day. The bands then remain fixed for the rest of that day. This daily reset allows traders to easily see how the current day's price action relates to the opening price and the calculated bands.
Trading Signals:
Potential Reversals: When the price approaches or touches the upper band (green), it can signal a potential overbought condition and a possible reversal to the downside. Conversely, when the price approaches or touches the lower band (red), it can suggest an oversold condition and a possible reversal to the upside.
Trend Confirmation: If the price consistently closes above the upper band for several periods, it may indicate a strong uptrend. Conversely, consistent closes below the lower band can suggest a strong downtrend.
Support and Resistance: The bands can also act as dynamic support and resistance levels. Traders can watch for price bounces off these levels as potential entry points.
How to Use:
Combine with other indicators: While DS_5minTrend can provide valuable insights, it's generally recommended to use it in conjunction with other technical indicators, such as RSI, MACD, or volume analysis, for confirmation.
Consider market context: Always consider the broader market context and news events that may be influencing price action.
Risk Management: Implement proper risk management strategies, including stop-loss orders, to protect your capital.
Disclaimer: The DS_5minTrend indicator is a tool for analysis and should not be the sole basis for making trading decisions. Trading involves substantial risk, and you could lose money. Always do your own research and consult with a financial advisor before making any investment decisions.
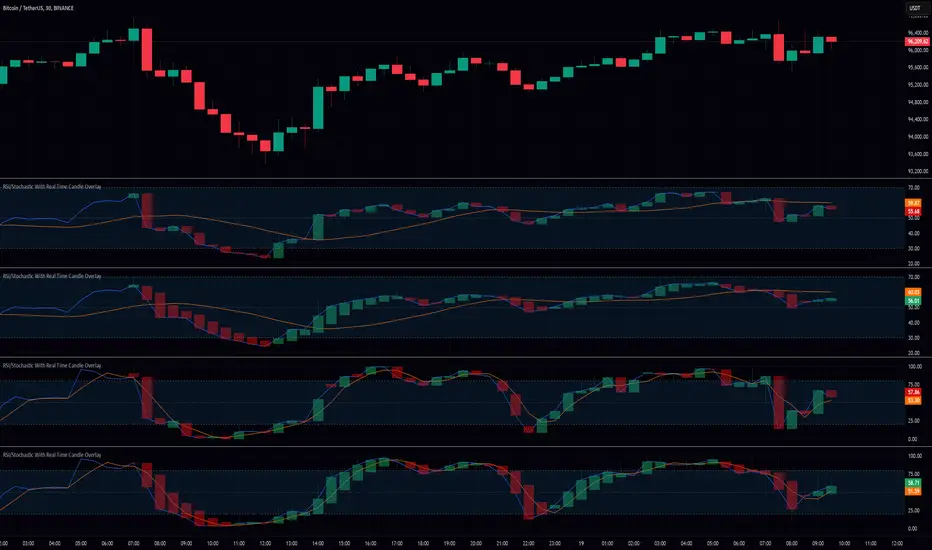
RSI/Stochastic With Real Time Candle OverlayThis indicator provides an alternative way to visualize either RSI or Stochastic values by representing them as candle bars in real time, allowing a more detailed view of momentum shifts within each bar. By default, it displays the standard historical plot of the chosen oscillator in the background, but once you are receiving real-time data (or if you keep your chart open through the close), it begins overlaying candles that track the oscillator’s intrabar movements. These candles only exist for as long as the chart remains open; if you refresh or load the chart anew, there is no stored candle history, although the standard RSI or Stochastic line is still fully retained. These candles offer insight into short-term fluctuations that are otherwise hidden when viewing a single line for RSI or Stochastic.
In the settings, there is an option to switch between standard candlesticks and Heiken Ashi. When Heiken Ashi is selected, the indicator uses the Heiken Ashi close once it updates in real time, producing a smoothed view of intrabar price movement for the oscillator. This can help identify trends in RSI or Stochastic by making it easier to spot subtle changes in direction, though some may prefer the unmodified values that come from using regular candles. The combination of these candle styles with an oscillator’s output offers flexibility for different analytical preferences.
Traders who use RSI or Stochastic often focus on entry and exit signals derived from crossing certain thresholds, but they are usually limited to a single reading per bar. With this tool, it becomes possible to watch how the oscillator’s value evolves within the bar itself, which can be especially useful for shorter timeframes or for those who prefer a more granular look at momentum shifts. The visual separation between bullish and bearish candle bodies within the indicator can highlight sudden reversals or confirm ongoing trends in the oscillator, aiding in more precise decision-making. Because the candle overlay is cleared as soon as the bar closes, the chart remains uncluttered when scrolling through historical data, ensuring that only the necessary real-time candle information is displayed.
Overall, this indicator is intended for users who wish to track intrabar changes in RSI or Stochastic, with the added choice of standard or Heiken Ashi candle representation. The real-time candle overlay clarifies short-lived fluctuations, while the standard line plots maintain the usual clarity of past data. This approach can be beneficial for those who want deeper insights into how oscillator values develop in real time, without permanently altering the simplicity of the chart’s historical view.
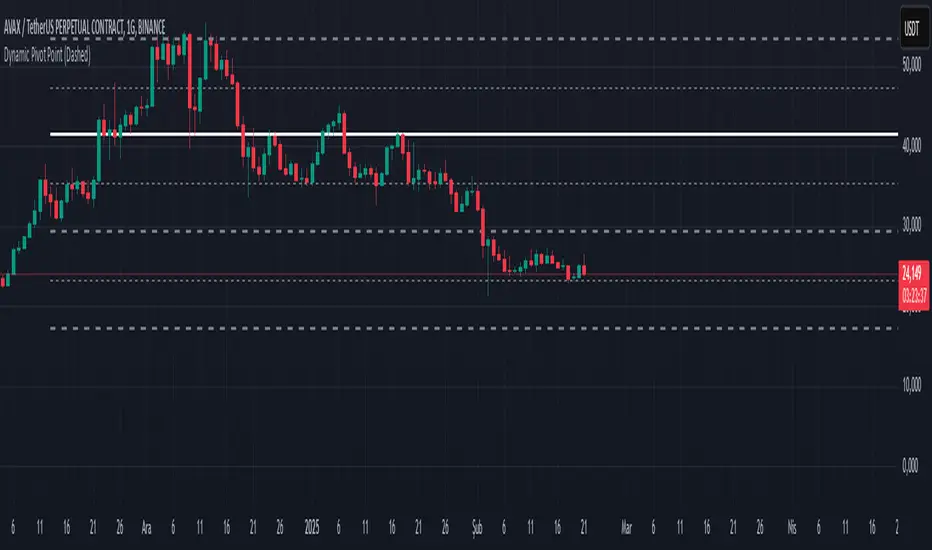
Dynamic Pivot PointsDynamic Pivot Point Indicator
The Dynamic Pivot Point is an indicator used on the TradingView platform that dynamically calculates pivot points and displays them on the chart. This indicator provides automatically adjustable support and resistance levels for different timeframes. By visualizing dynamic levels that match current market conditions, traders can plan their strategies more effectively.
Features
Adapts to Timeframes
The indicator automatically selects the appropriate pivot calculation method based on the user's current timeframe. For example:
For short timeframes such as 1, 3, or 5 minutes, it uses daily (1D) data.
For medium timeframes like 15, 30, or 60 minutes, it uses weekly (1W) data.
For longer timeframes such as 120, 180, or 240 minutes, it uses monthly (1M) data.
For very long timeframes like 360, 480 minutes, daily (D), or weekly (1W), it uses 12-month (12M) data.
Dynamic Pivot Levels
The indicator automatically calculates pivot levels based on the specified high and low values.
Flexible Line Style Options
Users can choose different line styles (Dashed, Dotted, Solid) to improve visual clarity on the chart.
Clean and Clear Visualization
The indicator automatically removes previous lines and displays the latest levels clearly on the chart, preventing clutter and allowing traders to focus more efficiently.
How It Works
Identifying High and Low Levels
The indicator retrieves previous and current high and low levels based on the selected timeframe.
New high and low levels are updated by comparing them with previous levels.
Calculating Pivot Levels
Pivot points are calculated using Fibonacci ratios between high and low levels.
These levels represent dynamic support and resistance zones.
Drawing Lines
The calculated levels are displayed as lines on the chart, each represented with different colors and styles.
Use Cases
Support and Resistance Levels
The indicator dynamically calculates and displays support and resistance levels, serving as reference points for buy and sell decisions.
Trend Analysis
Fibonacci levels help identify trend strength and potential reversal points.
Risk Management
Pivot points assist in setting stop-loss and take-profit levels.
Multi-Timeframe Analysis
Since the indicator adapts to different timeframes, it can be used for both short-term and long-term analysis.
Advantages
✅ Automatic Calculation: No manual calculations are required, as it updates dynamically.
✅ Flexible Timeframe Support: Adapts to different timeframes.
✅ Visual Clarity: Line styles and colors make it easy to distinguish levels on the chart.
✅ Fibonacci Integration: Adds depth to technical analysis.
Conclusion
The Dynamic Pivot Point indicator is a useful tool for both beginners and experienced traders. By dynamically calculating pivot points and Fibonacci levels, it simplifies market analysis and aids in strategy development. With its flexible structure and clear visualization, it can be effectively used across all timeframes.
6 dakika önce
Sürüm Notları
This indicator is written for Support Resistance Traders
Price Change IndicatorPrice Change Indicator (PCI)
Version: 1.0
Author: LazyTrader 🚀
🔍 Overview
The Price Change Indicator (PCI) helps traders visualize and compare price changes between the current bar and the previous bar. It provides a customizable display of price changes in two formats:
Percentage (%) Change – Relative price movement.
Natural Change – Absolute difference in price units.
⚙️ Key Features
✅ Customizable Calculation Method: Choose how the price change is calculated:
Opening Price
Closing Price
High
Low
✅ Flexible Display Format:
Show Percentage (%) Change.
Show Natural (Absolute) Change in price.
✅ Adjustable Sensitivity with Multiplier:
100 (Standard Change)
1000 (Small Change)
10000 (Tiny Change)
✅ Intuitive Labeling:
Green label (above bar) for increase.
Red label (below bar) for decrease.
No label if no change.
Large, easy-to-read labels for better visibility.
✅ Perfect for Any Market:
Stocks 📈
Forex 💱
Crypto 🚀
Commodities 🛢️
📊 How It Works
The indicator calculates the difference between the current and previous bar’s price based on your chosen method.
The result is displayed as either a percentage (%) or a natural price change.
If the price has increased, a green label is displayed above the bar.
If the price has decreased, a red label is displayed below the bar.
⚡ How to Use
Add the indicator to your chart.
Go to settings and customize:
Select calculation method (Open, Close, High, Low).
Choose display format (% or Natural Change).
Adjust multiplier for more sensitivity.
Analyze the labels to see price movements easily!
🔧 Settings Explained
Setting Description
Price Calculation Method: Choose Open, Close, High, or Low price for comparison.
Display Format: Show either % Change or Natural Change.
Multiplier: Apply 100, 1000, or 10000 to scale small price changes.
Show Labels: Toggle labels on/off.
🎯 Best Use Cases
🔹 Identifying strong price movements
🔹 Spotting trends and momentum shifts
🔹 Comparing price movement intensity
🔹 Works for scalping, swing trading, and long-term analysis

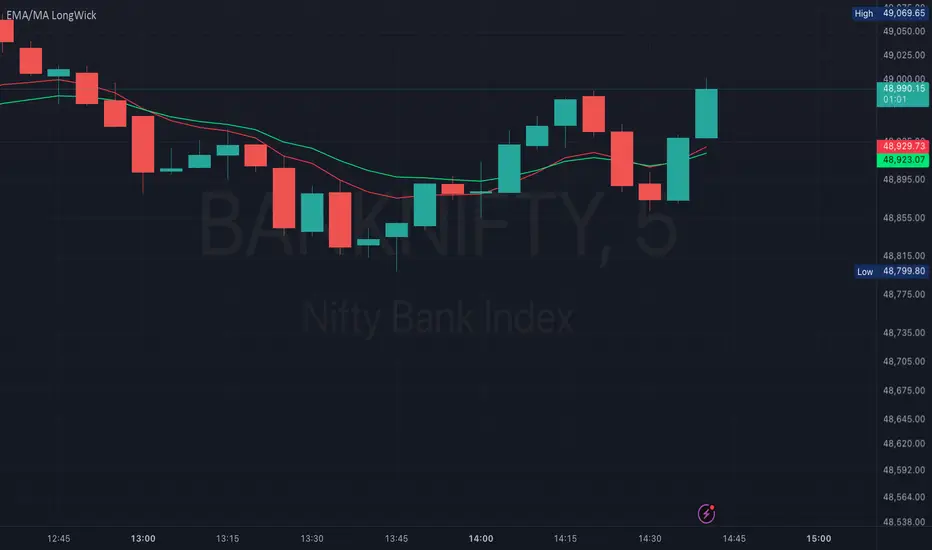
EMA/MA with OHCL Candle and Long Wick – A Comprehensive Trading
Dear Traders,
I am excited to introduce EMA/MA with OHCL Candle and Long Wick, a powerful trading indicator designed to enhance market analysis by combining Exponential Moving Averages (EMA), Simple Moving Averages (MA), OHCL candle patterns, and long wick detection into a single tool.
Key Features:
✅ Customizable Wick Size & Timeframe – Adapt the indicator to different market conditions by adjusting wick size and analyzing price action over any timeframe.
✅ EMA & MA for Trend Analysis – Includes multiple EMAs and MAs (5, 9, 15, 20, 50, 100, 200) to help identify trends and potential reversals.
✅ Long Wick Signal Detection – Identifies strong Buy and Sell opportunities based on wick size, signaling potential market turning points.
✅ OHCL Candle Analysis – Highlights OHCL patterns to provide additional insights into price action.
✅ User-Friendly & Lightweight – Efficiently coded for seamless performance on TradingView.
This indicator is perfect for traders looking to refine their entry and exit strategies by leveraging price action and moving averages. Whether you're a scalper, day trader, or swing trader, this tool provides valuable insights to enhance your decision-making.
Give it a try, and let me know your feedback! 🚀
Best regards,
Purnendu Singh
Crystal Order BlockThe Crystal Order Block Indicator is a powerful tool designed to help traders identify key institutional order blocks with high precision. This indicator is ideal for traders following Smart Money Concepts (SMC) and Institutional Trading Strategies, providing clear insights into potential high-probability trade setups.
🔹 Key Features:
✔ Automatic Order Block Detection: Identifies valid bullish & bearish order blocks.
✔ Unmitigated Order Blocks Highlighted: Focuses on fresh order blocks for improved trade opportunities.
✔ Trend-Focused Trading: Works best when combined with market structure analysis.
✔ Multi-Timeframe Support: Suitable for scalping, swing trading, and intraday trading.
✔ Risk Management Enhancement: Helps traders refine entries and exits based on institutional price movements.
📈 How to Use the Crystal Order Block Indicator:
🔹 Identifying Order Blocks:
➡ The indicator automatically detects order blocks formed by institutional trading activity.
➡ Unmitigated order blocks are highlighted, indicating areas where price may react.
🔹 High-Probability Trade Setups:
➡ Buy Setup: Look for a bullish order block in an uptrend, confirming strength.
➡ Sell Setup: Identify a bearish order block in a downtrend for potential short trades.
🔹 Order Block Mitigation:
➡ The updated version filters out mitigated order blocks, allowing traders to focus on fresh trading opportunities.
📊 Best Practices & Timeframes:
🔸 Works on all timeframes, but higher accuracy is observed on M30 and above.
🔸 Best suited for Smart Money Trading, Institutional Trading, and Price Action Strategies.
🔸 Should be used with liquidity concepts and market structure analysis for enhanced precision.
⚠ Important Note:
This indicator is a technical tool designed to assist traders in market analysis. It does not guarantee success and should be used alongside proper risk management and trading discipline.

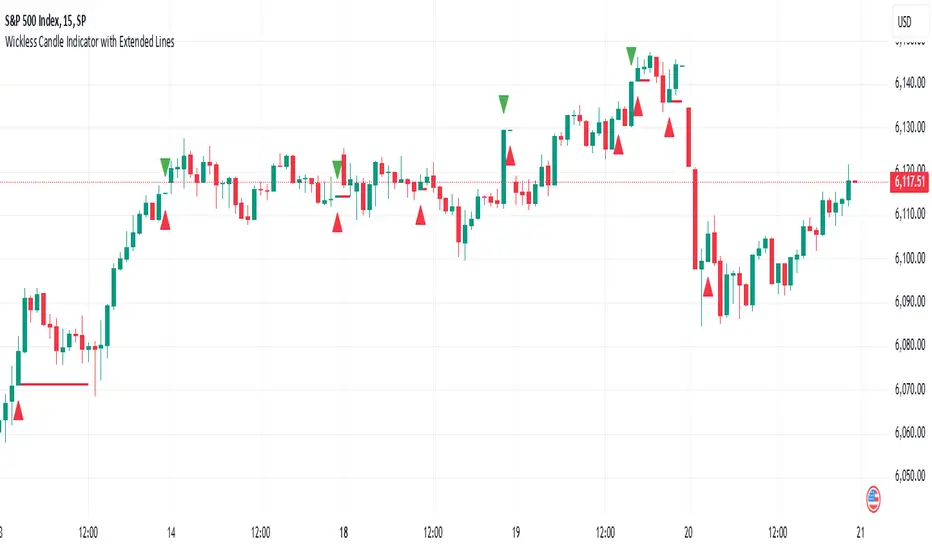
Wickless Candle Indicator with Extended Lines (final)This Pine Script indicator identifies “wickless” candles—those with no upper wick (when the close equals the high) or no lower wick (when the open equals the low)—and marks these events on the chart. When such a candle is detected, it:
Records the Level and Bar Index:
Saves the price level (high for wickless tops, low for wickless bottoms) and the bar index where the condition occurred.
Draws an Extended Horizontal Line:
Creates a green horizontal line for a wickless top or a red line for a wickless bottom, starting at the detection bar and extending across subsequent bars as long as the price remains below (for tops) or above (for bottoms) the recorded level.
Resets When the Price Breaks the Level:
If a future bar’s price moves beyond the saved level (i.e., a high above a wickless top or a low below a wickless bottom), the indicator resets that level, ending the extension of the line.
Visual Markers:
Additionally, it plots a small triangle above a wickless top and below a wickless bottom for easy identification on the chart.
Overall, this script helps traders visualize potential support or resistance levels created by candles that close at their highs or open at their lows, with lines that dynamically adjust as price evolves.
Price Action: Engulfing PatternsBullish Engulfing Pattern Detection: A bullish engulfing pattern is identified when the previous candle is bearish (close < open ), the current candle is bullish (close > open), and the current candle's body engulfs the previous candle's body (close >= open and open <= close ).
Bearish Engulfing Pattern Detection: A bearish engulfing pattern is identified when the previous candle is bullish (close > open ), the current candle is bearish (close < open), and the current candle's body engulfs the previous candle's body (open >= close and close <= open ).
Plotting the Patterns: The plotshape function is used to mark the detected patterns on the chart. Bullish engulfing patterns are marked below the bar with a green upward label, while bearish engulfing patterns are marked above the bar with a red downward label.

Hanzo_Wave_Price %Hanzo_Wave_Price % is a custom indicator for the TradingView platform that combines RSI (Relative Strength Index) and Stochastic RSI while also displaying the percentage price change over a specified period. This indicator helps traders identify overbought and oversold conditions, analyze price waves, and forecast potential market movements.
How It Works
1. RSI and Stochastic RSI Calculation
RSI is calculated based on the selected price source (default: close) with a user-defined Main Line period.
Stochastic RSI is then applied and smoothed using a moving average.
The Main Line represents the smoothed Stochastic RSI, serving as a wave indicator to help identify potential entry and exit points.
2. Overbought and Oversold Zones
The 70 and 30 levels indicate overbought and oversold zones, displayed as dashed lines on the chart.
Additional 20% and 10% levels provide a visual reference for historical price changes, aiding in future predictions.
3. Percentage Price Change Calculation
The indicator calculates the percentage price change over a Barsback period (default: 30 candles).
Users can choose a multiplier (100 or 1000) for better visualization (1000 scales the values by dividing by 10).
The data is displayed as a colored area:
Red (Short) → Negative price change.
Green (Buy) → Positive price change.
Settings & Parameters
Multiplier 💪 – Selects the scaling factor (100 or 1000) for percentage values.
Main Line ✈️ – Stochastic smoothing period (smoothK).
Don't touch ✋ – Reserved value (do not modify).
RSI 🔴 – RSI calculation period.
Stochastic 🔵 – Stochastic RSI calculation period.
Source ⚠️ – Price source for calculations (default: close).
Price changes % 🔼🔽 – Enables percentage price change display.
Barsback ↩️ – Number of candles used to calculate price change.
Visual Representation
Gray Line (Takeprofit Line 🎯) – Smoothed Stochastic RSI.
Red Dashed Line (70) – Overbought zone.
Blue Dashed Line (30) – Oversold zone.
Percentage Price Change Display:
Green Fill → Price increase.
Red Fill → Price decrease.
Advantages
✅ Combined Analysis – Uses RSI and Stochastic RSI for more accurate market condition identification.
✅ Flexibility – Customizable parameters allow adaptation for different markets and strategies.
✅ Visual Clarity – Clearly defined zones and dynamic percentage change display.
✅ Additional Market Insights – The percentage price change helps assess market volatility.
Disadvantages
⚠ Lagging Signals – Smoothing may cause delayed response.
⚠ False Breakouts – The 70/30 levels may not always work effectively for all assets.
⚠ IMPORTANT!
This indicator is for informational and educational purposes only. Past performance does not guarantee future profits! Use it in combination with other technical analysis tools. 🚀
Example 1: Identifying a Long Position
📌 Scenario:
The asset price has dropped significantly (1-hour timeframe), and the Main Line (gray line) crosses below the 30 level. This signals oversold conditions, which may indicate a potential reversal or upward correction.
✅ How to Use:
1️⃣ Identifying the Entry Zone:
If the Main Line is below 30, consider looking for a long entry point.
2️⃣ Confirming the Signal:
Place a vertical line at the moment when the Main Line crosses the 30 level from below.
3️⃣ Confirmation on a Lower Timeframe:
Switch to a 30-minute timeframe and wait for the Main Line to cross above the 70 level.
Enter a long position at this point.
4️⃣ Analyzing Percentage Price Change:
Check the historical indicator behavior:
If a similar past movement resulted in a ~10% price increase (green fill), this may indicate potential upward momentum.
5️⃣ Setting Take-Profit:
Set a take-profit level at 10%, based on previous price movements.
Also, monitor when the Main Line crosses the 70 level, as this may signal a potential profit-taking point.
📊 Conclusion:
This method helps to precisely determine entry points by confirming signals across multiple timeframes and analyzing the historical volatility of the asset. 🚀
Example 2: Analyzing Percentage Price Change
📌 Scenario:
You have set the Barsback parameter to 30, and the indicator shows +3.5%. This means that over the last 30 candles, the price has increased by 3.5%.
However, such small changes might be visually difficult to notice. To improve visibility, you can enable the multiplier (1000), which will scale the displayed percentage change to 35%. This is purely for visual convenience—the actual price movement remains 3.5%.
✅ How to Use:
1️⃣ Identifying Trend Direction:
If the percentage change is positive (green area) → Uptrend.
If the percentage change is negative (red area) → Downtrend.
2️⃣ Analyzing Movement Strength:
Compare the current percentage change with previous waves to evaluate the strength of the movement.
For example:
If previous waves reached 10% or more, a current wave of 3.5% might indicate a weak trend or a local correction.
3️⃣ Additional Filtering with the Main Line (Gray Line):
Use the Main Line to confirm the trend.
If the percentage change shows an increase, but the Main Line is still below 30, further upward movement can be expected.
If the percentage change indicates a decline, but the Main Line is above 70, there is a higher probability of a downward reversal.
"It's unfortunate that TradingView restricts adding images to indicator descriptions unless you have a paid subscription. This makes it harder to share free tools effectively."

FVG Reversal Sentinel🔵 FVG Reversal Sentinel – Multi-Timeframe Fair Value Gap Indicator
The FVG Reversal Sentinel is a powerful TradingView indicator designed to help traders identify and track Fair Value Gaps (FVGs) across multiple timeframes, all within a single chart.
This tool allows you to select up to five separate timeframes, ensuring you never miss key market shifts, whether you are scalping, day trading, or swing trading. You can use this indicator in any asset (Cryptos, Futures, Indices, Forex Pairs, etc.).
🔵 - Key Features -
Multi-Timeframe FVG Tracking – Select and display up to five different timeframes on one chart, providing a comprehensive view of market structure.
Customizable Colors – Adjust bullish and bearish FVG colors to match your chart theme for a seamless trading experience.
Enhanced Market Context – Quickly identify key liquidity zones and refine your entries and exits with precision.
Hide the lower timeframes FVGs to get a clear view in a custom timeframe.
Show or hide mitigated FVGs to declutter the chart.
FVGs boxes are going to be displayed only when the candle bar closes
FVGs are going to be mitigated only when the body of the candle closes above or below the FVG area.
No repainting
Whether you're looking to fine-tune your entries or gain a broader market perspective, the FVG Reversal Sentinel indicator ensures you have the tools to stay ahead of price action and capitalize on market inefficiencies.
🔵 - Customization-
You can change the indicator settings as you see fit to achieve the best results for your use case.
TIMEFRAMES
This indicator provides the ability to select up to 5 timeframes. These timeframes are based on the trader's timeframes including any custom timeframes.
Select the desired timeframe from the options list.
Add the label text you would like to show for the selected timeframe.
Check or uncheck the box to display or hide the timeframe from your chart.
FVG SETTINGS
Length of boxes: allows you to select the length of the box that is going to be displayed for the FVGs.
Delete boxes after fill?: allows you to show or hide mitigated FVGs on your chart.
Hide FVGs lower than enabled timeframes?: allows you to show or hide lower timeframe FVGs on your chart. Example - You are in a 15 minutes timeframe chart, if you choose to hide lower timeframe FVGs you will not be able to see 5 minutes FVG defined in your Timeframes Settings, only 15 minutes or higher timeframe FVGs will be displayed on your chart.
BOX VISUALS
Bullish FVG box color: the color and opacity of the box for the bullish FVGs.
Bearish FVG box color: the color and opacity of the box for the bearish FVGs.
LABELS VISUALS
Bullish FVG labels color: the color for bullish labels.
Bearish FVG labels color: the color for bearish labels.
Labels size: the size of the text displayed in the labels.
Labels position: the position of the label inside the FVGs boxes (right, left or center).
BORDER VISUALS
Border width: the width of the border (the thickness).
Bullish FVG border color: the color and the opacity of the bullish box border.
Bearish FVG border color: the color and the opacity of the bearish box border.
🔵 - How to use the indicator -
Just add the indicator in your chart and click in the settings option to customize it.
Make sure you select the desired timeframes and set the colors and opacity for the FVGs boxes.
This indicator can be used in many trading strategies, such as:
SILVER BULLET
iFVG
iFVG RETEST
These strategies are based on the use of FVGs, this tool can help you analyze the market and make the right decision.
🔵 - How was the indicator designed? -
I have spent a lot of time testing other open source indicators from the community. All of these indicators do a great job, but they have a problem, they not only mitigate FVGs when a candle closes above or below the FVG, they also mitigate FVGs when the candle closes exactly to the tick (not above or below the FVG). This is a problem for many strategies that rely on FVGs mitigation.
What makes this indicator different is that it focuses on just mitigating imbalances at the right time for these strategies.
I have taken ideas and some pieces of code from many community indicator developers, such as:
@twingall
@tflab
@marktools
@nacho-fx
@pmk07
... and many other people, to whom I thank for their valuable work and have allowed me to create this tool by making modifications to their source code.
🔵 - Disclaimer -
This tool is intended solely for informational and educational purposes and should not be regarded as financial, investment, or trading advice. It's not designed to predict market movements or offer specific recommendations. Users should be aware that past performance is not indicative of future results and should not rely on any indicator for financial decisions.

Highlight Specific Minute BarsThis is a simple way to view Goldbach Time, per the suggestion of @hopiplaka1
Any two minutes may be selected, however Hopi suggests 23 and 35.
Takes as input two user defined minutes and allows user to color each independently. Limits the painting to a user-set number of days back. Also, sets the forward projection to a user-set number of hours.
