Delta-Agnostic Correlation Coefficient (alt)Calculate a sort of correlation between two symbols based only on the sign of their changes, regardless of the amplitude of price change.
When positive, the two symbols tend to move together. When negative, the symbols move in opposite directions.
Since there is no significance calculation, and that the result is binary, keep in mind that correlation will always tend to go towards 1 or -1 even when there is no correlation. To reduce this issue, an EMA or SMA is applied to smooth out transitions: SMA smoothes over the selected length period but adds lag, whereas EMA smoothes amplitude without any additional lag. Hence, to know if the correlation is true or not, try to look at the amplitude and the number of consecutive days the correlation is maintained (both quantities are related), because when the correlation is spurious, it will tend to switch more or less alternatively between 1 and -1 and hence will hover around 0, whereas if the correlation is true, it will get further away from 0 and closer to 1 or -1.
In addition, since there is some time lag for the correlation to switch sign, the area is colored to know the current candle's correlation, regardless of past data's correlation: blue is a positive correlation (1), yellow is negative. The coloring can allow to know a trend reversal early on, but it's noisy.
Finally, symbols with closing days are better accounted for, with the correlation set to 0 on closed days (e.g., on week-ends), and the area is then colored in gray to signal that there is no new correlation data.
This is an improved fork over the original indicator by alexjvale, please show him some love if you like this work:
CC-5
Delta Agnostic Correlation CoefficientVisually see how well a symbol tracks another's movements, without taking price deltas into account.
For example, a 1% move on the index and a 5% move on the target will return a DCC value of 1. An index move of 0.5% on the index and a 10% move on the target will also return a DCC value of 1. The same happens for downward moves.
The SMA value can be set to smooth the curve. A larger value creates a smoother curve.
Technical Ratings Colored CandlesFor those that want technical ratings but don't want waste valuable screen real estate. Candles are colored to the rating strength. It also plots the results for "total", "MA" and "other" in a table on right of screen. Table and candle coloring can be turned off in style settings. This script uses the built in Technical Ratings indicator. For more informations on Technical Ratings please refer to official documentation.
Chart Champions CC Pocket 0.65 -0.666 Fib levels or commonly know as the CC pocket
Marks Strong Support/Ressitance, Use with conflunce.
Lookback Length is adjustable
Let me know any suggestions or ideas which could help improve
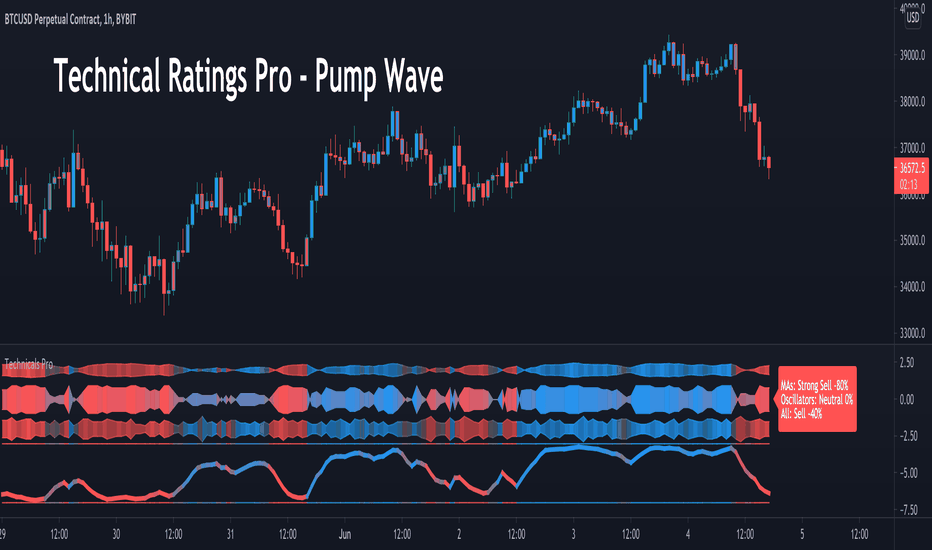
Technical Ratings Pro - Pump WaveThis script uses the built in Technical Ratings indicator but interprets the data visually. It plots the results for "total", "MA" and "other" as pump waves. It uses MA to plot a trend line (can be turned off in settings) . Candles are colored to the rating strength and a percentage number was added to the results. For more informations on the Technical Ratings indicator please refer to official documentation.


