Smooth Cloud + RSI Liquidity Spectrum + Zig Zag Volume ProfileSmooth Cloud + RSI Liquidity Spectrum + Zig Zag++ Volume Profile" Indicator
| Advanced Trend & Liquidity Analysis.
---
📌 Key Features & Enhancements (Zig Zag++)
This advanced indicator combines **trend-following moving averages, RSI momentum with liquidity factors, and an improved Zig Zag++ algorithm with volume profiling** for precise swing detection.
🔹 Zig Zag++ Upgrades:
✅ **Dynamic Reversal Detection** – Adapts to volatility using percentage-based pivots.
✅ **Volume-Weighted Swing Points** – Highlights high-liquidity turning points.
✅ **Multi-Timeframe Confirmation** – Uses historical pivots for stronger signals.
✅ **Volume Profile Clustering** – Reveals key support/resistance zones based on traded volume.
---
📊 Indicator Components Breakdown
1️⃣ Smooth Cloud (Trend Filter)
- **Fast MA (20-period) & Slow MA (50-period)** – Configurable as EMA, SMA, or WMA.
- **Cloud Coloring** – Green when fast MA > slow MA (bullish), red otherwise (bearish).
- **Purpose**: Acts as a trend filter—only take trades in the direction of the cloud.
2️⃣ RSI Liquidity Spectrum (Momentum + Volume)
- **RSI (14-period default)** – Standard momentum oscillator.
- **Liquidity-Adjusted Momentum** = `(RSI + ROC(RSI,3)) * (Volume / SMA(Volume, RSI Length))`
- **Purpose**: Identifies overbought/oversold conditions with volume confirmation (high volume = stronger signal).
3️⃣ Zig Zag++ (Swing Detection & Volume Profiling)
📈 Zig Zag Logic:**
- **Percentage-Based Reversals** (default: 5%) – Only plots swings exceeding this threshold.
- **Pivot Tracking** – Stores price & bar index of each swing point in arrays.
- **Dynamic Line Drawing** – Connects swing points with yellow trendlines.
📊 Volume Profile at Swings:
- **Lookback Period** (200 bars default) – Analyzes volume distribution between Zig Zag turns.
- **10-Price Bin Clustering** – Splits the price range into 10 levels and calculates traded volume at each.
- **Transparency Scaling** – Higher volume zones appear darker (stronger support/resistance).
---
🎯 Step-by-Step Trading Strategies
📈 Strategy 1: Trend-Following with RSI Liquidity Confirmation**
1. **Enter Long** when:
- Smooth Cloud is **green** (fast MA > slow MA).
- RSI Liquidity Momentum crosses above **30** (bullish momentum + volume).
- Price pulls back to the **Volume Profile high-volume zone** (demand area).
2. **Enter Short** when:
- Smooth Cloud is **red** (fast MA < slow MA).
- RSI Liquidity Momentum crosses below **70** (bearish momentum + volume).
- Price rallies into the **Volume Profile high-volume zone** (supply area).
3. **Exit** when:
- Zig Zag++ detects a new reversal (5% move against position).
- RSI Liquidity Momentum crosses back mid-level (50).
---
📉 Strategy 2: Swing Trading with Zig Zag++ Pivots**
1. **Buy at Swing Lows** when:
- Zig Zag++ prints a **higher low** (bullish structure).
- Volume Profile shows **strong absorption** (high volume at the low).
- RSI Liquidity Momentum is rising from oversold (<30).
2. **Sell at Swing Highs** when:
- Zig Zag++ prints a **lower high** (bearish structure).
- Volume Profile shows **distribution** (high volume at the top).
- RSI Liquidity Momentum is falling from overbought (>70).
3. **Stop Loss**:
- Below the recent Zig Zag low (for longs).
- Above the recent Zig Zag high (for shorts).
---
📌 Additional Enhancements (Pro Tips)**
- **Combine with Higher Timeframe (HTF) Cloud** – Use a 4H/1D cloud to filter trades.
- **Divergence Detection** – Hidden bullish/bearish divergences between Zig Zag & RSI Liquidity.
- **Volume Spike Confirmation** – Only trade if volume exceeds SMA(volume, 20) at reversal points.
---
🚀 Conclusion
This **all-in-one indicator** provides:
✔ **Trend direction** (Smooth Cloud)
✔ **Momentum + Liquidity strength** (RSI Spectrum)
✔ **Precise swing points** (Zig Zag++)
✔ **Volume-based S/R zones** (Profile Clustering)
Best used on **15M-4H timeframes** for swing/day trading. Adjust parameters based on asset volatility.
Centered Oscillators

EMA Cross + MACD Confluence (with Session-Start Entry)EMA Cross + MACD Confluence Strategy (with Session-Start Entry)
Idea originally from kirilov
Description:
This strategy blends a classic Exponential Moving Average (EMA) crossover system
with MACD histogram confirmation, all within your custom trading window. On each bar:
• Calculates two user-defined EMAs (Fast and Slow).
• Computes the MACD line, signal line, and histogram using customizable lengths.
• Only takes new trades during your chosen session hours and date range.
• Enters on a fresh crossover (or crossunder), OR immediately at session start
if the crossover condition is already true.
• Applies MACD confluence: long entries only when the MACD histogram is positive;
short entries only when it’s negative.
• Exits positions when the opposite EMA-cross signal fires or when the session closes.
Key Features:
• 100% user-defined parameters: EMAs, MACD lengths, session times, date range, and
long/short or both directions.
• Session-aware “catch-up” entry—never miss a trend that started before the market open.
• Lightweight and transparent: only standard Pine v6 functions, no external libraries.
Disclaimer:
This script is provided for educational and illustrative purposes only.
It is NOT financial advice, a recommendation to buy or sell, or a substitute for your
own due diligence. Past performance is no guarantee of future results. Trade at your
own risk.

Ro Trades Squeeze + MACD Buy Signals (All Timeframes)opurh9padh9foehfp9htrmhjhq87fg4ogo9gqogt578g48gbtguyteg

Ro Trades Squeeze + MACD Buy Signals For 1H, 4H, Daily, Weekly)Thanks for using our indicator
We are aware that our 4h signal has a bug, if you see a blank blue square with an arrow on the 4h it is our signal. We are trying to fix it at the moment, I will keep you updated on our twitter
or x linked here x.com .
Any other problems go to the link above.
How to use
If your having trouble using our software most questions should be answer here if you have any unanswered questions go to the x link above 😀
Start by adding our software to your chart, then select your timeframe to either 4h or 1h and check for a green 1h box with arrow it should say 1h and on the 4h look of a blue 4h box with arrow not displaying the text 4h . Then you can use it all you like!
The code for the broken blue box color=color.new(color.blue, 0), style=shape.labelup, size=size.small, text="4H")
Our software is still in beta it could be inaccurate

Ro Trades Squeeze + MACD Buy Signals For 1H, 4H, Daily, Weekly)Thanks for using our indicator
We hope it helps and enables you to scan the market for potential buying opportunities. Feel free to ask any questions on our twitter post linked below
or x linked here x.com .
Any other problems go to the link above.
How to use
Start by adding our software to your chart, then select your timeframe to 1h, 4h, daily or weekly and look for the colored boxes with arrows point to the candle it is on, you can drag the labels up or down for cleaner reading of other indicators/charts.
Our software is still in beta it could be inaccurate

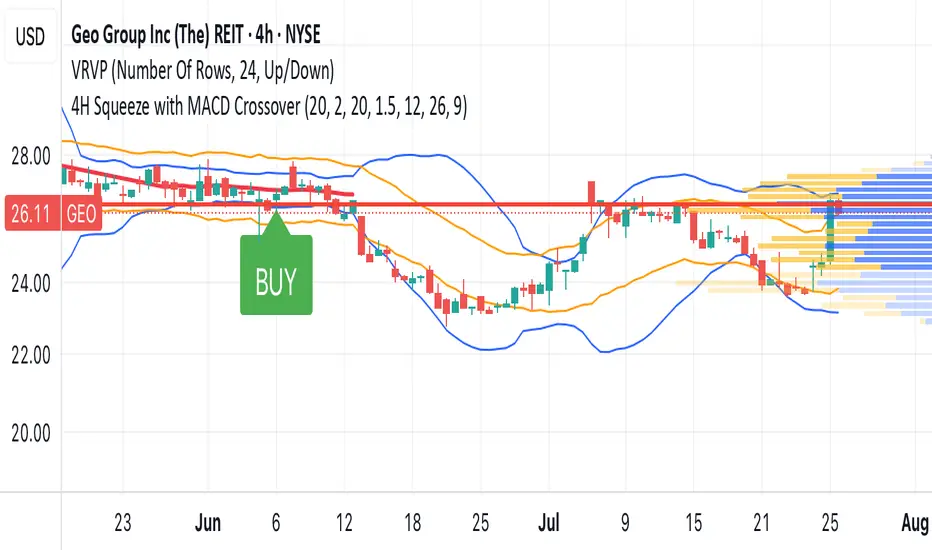
RSI-CCI Momentum ScreenerRSI-CCI Momentum Screener;
How to Use:
Apply this script to 1H or 4H timeframe
Works well for NSE stocks, crypto, or forex
Look for a green label “BUY” that shows when the screener conditions are met

Ro Trades MACD Squeeze 1h, 4h buy signals Thanks for using our indicator
We are aware that our 4h signal has a bug, if you see a blank blue square with an arrow on the 4h it is our signal. We are trying to fix it at the moment, I will keep you updated on our twitter
or x linked here x.com .
Any other problems go to the link above.
How to use
If your having trouble using our software most questions should be answer here if you have any unanswered questions go to the x link above 😀
Start by adding our software to your chart, then select your timeframe to either 4h or 1h and check for a green 1h box with arrow it should say 1h and on the 4h look of a blue 4h box with arrow not displaying the text 4h . Then you can use it all you like!
The code for the broken blue box color=color.new(color.blue, 0), style=shape.labelup, size=size.small, text="4H")
Our software is still in beta it could be inaccurate

Stochastic MACDStochastic MACD Indicator: Quick Guide
This Pine Script indicator, "Stochastic MACD" (SMACD), blends MACD and Stochastic Oscillator principles to help you spot momentum shifts and potential reversals.
What it Shows:
SMACD Line: Tracks momentum.
Signal Line: Averages the SMACD line, creating crossovers.
Histogram: Visualizes momentum strength, changing color with direction.
Overbought/Oversold Levels: (Default 10 and -10) Help identify stretched market conditions. Adjustable in settings.
Visual Signals (Triangles):
Red Down Arrow (Overbought Signal): Appears when both SMACD and Signal lines are above the Overbought level (default 10) AND SMACD crosses the Signal line upwards. This suggests strong overbought conditions and a potential reversal down.
Green Up Arrow (Oversold Signal): Appears when both SMACD and Signal lines are below the Oversold level (default -10) AND SMACD crosses the Signal line upwards. This suggests potential buying opportunities from oversold conditions and a possible reversal up.
How to Use It:
Confirm Trends: Use the histogram and line directions.
Spot Reversals: Look for the red and green triangles for quick alerts.
Combine: Always use with other analysis like price action or support/resistance.
Important: This is an analytical tool, not financial advice. Trading involves risk.

WallSwiss Branding//@version=5
indicator("WallSwiss Branding", overlay=true)
label.new(bar_index, high, "WALLSWISS", style=label.style_label_down,
textcolor=color.white, size=size.normal, yloc=yloc.abovebar)

RSI-Stochastic Combined Oscillator(Mastersinnifty)Description
The RSI-Stochastic Combined Oscillator blends the strengths of RSI and Stochastic indicators to offer a refined view of market momentum. This custom oscillator highlights high-probability turning points using both value crossovers and directional momentum filters. Enhanced signal logic distinguishes between strong and weak trade setups.
How It Works
Calculates RSI and Stochastic %K using user-defined lengths.
Generates a combined oscillator by averaging RSI and Stochastic %K.
Smoothes the output with configurable MA for clarity.
Generates bullish/bearish signals based on crossover logic and momentum strength.
Includes overbought/oversold zones and background color warnings.
Optional signal table displays real-time values for RSI, Stochastic, Combo, and Signal Line.
Inputs
RSI Length – Period for RSI calculation.
Stochastic %K/%D Length – Periods for Stochastic values.
Combined Oscillator Smoothing – Moving average smoothing period.
Overbought/Oversold Levels – Thresholds for signal filtering and background alerts.
Use Case
Ideal for traders looking to:
Confirm entries using dual momentum logic.
Filter out noise with smoothed oscillators.
Identify high-conviction reversal zones.
Receive alerts based on strong and weak momentum shifts.
Disclaimer
This indicator is designed for educational purposes only and does not constitute financial advice. Always conduct your own analysis before making trading decisions.

Buy/Sell Signals(Mastersinnifty)Description
This script generates simple Buy/Sell signals based on the Relative Strength Index (RSI) crossing the midpoint level of 50. It's designed for traders who prefer clear, rule-based entries and exits derived from momentum shifts.
How It Works
Calculates RSI using the closing price and a 14-period length.
Generates a Buy signal when RSI crosses above 50, indicating potential bullish momentum.
Generates a Sell signal when RSI crosses below 50, indicating potential bearish momentum.
Plots the signals as labels directly on the price chart.
Inputs
RSI Source: Close (fixed in the script)
RSI Length: 14 (standard default)
Use Case
Useful for identifying momentum shifts and trend confirmations.
Can be combined with other technical tools like support/resistance or volume for enhanced decision-making.
Best suited for intraday or swing trading strategies that use momentum-based entry signals.
Disclaimer
This indicator is intended for educational and informational purposes only. It does not constitute financial advice. Always perform your own due diligence and consult a financial advisor before making trading decisions.

10-Bar Breakout + Volume + Adjustable Target(Mastersinnifty)Description
This indicator identifies potential breakout opportunities from short-term price congestion zones, confirmed with volume. It dynamically highlights breakout signals and plots corresponding price targets using adjustable parameters.
How It Works
Calculates the highest high and lowest low over the past N bars (default: 10) to define a congestion range.
Confirms a breakout only if volume exceeds the average (SMA or EMA) by a user-defined multiplier.
Plots arrows for Buy or Sell signals based on breakout direction.
Sets a price target using a configurable multiple of the congestion range.
Highlights breakout bars with subtle background colors.
Optionally displays the calculated volume threshold for reference.
Inputs
Congestion Bar Count : Number of bars to define the congestion range.
Volume Multiplier : Volume must exceed this multiple of average volume.
Volume MA Type : Select between SMA or EMA for volume calculation.
Target Multiplier : Controls how far the price target is from the breakout level.
Use Case
Identify high-probability breakout opportunities with volume confirmation.
Set dynamic price targets based on recent market structure.
Avoid entries during low-volume or false breakout conditions.
Disclaimer
This script is for educational and analytical purposes only. Use appropriate risk management and test any strategy thoroughly before using it in live trading.

HMA Strategy HMA Strat (Hull Moving Average Strategy) Indicator Description
The HMA Strat is a trend-following strategy that uses a dual Hull Moving Average system. It helps identify continuation and high-probability reversal signals in both bullish and bearish market conditions. The strategy aims to reduce noise while maintaining sensitivity to changes in price momentum by comparing the standard Hull Moving Average (HMA) to a smoothed version.
This strategy is ideal for traders who focus on systematic backtesting, momentum entry, and simple charts. It features integrated plotting, color-zoning, and strategic actions based on TradingView's strategy engine. The system provides dynamic long and short signals based on crossover logic.
Key Features
Dual HMA Framework: To improve signal quality and reduce choppy trend identification, it compares a regular HMA with a smoothed version (HMA3).
Entries Based on Crossover
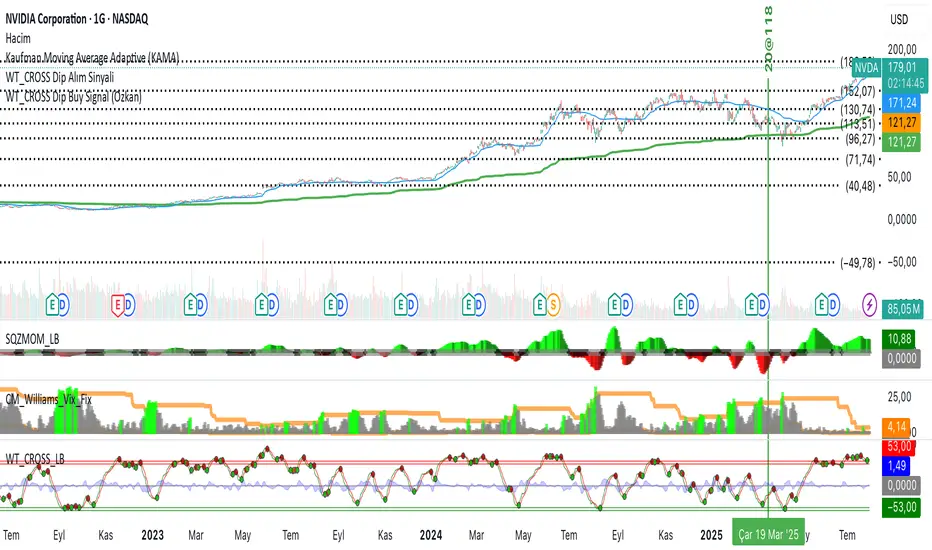
WT_CROSS Dip Buy Signal(ozkan)This script identifies potential buy opportunities based on WaveTrend (WT_CROSS) momentum crossing below the -60 level — often indicating oversold conditions.
Additional filters include price being above the Kaufman Adaptive Moving Average (KAMA) and volume below the 5-period average, which helps isolate pullbacks within an uptrend.
Buy Signal Conditions:
WT1 < -60
Price > KAMA
Volume < 5-period SMA of volume
Purpose:
To capture early entries at possible local bottoms during bullish trends while avoiding high-volume breakdown traps.
🔔 You can also set an alert based on this condition.
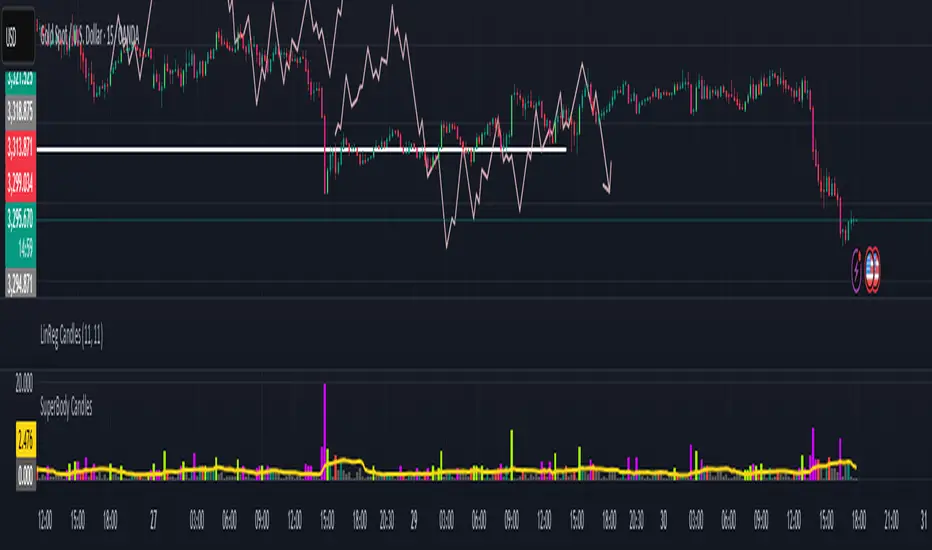
SuperBody CandlesInspired by the original script by Gautam_Dixit.
Updated to the latest Pine Script v6, now featuring fully customizable color settings so users can tailor hues to their preference.
Description:
The Momentum Candle indicator highlights bars whose real body significantly exceeds the 15-period average. 'Super' bullish and bearish candles (body ≥ 1.5× avg) receive standout colors, while above-average and below-average bars are tinted differently to reflect momentum strength.
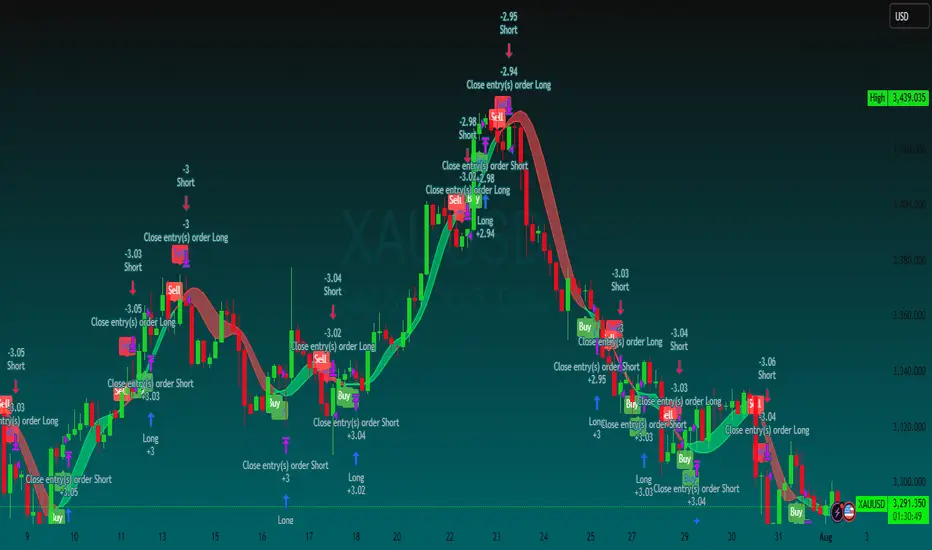
Double MACD StrategyDouble MACD Strategy (Default Settings)
This automated strategy uses two independent MACD indicators to flip between long and short positions.
How It Works
• Fast MACD (MACD 1) captures rapid micro-trends
• Slow MACD (MACD 2) confirms broader momentum
• Long Entry when both MACD lines cross above their signal lines
• Short Entry when both MACD lines cross below their signal lines
• Existing opposing trades are closed before opening new ones
Default Input Settings
• Fast MACD (MACD 1)
• Fast Length 1: 12
• Slow Length 1: 26
• Signal Length 1: 9
• MA Type 1: EMA
• Slow MACD (MACD 2)
• Fast Length 2: 24
• Slow Length 2: 52
• Signal Length 2: 9
• MA Type 2: EMA
• Position Sizing: 100 % of equity
• Pyramiding: 1 concurrent entry per direction
Usage
1. Apply to any chart on your desired timeframe.
2. Monitor background shading (green for bullish, red for bearish bias).
3. Manage risk with your own stop loss, take profit, and position-sizing rules.
Disclaimer
This script is provided for educational purposes only. It is not financial advice or a recommendation to buy or sell any instrument. All trading involves risk, and any losses incurred are the sole responsibility of the trader.

Momentum DivergenceOverview
The Momentum Divergence Oscillator is a valuable tool designed for traders who are familiar with basic charting but want to deepen their market insights. This indicator combines a momentum calculation with divergence detection, presenting the data in an intuitive way with a blue momentum line and colored divergence signals ("Bull" and "Bear"). It’s perfect for refining entry and exit points across various timeframes, especially for scalping or swing trading strategies.
Understanding the Concepts
What is Momentum?
Momentum measures the speed and strength of a price movement by comparing the current closing price to a previous close over a set period. In this indicator, it’s calculated as the difference between the current close and the close from a user-defined number of bars ago (default: 10). A rising momentum line indicates accelerating upward momentum, while a falling line suggests slowing momentum or a potential reversal. This helps you gauge whether a trend is gaining power or losing steam, making it a key indicator for spotting overbought or oversold conditions.
What is a Divergence?
A divergence occurs when the price action and the momentum indicator move in opposite directions, often signaling a potential trend reversal. The Momentum Divergence Oscillator highlights two types:
Bullish Divergence: When the price forms a lower low (indicating weakness), but the momentum shows a higher low (suggesting underlying strength). This can foreshadow an upward reversal.
Bearish Divergence: When the price reaches a higher high (showing strength), but the momentum records a lower high (indicating fading momentum). This may hint at an impending downward turn.
How the Indicator Works
The indicator plots a momentum line in a separate pane below your chart, giving you a clear view of price momentum over time. It also scans for divergences using adjustable lookback periods (default: 5 bars left and right) and a range window (default: 5-60 bars) to ensure relevance. When a divergence is detected, it’s visually highlighted, and you can customize the sensitivity through input settings like the momentum length and pivot lookback. Alerts are included to notify you of new divergence signals in real-time, saving you from constant monitoring.
How to Apply It
Identifying Opportunities: Use bullish divergences ("Bull") as a cue to consider long positions, especially when confirmed by support levels or a moving average crossover. Bearish divergences ("Bear") can signal short opportunities, particularly near resistance zones.
Combining with Other Tools: Pair this oscillator with indicators like the Relative Strength Index (RSI) or volume analysis to filter out false signals and increase confidence in your trades. For example, a bullish divergence with rising volume can be a stronger buy signal.
Timeframe Flexibility: Test it on shorter timeframes (e.g., 5-minute charts) for quick scalping trades or longer ones (e.g., 1-hour or 4-hour charts) for swing trading, adjusting the momentum length to suit the market’s pace.
Alert Setup: Enable the built-in alerts to get notified when a divergence forms, allowing you to react promptly without staring at the screen all day.
Strategy Example
Spot a bullish divergence on a 15-minute chart where the price hits a lower low, but the momentum rises.
Confirm with a break above a 20-period EMA and increasing volume.
Enter a long position with a stop-loss below the recent low and a take-profit near the next resistance level.
Customization Tips
Adjust the "Momentum Length" (default: 10) to make the oscillator more or less sensitive—shorter lengths react faster, while longer ones smooth out noise.
Tweak the "Pivot Lookback" settings to widen or narrow the divergence detection range based on your trading style.
Use the "Range Upper/Lower" inputs to focus on divergences within a specific timeframe that matches your strategy.
Important Considerations
b]This indicator is a technical analysis tool, not a guaranteed trading system. Always pair it with a solid strategy and strict risk management, such as setting stop-losses.
In strong trending markets, divergences can sometimes produce false signals. Consider adding a trend filter (e.g., ADX below 25) to avoid whipsaws.
Experiment with the settings on a demo account or backtest to find what works best for your preferred markets and timeframes.

RSI and MACD Divergence IndicatorThe RSI and MACD Divergence Indicator is a custom Pine Script v6 indicator designed for TradingView that identifies and visualizes divergences between price movements and two technical indicators: the Relative Strength Index (RSI) and the Moving Average Convergence Divergence (MACD). Here's a brief explanation of its functionality:
Divergence Detection: The indicator detects both regular and hidden divergences for RSI, MACD (MACD Line), and Histogram. Regular bullish divergences occur when price makes a lower low but the indicator makes a higher low (suggesting a potential reversal upward), while regular bearish divergences occur when price makes a higher high but the indicator makes a lower high (suggesting a potential reversal downward). Hidden divergences indicate continuation patterns (e.g., higher low in price with a lower low in the indicator for bullish continuation).
Customizable Inputs:
Pivot Bars: Sets the number of bars used to confirm pivot highs and lows (default: 5).
RSI and MACD Parameters: Allows adjustment of RSI length (default: 14) and MACD settings (fast: 12, slow: 26, signal: 9).
Toggle Options: Enables/disables detection of regular and hidden divergences for RSI, MACD, and Histogram individually.
Confirmation: Option to wait for pivot confirmation (default: true), delaying divergence display until the pivot is fully formed.
Show Only Last Divergence: Toggles between showing only the most recent divergence (default: true) or all detected divergences (false), with previous lines and labels cleared when true.
Minimum Divergences: Sets the minimum number of divergence types required at a pivot to display (default: 1, max: 6).
Maximum Pivot Points: Limits the number of historical pivot points to check (default: 10).
Maximum Bars to Check: Restricts analysis to the last specified number of bars (default: 500).
Visualization:
Draws lines connecting the price pivot points where divergences are detected, with customizable colors, widths, and styles (solid, dashed, dotted) for RSI and MACD.
Displays a single label per pivot with vertically stacked text listing all detected divergence types (e.g., "RSI Bull Div MACD Bull Div"), using semi-transparent backgrounds (green for bullish, red for bearish) and white text.

MACD-RSI Divergence OscillatorMACD-RSI Divergence Oscillator: Dual Confirmation with Momentum + Divergence Signals
This powerful oscillator combines MACD and RSI into a single normalized visual tool, enriched with automatic divergence detection and smart signal alerts. It’s designed to give traders advanced insights into momentum shifts and trend reversals.
Key Features:
• MACD + RSI Combo: Both indicators are scaled and merged into one oscillator for clearer interpretation.
• Automatic Divergence Detection:
• Bullish & Bearish divergences on both MACD and RSI
• Highlights strong divergences when both confirm
• Trading Signals:
• Detects MACD crossovers and RSI reversals
• Smart buy/sell signals based on momentum + divergence
• Custom Oscillator View:
• Plots MACD and RSI on the same scale
• Visual zero-line, overbought/oversold levels, and customizable colors
• Optional Dashboard Table:
• Displays live indicator values, signal states, and divergence status
Ideal For:
• Spotting early trend reversals
• Confirming trade entries/exits
• Avoiding false signals using dual indicator logic
Highly customizable and suitable for all timeframes and asset types.

Market DashboardMarket Dashboard — All-in-One Technical Indicator Panel
The Market Dashboard is a powerful visual tool that consolidates key technical indicators into a single on-chart table, helping traders make faster and more informed decisions. This script includes:
RSI — Detects overbought and oversold market conditions
MACD — Shows trend momentum and crossover signals
CVD (Cumulative Volume Delta) — Highlights buyer vs. seller pressure
Volume Analysis — Flags unusually high volume
ATR (Average True Range) — Displays current market volatility
Session Detector — Automatically identifies ASIAN, LONDON, or NEW YORK sessions based on UTC time
Fully Customizable — Adjust table position and text size to fit your chart layout
Designed for traders who want a clean, real-time snapshot of market dynamics, directly on the chart.

Pivot Squeeze StrategyStrategy based on Pivot Squeeze Oscillator Indicator for backtesting.
Features:
- Pivot Lookback adjustment
- Trade Both Directions, Long Trades Only, Short Trades Only
- Use Pivot Divergence Breakout logic, Pivot Divergence MA Cross Zero logic, or Pivot Divergence MA Cross Slow MA logic
- Adjustments for Breakout Threshold
- Risk Management (Stop Loss/Take Profit/etc)
- Visual Information
- Backtesting Period customization

Combined and Count of Bull Bear Alerts for OBV, TDI, CCI, MACDCombined and Count of Bull Bear Alerts for OBV, TDI, CCI, MACD
Description
This powerful indicator combines four popular technical analysis tools (On-Balance Volume, Traders Dynamic Index, Commodity Channel Index, and MACD) into a single comprehensive divergence detection system. It monitors all four indicators simultaneously and provides real-time alerts when bullish or bearish divergences occur across multiple indicators, helping traders identify high-probability reversal opportunities.
Key Features
Multi-Indicator Divergence Detection: Simultaneously tracks divergences in OBV, TDI, CCI, and MACD
Comprehensive Signal Counting: Displays real-time count of bullish (1-4) and bearish (1-4) divergences
Four Customizable Alert Conditions:
Alert 1: 1-4 indicators showing bullish divergence
Alert 2: 3-4 indicators showing strong bullish divergence
Alert 3: 1-2 indicators showing bearish divergence
Alert 4: 3-4 indicators showing strong bearish divergence
Visual Signal Display: Clear numerical indicators showing how many tools are signaling divergence
Customizable Parameters: Adjustable settings for each indicator's sensitivity and display preferences
Overlay Display: All signals shown directly on the price chart for easy analysis
How It Works
The indicator continuously monitors each technical tool for both regular and hidden divergences using pivot point analysis. When a divergence pattern is detected, it increments the appropriate counter (bullish or bearish). The system then displays the total count as colored numbers on the chart and can trigger alerts based on your preferred signal strength thresholds.
Trading Applications
Strong Reversal Signals: Look for 3-4 indicator confirmations for high-probability trades
Early Trend Detection: Use 1-2 indicator signals for early entry opportunities
Confirmation Tool: Validate your trading signals with multi-indicator divergence confirmation
Risk Management: Avoid trading against multiple indicator divergences
Customization Options
Adjustable lookback periods for each indicator
Toggle visibility of bullish/bearish counters
Customizable colors, positions, and display styles
Option to show individual indicator signals
Configurable divergence detection parameters
This indicator is particularly valuable for traders who want to combine multiple technical analysis approaches into a single, easy-to-monitor system that highlights confluence opportunities across different market perspectives (volume, momentum, cycle, and trend).
