Essa - Market Structure & Fibonacci ToolkitEssa – Market Structure & Fibonacci Toolkit” is an all-in-one TradingView Pine Script indicator that detects and labels multi-tier market structure (HH, HL, LH, LL), draws dynamic Fibonacci retracements with customizable levels and a highlighted “Golden Zone,” marks Fair Value Gaps, and overlays enhanced session ranges. It also computes a weighted multi-timeframe trend strength score, displays comprehensive tables for trend analysis and Fibonacci distance/touches, and generates optional alerts for confluence events.
Key Features
Adaptive Pivot Detection: Volatility-scaled lookbacks automatically adjust pivot sensitivity.
Multi-Tier Structure Labelling: Short, intermediate, and long-term swing highs/lows with CHoCH (change-of-character) break lines.
Custom Fibonacci Toolkit: 0–100% retracements plus user-configurable 23.6, 38.2, 50, 61.8, 70.5, 78.6 levels; dynamic Golden Zone shading.
Fair Value Gaps (FVG): Bullish/bearish gap detection, age display, and confluence highlighting when in the Golden Zone.
Session Analysis: Colorized backgrounds, high/low/mid plots and range calculations for London, New York, and Asia sessions.
Multi-Timeframe Confirmation: Auto-selected higher-timeframe pivot alignment and weighted scoring.
Trend Strength Table: Scores HTF alignment, current-TF pattern, momentum, and confluence in a compact dashboard.
Distance & Touch Tracking: Fibonacci price-distance table with pip/point calculations, touch counts, and session annotations.
Alert System: Configurable alerts for CHoCH, Golden Zone entries, FVGs, and level touches.
Who It’s For
Price-Action Traders seeking visual confirmation of market swings and trend shifts.
Fibonacci Enthusiasts who want fully custom retracement levels with confluence zones.
Multi-Timeframe Analysts needing a single overlay to gauge alignment across chart horizons.
Session Strategists trading specific forex or equity sessions with clear range and momentum cues.
Advanced Traders who appreciate consolidated tables, exact touch markers, and automated alerting for high-conviction setups.
Chart patterns

SMC de SmartProfit [ROMERR14]This all-in-one indicator displays real-time market structure (internal & swing BOS/CHoCH), order blocks, premium & discount zones, equal highs & lows, and much more... allowing traders to automatically mark up their charts using widely used price action methodologies.
Smart Money Concepts (SMC) is a relatively new but widely adopted term among price action traders looking to more accurately navigate liquidity and identify more optimal points of interest in the market. Attempting to determine where institutional market participants place their orders (buy or sell-side liquidity) can be a reasonable approach to finding practical entries and exits based on price action.
The indicator includes alerts for swing structure changes and many other relevant conditions.
✨ Features
This indicator includes many SMC-relevant features, highlighted below:
Full internal & swing market structure labeling in real-time
Break of Structure (BOS)
Change of Character (CHoCH)
Order Blocks (bullish & bearish)
Equal Highs & Lows (EQH/EQL)
Fair Value Gap (FVG) Detection
Previous Highs & Lows
Premium and Discount zones displayed as a range
Multiple styling options for easier concept visualization
⚙️ Settings
Mode: Historical (default) or Present to only display recent data.
Style: Colored (default) or Monochrome.
Color Candles: Based on internal and swing structure.
Internal Structure: Displays labels and dashed lines for BOS/CHoCH.
Confluence Filter: Filters out non-significant internal breakouts.
Swing Structure: Displays labels and solid lines for larger BOS/CHoCH.
Swing Points: Displays HH, HL, LH, LL labels.
Internal Order Blocks: Enable & choose how many to display.
Swing Order Blocks: Same as above for swing structure.
EQH/EQL: Detects equal highs and lows.
Bars Confirmation: Sets how many bars are required to confirm EQH/EQL.
Fair Value Gaps: Highlights imbalance areas on the chart.
Auto Threshold: Filters out insignificant FVGs.
Timeframe: Sets the timeframe for FVG detection.
Extend FVG: Choose how many bars to extend the FVG box visually.
Highs & Lows MTF: Display important daily, weekly, and monthly levels.
Premium/Discount Zones: Show Premium, Discount, and Equilibrium zones.
💡 Usage
Users can see automatic BOS and CHoCH labels to detect market structure breaks and trends.
Equal Highs and Lows (EQH/EQL) can also signal potential reversal zones.
Order Blocks help identify areas likely influenced by institutional trading.
They can be used for entries or targets.
Premium/Discount zones provide reference points for optimal entries.
🧠 Conclusion
This indicator highlights all key components of the Smart Money Concepts methodology, which can serve as a valuable interpretation of market structure, liquidity, and in simple terms, price action.
These concepts do not guarantee successful trades nor ensure that you're trading with "institutional liquidity" — there is no concrete data supporting such claims. These are tools meant to be used as part of a broader technical analysis strategy.
🛠️ Release Notes
Oct 11, 2022
Fixed array.get error when enabling order blocks
Fixed max_bars_back error when enabling previous highs/lows
Added Order Block Filter with two filtering methods
Added borders to internal order blocks
Minor changes
Oct 24, 2022
Fixed order block alert not triggering
Fixed broken order blocks not being removed
Minor changes
Feb 9, 2023
Added “Label Size” setting
Minor changes
Sept 5, 2024
Improved script performance
Enhanced detection for structures, FVGs, and EQH/EQL
Monochrome style now applies to FVGs and premium/discount zones
Correct styling applied to MTF levels
Minor changes
Sept 10, 2024
Fixed previous high/low errors on low timeframes
Minor changes
🔓 Open-Source Script
In true TradingView spirit, the author of this script ROMERR14 has released it as open source, allowing other traders to review and verify its functionality. It is free to use, but the publication of this script remains subject to TradingView’s internal rules.

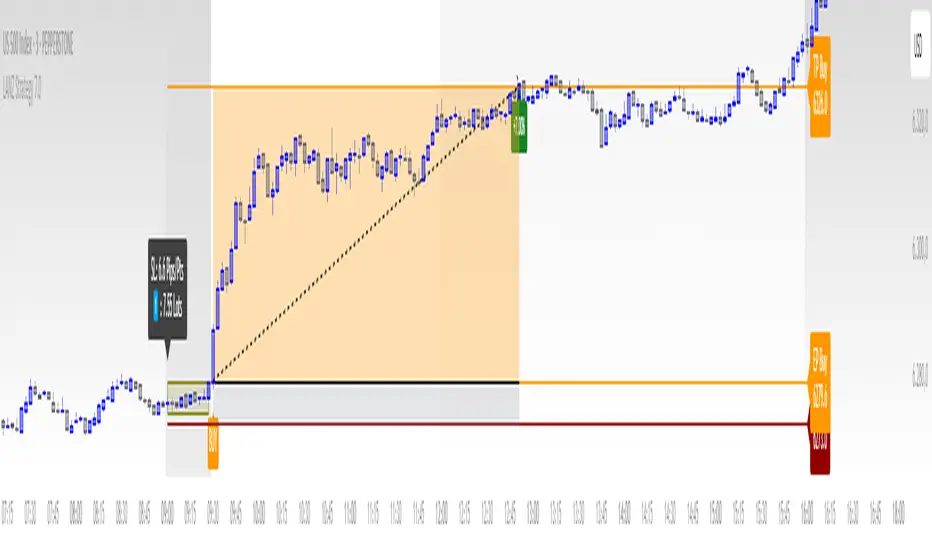
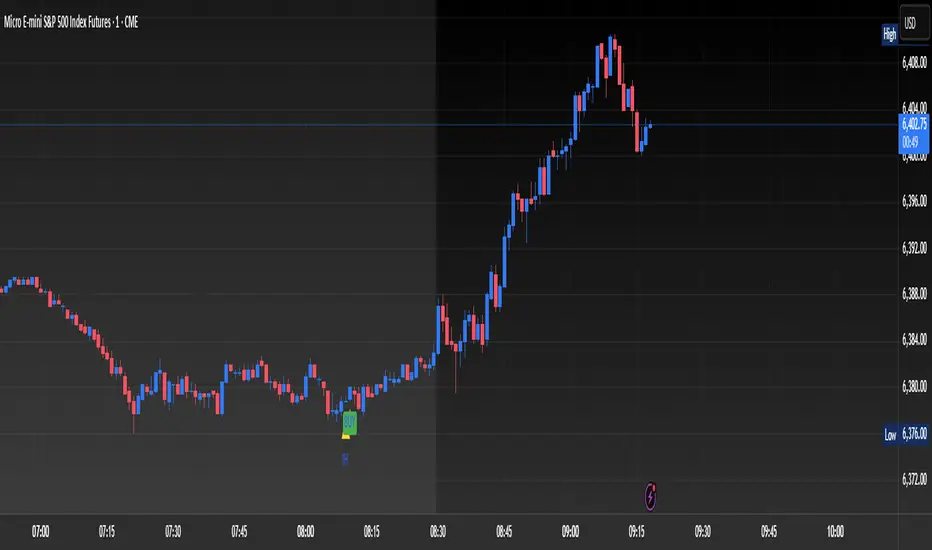
LANZ Strategy 7.0🔷 LANZ Strategy 7.0 — Multi-Session Breakout Logic with Midnight-Cross Support, Dynamic SL/TP, Multi-Account Lot Sizing & Real-Time Visual Tracking
LANZ Strategy 7.0 is a robust, visually-driven trading indicator designed to capture high-probability breakouts from a customizable market session.
It includes full support for sessions that cross midnight, dynamic calculation of Entry Price (EP), Stop Loss (SL) and Take Profit (TP) levels, and a multi-account lot sizing panel for precise risk management.
The system is built to only trigger one trade per day and manages the full trade lifecycle with automated visual cleanup and detailed alerts.
📌 This is an indicator, not a strategy — it does not place trades automatically, but provides exact entry setups, SL/TP levels, risk-based lot size guidance, and real-time alerts for execution.
🧠 Core Logic & Features
🚀 Entry Signal (BUY/SELL)
The trading day begins with a Decision Session (yellow box) where the high/low range is recorded.
Once the Operative Session starts (blue zone), the first touch of the session’s high triggers a BUY setup, and the first touch of the session’s low triggers a SELL setup.
Only one valid trade can be triggered per day — the system locks after the first signal.
⚙️ Dynamic Stop Loss & Take Profit
SL levels are derived from the Decision Session high/low using customizable Fibonacci multipliers (independent for BUY and SELL).
TP is dynamically calculated from the EP–SL distance using a user-defined Risk:Reward ratio (R:R).
All EP, SL, and TP levels are drawn as independent lines with customizable colors, label text size, and style.
⏳ Session & Midnight-Cross Support
Works with any custom Decision/Operative session hours, including sessions that start one day and end the next.
Properly tracks time zones using New York session time for consistency.
Includes Cutoff Time: after this limit, no new entries are allowed, and all visuals are auto-cleared if no trade was triggered.
💰 Multi-Account Risk-Based Lot Sizing
Supports up to 5 independent accounts.
Each account can have:
Own capital
Own risk percentage per trade
Lot size is auto-calculated based on:
SL distance (in pips or points)
Pip value (auto-detected for Forex or manually set for indices/commodities)
Results are displayed in a clean lot size info panel.
🖼️ Real-Time Visual Tracking
Dynamic updates to all levels during the Decision Session.
EP, SL, TP lines update if the session high/low changes before the Operative Session starts.
Trade result labels:
SL hit → “–1.00%” in red
TP hit → “+X.XX%” in green
Manual close at Operative End → shows actual % result in blue or purple.
🔔 Alerts for Every Key Event
Session start notification
EP entry triggered
SL or TP hit
Manual close at session end
Missed entry due to cutoff
🧭 Execution Flow
Decision Session (Yellow) — Capture high/low range.
Operative Session (Blue) — First touch of high = BUY setup; first touch of low = SELL setup.
Plot EP, SL, TP lines + calculate lot sizes for all active accounts.
Track trade until SL, TP, or Operative End.
If no entry triggered by Cutoff Time → clean all visuals and notify.
💡 Ideal For:
Traders who operate breakout logic on specific sessions (NY, London, Asian, or custom).
Those managing multiple accounts with strict risk per trade.
Anyone trading assets with sessions crossing midnight.
👨💻 Credits:
Developer: LANZ
Logic Design: LANZ
Built For: Multi-timeframe session breakouts with high precision.
Purpose: One-shot trade per day, risk consistency, and total visual clarity.
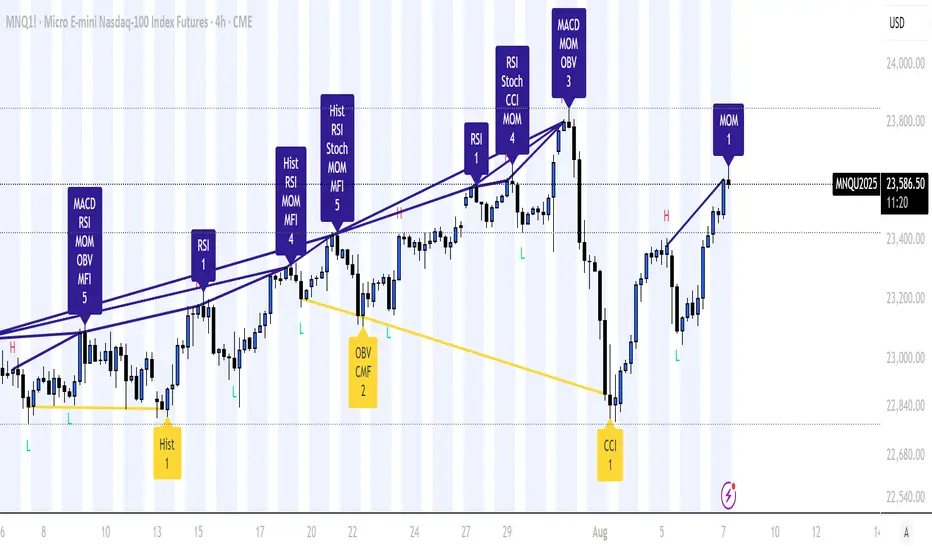
Divergence Mucho Indicators w/ AlertsUsed to signal divergences of well known indicators bearish or bullish. I prefer to create the alert option that shows 4 or more signaling.
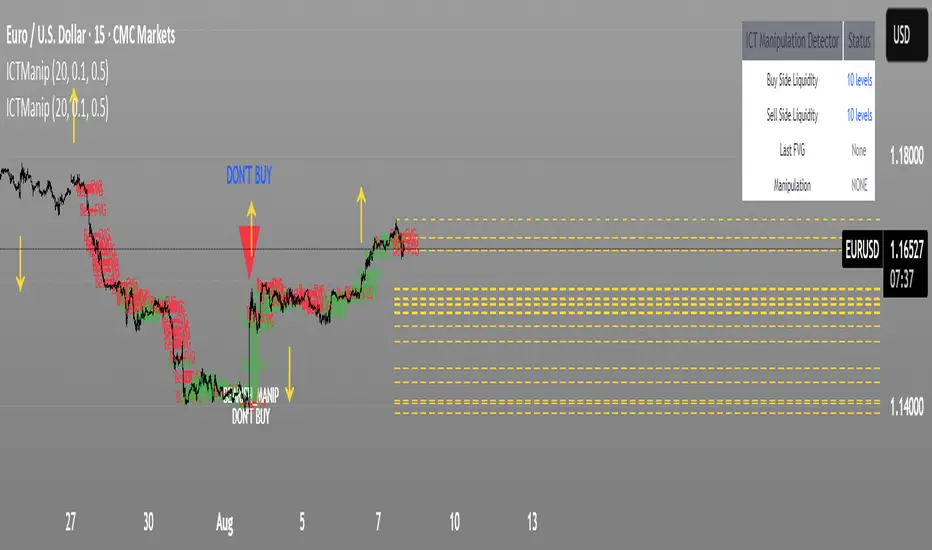
ICT Manipulation DetectorThis indicator detects ICT-style manipulations, liquidity sweeps (stop hunts), and Fair Value Gaps (FVG) automatically on the chart.
🔍 What It Does:
Identifies key highs and lows as liquidity zones.
Detects stop hunts above highs or below lows.
If the price move is large enough, marks it as a manipulation.
Highlights Fair Value Gaps (FVGs) where price might return.
Shows all events visually with boxes, lines, and alerts.
📌 Visuals:
🟩 Green box = Bullish manipulation → “DON’T SELL”
🟥 Red box = Bearish manipulation → “DON’T BUY”
🟨 Yellow dashed lines = Liquidity levels
🔼 / 🔽 Arrows = Sweeps without full manipulation
In short: It automatically detects and warns you of smart money manipulation based on ICT concepts.
ShadowBlocks SMC indicator💼 SMC Indicator – Trade Like Smart Money
The SMC Indicator is a precision-engineered tool built around Smart Money Concepts, revealing how institutional players truly move the markets. Forget retail noise — SMC cuts through the fog to show the real structure, liquidity zones, and key manipulation points that big money uses to trap uninformed traders.
Key Features:
🔹 Market Structure Mapping: Real-time detection of Breaks of Structure (BOS) and Change of Character (CHoCH) for trend identification.
🔹 Liquidity Zones: Highlights internal and external liquidity pools where stop hunts are most likely to occur.
🔹 Order Blocks & Imbalances: Automatic marking of bullish/bearish order blocks, Fair Value Gaps (FVGs), and mitigation zones.
🔹 Premium/Discount Zones: Smart price equilibrium tracking using internal range Fibonacci logic.
🔹 Entry & Exit Clarity: Clearly defined high-probability entry zones, TP/SL levels, and confirmation-based signals.
Whether you're a price action purist or a strategic SMC trader, this indicator brings the invisible hand of institutions into full view — so you can follow smart money, not fight it.
⚠️ Disclaimer:
ShadowBlocks SMC Indicator is an educational and informational tool. It does not provide financial advice. Always do your own research and consult a licensed financial advisor before making trading decisions.

5 EMA No-Touch Breakout 1:3 (Only 5m)This strategy is built for traders who want to ride strong trends using the principle of EMA rejection.
The concept is simple:
📉 Sell when price stays below the 5 EMA without touching it — indicating strong bearish momentum.
📈 Buy when price stays above the 5 EMA without touching it — indicating strong bullish momentum.

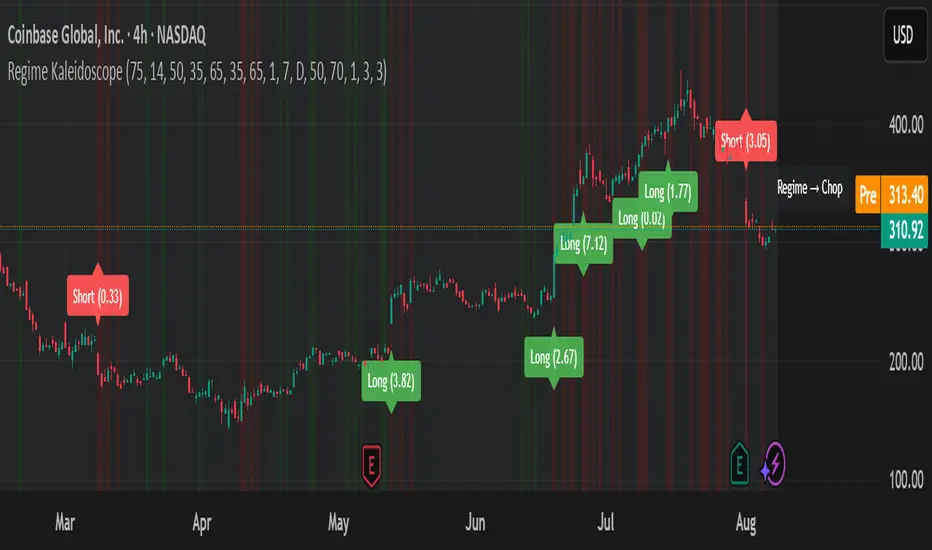
Regime KaleidoscopeWhat is Regime Kaleidoscope?
Regime Kaleidoscope is an advanced market regime visualizer and adaptive signal generator.
It helps traders instantly understand whether current market conditions are best for mean-reversion (fading price back to the mean) or breakout/trend-following (riding strong moves), using a data-driven, non-repainting approach.
How It Works
1. Regime Detection & Background Colors
The indicator analyzes both volatility (ATR) and the shape of each candle (body size vs. range) over a rolling window.
Each bar is classified into one of three regimes, and the chart’s background color changes accordingly:
Regime Background Color What It Means How to Use
Low Vol Balanced Green background Market is calm, compressed. More likely to revert back to mean. Look for mean-reversion signals only (fade moves).
High Vol Directional Red background Market is in a high-volatility, trending, or “breakout” state.
Red does NOT mean bearish. It simply means conditions are ripe for strong directional moves—either up or down. Look for breakout signals only (ride strong moves after structure break).
Chop Gray background Market is indecisive or transitioning between states. Signals are minimized or blocked. Best to wait or trade with extra caution.
→ Red background means high volatility/trending regime, not a signal direction!
Green means “mean-revert environment,” not always bullish!
Gray means “chop/transition”—usually best avoided.
2. Signals — How to Read and Trade Them
Mean-Reversion Signals (Green Regime Only):
Appear when price is stretched away from a rolling mean (SMA) by a configurable ATR-based threshold.
Optional: Only allowed in the direction of the higher-timeframe trend, if enabled.
Long signals: Fade extreme dips (look for triangle-up shapes & green labels).
Short signals: Fade extreme spikes (triangle-down shapes & red labels).
Labels show signal strength (distance from mean in ATR units).
Breakout Signals (Red Regime Only):
Only triggered when price breaks above or below a confirmed swing high or low (pivot), with a strong candle and optional trend confirmation.
Long signals: Breakout above last swing high (regardless of background color).
Short signals: Breakout below last swing low.
Labels show signal strength (distance from pivot in ATR units).
Red background does NOT mean sell— it means “trend environment”—so both long and short signals are possible, depending on which direction price is breaking out.
Signal Controls & Filtering:
Signals only fire at bar close (non-repainting), never intrabar or on future data.
ATR “floor” blocks signals when volatility is too low for meaningful moves.
Cooldown: Signals are limited to one per regime per direction for a minimum number of bars (user input).
Optional confirmation candles: Only strong reversals or breakouts count, reducing noise and whipsaws.
All signals are visible as triangle shapes below/above bars, and labeled with strength.
3. Visual Guide
Background color: Maps the regime, not buy/sell direction.
Transition label: Appears only when the regime changes, so you can see state shifts at a glance.
Triangle shapes & labels: Mark entry points; label gives strength.
Info table (optional): Shows regime and ATR at transitions.
Why is Regime Kaleidoscope Unique?
Uses rolling statistical percentiles of ATR and candle body shape for dynamic market state detection—not just a moving average or volatility band.
Separates regime from signal direction, so you always know “what mode the market is in” and when signals actually have a higher probability.
No repainting. All logic is strictly bar-close, confirmed pivots, and non-future-leaking.
Highly customizable—all thresholds, filters, trend confirmation, and cooldown are user inputs.
How To Use
Add to any chart.
Use the background color to identify if you’re in a mean-revert, breakout, or chop regime.
Take only the signals that match the regime:
Green = fade extremes, Red = ride breakouts, Gray = wait.
Tune settings for your asset and timeframe.
All signals are educational—always test before live use!
Past performance is not necessarily indicative of future results.
Test the indicator on your assets and timeframes. All signals are for educational use only.
BTC/USD Confluence Breakout Pro – IST EditionBTC/USD Confluence Breakout Pro – IST Edition is a multi-factor breakout trading system designed for intraday and swing traders.
It combines trend, momentum, price action, volume, and candlestick analysis with time-based volatility windows to deliver high-probability Buy/Sell signals.
Key Features:
Trend Filters: EMA 9/21 crossover + optional EMA 200 bias filter.
Price Action Breakouts: Detects closes above/below the last N bars’ range.
Candlestick Patterns: Bullish/Bearish engulfing, hammer, and shooting star.
Momentum Indicators: RSI (14) with configurable thresholds, MACD (12/26/9).
Volume Confirmation: Volume spike vs 20-period SMA.
IST Breakout Windows: Highlights Early London, London–US Overlap, and US Open momentum periods (Hyderabad/IST time). Optionally restricts signals to these windows.
Risk Management: ATR-based stop-loss + auto-plotted 1R, 2R, and 3R take-profit levels.
Visual Aids: EMA plots, bar coloring, shaded volatility windows, and clear entry/exit labels.
Alerts: Configurable alerts for both Buy and Sell signals.
Best Use:
Apply on 1m–15m charts for intraday trading or 1H–4H for swings.
Works best during high-volatility IST windows (London–US overlap & US open).
Ideal for BTC/USD but adaptable to other crypto or forex pairs.

Custom Ichimoku Cloud with Signals📊 OVERVIEW
This indicator generates trading signals based on Ichimoku Cloud breakouts and breakdowns. It identifies when price decisively moves through the cloud boundaries, filtering out false signals from consolidation periods.
📈 KEY FEATURES
- Transition-based signals only when price breaks through cloud
- Candle body must completely clear cloud (no touching)
- Alternating signal system prevents consecutive duplicate signals
- Built-in alerts for automated notifications
- Standard Ichimoku components included
⚙️ HOW IT WORKS
BUY SIGNAL: Triggered when candle body moves completely above cloud after being inside/below
SELL SIGNAL: Triggered when candle body moves completely below cloud after being inside/above
🎯 USE CASES
- Trend continuation trading
- Breakout trading strategies
- Cloud support/resistance analysis
- Multi-timeframe analysis
📝 PARAMETERS
- Adjustable Ichimoku periods (Conversion, Base, Lagging Span B)
- Customizable lookback period for transition detection
- Visual signal markers with alerts
⚠️ DISCLAIMER
This indicator is for educational purposes. Past performance doesn't guarantee future results. Always use proper risk management and combine with other analysis methods.
⚠️ DISCLAIMER & RISK WARNING
This indicator is provided for informational and educational purposes only and should not be considered as financial advice.
TRADING RISKS:
- Trading involves substantial risk of loss and is not suitable for all investors
- Past performance is not indicative of future results
- You can lose more than your initial investment
- Never trade with money you cannot afford to lose
NO GUARANTEES:
- This indicator does not guarantee profits or predict market movements with certainty
- Signals are based on mathematical calculations and may produce false signals
- Market conditions can change, making any strategy ineffective
- Success depends on multiple factors beyond this indicator
USER RESPONSIBILITY:
- You are solely responsible for your trading decisions
- Always conduct your own research and analysis
- Consider consulting with a qualified financial advisor
- Use proper risk management and position sizing
- Test thoroughly on demo accounts before live trading
TECHNICAL LIMITATIONS:
- Indicator may be subject to repainting in real-time conditions
- Historical results do not represent actual trading
- Signals are for analysis only, not automatic trade execution
- Performance varies across different timeframes and instruments
By using this indicator, you acknowledge that you understand these risks and accept full responsibility for your trading outcomes. The author assumes no liability for any losses incurred.
NOT FINANCIAL ADVICE - FOR EDUCATIONAL PURPOSES ONLY

Inverted Hammer w/ Buy Signal This indicator will identify inverted hammer candles in a downtrend and also provide a buy signal when the following candle closes above the top wick of the previous inverted hammer candle.
🔍 Confirmed Scalping Signals (Stoch+EMA+Supertrend)🔍 Confirmed Scalping Signals (Stoch+EMA+Supertrend)
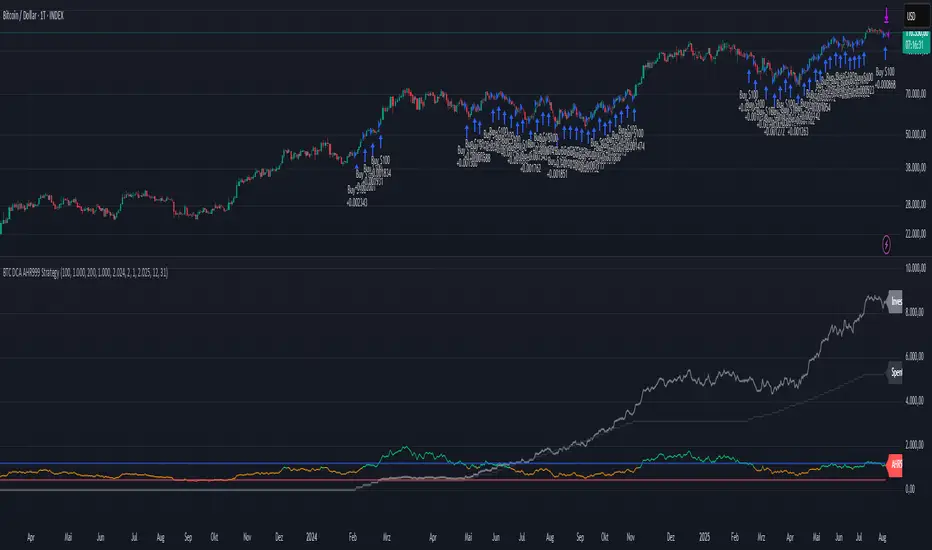
BTC DCA AHR999 Strategy
This is an easy to understand and perform DCA strategy, based on the AHR999 indicator.
The initial strategy is based on the AHR999 indicator script from discountry, that is with this script transformed into a TV strategy:
The logic is pretty simple:
we do a DCA buy every week (in the code it is set on monday)
we do a small DCA buy, as long as AHR999 < 1.2 (signaling moderate BTC price)
we do a big DCA buy, as long as AHR < 0.45 (signaling undervalued BTC price)
we skip buys, as long as AHR > 1.2 (signaling overvalued BTC price)
Values for "small DCA buy" and "big DCA buy" can be adjusted, aswell as timeframe, we want the backtest for and a scale factor, to show the AHR999 indicator in the plot, aswell as the spent capital and the net worth of the accumulated BTC.
The scale factor of the plot can be varied, depending on the timeframe and input capital you are using (recommendation is to use a scale factor to be able to see the AHR999 indicator itself on the chart in a meaningful way).
MomentumSync-PSAR: RSI·ADX Filtered 3-Tier Exit StrategyTriSAR-E3 is a precision swing trading strategy designed to capitalize on early trend reversals using a Triple Confirmation Model. It triggers entries based on an early Parabolic SAR bullish flip, supported by RSI strength and ADX trend confirmation, ensuring momentum-backed participation.
Exits are tactically managed through a 3-step staged exit after a PSAR bearish reversal is detected, allowing gradual profit booking and downside protection.
This balanced approach captures trend moves early while intelligently scaling out, making it suitable for directional traders seeking both agility and control.

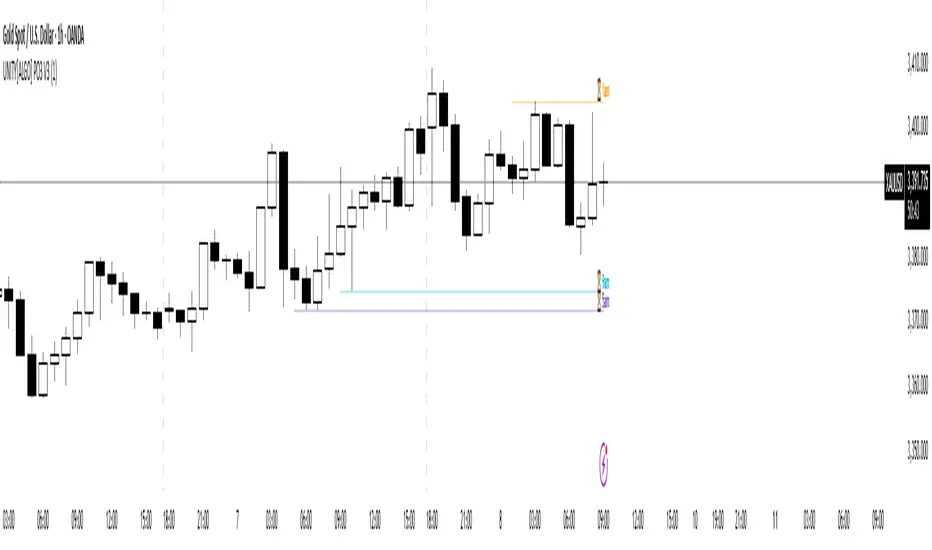
UNITY[ALGO] PO3 V3Of course. Here is a complete and professional description in English for the indicator we have built, detailing all of its features and functionalities.
Indicator: UNITY PO3 V7.2
Overview
The UNITY PO3 is an advanced, multi-faceted technical analysis tool designed to identify high-probability reversal setups based on the Swing Failure Pattern (SFP). It combines real-time SFP detection on the current timeframe with a sophisticated analysis of key institutional liquidity zones from the H4 timeframe, presenting all information in a clear, dynamic, and interactive visual interface.
This indicator is built for traders who use liquidity concepts, providing a complete dashboard of entries, targets, and invalidation levels directly on the chart.
Core Features & Functionality
1. Swing Failure Pattern (SFP) Detection (Current Timeframe)
The indicator's primary engine identifies SFPs on the chart's active timeframe with two layers of logic:
Standard SFP: Detects a classic liquidity sweep where the current candle's wick takes out the high or low of the previous candle and the body closes back within the previous candle's range.
Outside Bar SFP Logic: Intelligently analyzes engulfing candles that sweep both the high and low of the previous candle. A valid signal is only generated if the candle has a clear directional close:
Bullish Signal: If the outside bar closes higher than its open.
Bearish Signal: If the outside bar closes lower than its open.
Neutral (doji-like) outside bars are ignored to filter for indecision.
2. Comprehensive On-Chart SFP Markings
When a valid SFP is detected, a full suite of dynamic drawings appears on the chart:
Failure Line: A dashed line (red for bearish, green for bullish) marking the precise price level of the liquidity sweep.
PREMIUM ZONE (SFP Candle Wick): A transparent, colored rectangle highlighting the rejection wick of the signal candle (the upper wick for bearish SFPs, the lower wick for bullish SFPs). This zone automatically extends to the right, following the current price, until the DOL is hit.
CRT BOX (Reference Candle): A transparent box with a colored border drawn around the entire range of the candle that was swept (Candle 1). This highlights the full liquidity zone and also extends dynamically until the DOL is hit.
Dynamic Target Line: A blue dashed line marking the primary objective (the low of the signal candle for shorts, the high for longs).
The line begins with a "⏳ Target" label and extends with the current price.
Upon being touched by price, the line freezes, and its label permanently changes to "✅ Target".
Dynamic DOL (Draw on Liquidity) Line: An orange dashed line marking the invalidation level, defined as the opposite extremity of the swept candle (Candle 1).
It begins with a "⏳ dol" label and extends with the price.
Upon being touched, it freezes, and its label changes to "✅ dol".
3. Multi-Session Killzone Liquidity Levels (H4 Analysis)
The indicator automatically analyzes the H4 timeframe in the background to identify and plot key liquidity levels from three major trading sessions, based on their UTC opening times.
1am Killzone (London Lunch): Tracks the high/low of the 05:00 UTC H4 candle.
5am Killzone (London Open): Tracks the high/low of the 09:00 UTC H4 candle.
9am Killzone (NY Open): Tracks the high/low of the 13:00 UTC H4 candle.
For each of these Killzones, the indicator provides two types of analysis:
Last KZ Lines: Plots the high and low of the most recent qualifying Killzone candle. These lines are dynamic, extending with price and showing a ⏳/✅ status when touched.
Fresh Zones: A powerful feature that scans the entire available history of Killzones to find and display the closest untouched high (above the current price) and the closest untouched low (below the current price). These "Fresh" lines are also fully dynamic and provide a real-time view of the most relevant nearby liquidity targets.
4. Advanced User Settings & Chart Management
The indicator is designed for a clean and user-centric experience with powerful customization:
Show Only Last SFP: Keeps the chart clean by automatically deleting the previous SFP setup when a new one appears.
Hide SFP on DOL Reset: When checked, automatically removes all drawings related to an SFP setup the moment its invalidation level (DOL line) is touched. This leaves only active, valid setups on the chart.
Hide Consumed KZ: When checked, automatically removes any Killzone or Fresh Zone line from the chart as soon as it is touched by the price.
Independent Toggles: Every visual element—SFP signals, each of the three Killzones, and their respective "Fresh" zone counterparts—can be turned on or off independently from the settings menu for complete control over the visual display.
Z-Order Priority: All indicator drawings are rendered in front of the chart candles, ensuring they are always clearly visible and never hidden from view.
ORB 15m – First 15min Breakout (Long/Short)ORB 15m – First 15min Breakout (Long/Short)
Apply on SPY, great returns

Divergence Mucho Indicators v6 AlertsShows divergence for well known indicators. Allows option to create alert for 4 or more divergences signaling.
SMC de SmartProfit [ROMERR14]This all-in-one indicator displays real-time market structure (internal & swing BOS / CHoCH), order blocks, premium & discount zones, equal highs & lows, and much more...allowing traders to automatically mark up their charts with widely used price action methodologies. Following the release of our Fair Value Gap script, we received numerous requests from our community to release more features in the same category.
"Smart Money Concepts" (SMC) is a fairly new yet widely used term amongst price action traders looking to more accurately navigate liquidity & find more optimal points of interest in the market. Trying to determine where institutional market participants have orders placed (buy or sell side liquidity) can be a very reasonable approach to finding more practical entries & exits based on price action.
The indicator includes alerts for the presence of swing structures and many other relevant conditions.
Features
This indicator includes many features relevant to SMC, these are highlighted below:
Full internal & swing market structure labeling in real-time
Break of Structure (BOS)
Change of Character (CHoCH)
Order Blocks (bullish & bearish)
Equal Highs & Lows
Fair Value Gap Detection
Previous Highs & Lows
Premium & Discount Zones as a range
Options to style the indicator to more easily display these concepts
Settings
Mode: Allows the user to select Historical (default) or Present, which displays only recent data on the chart.
Style: Allows the user to select different styling for the entire indicator between Colored (default) and Monochrome.
Color Candles: Plots candles based on the internal & swing structures from within the indicator on the chart.
Internal Structure: Displays the internal structure labels & dashed lines to represent them. (BOS & CHoCH).
Confluence Filter: Filter non-significant internal structure breakouts.
Swing Structure: Displays the swing structure labels & solid lines on the chart (larger BOS & CHoCH labels).
Swing Points: Displays swing points labels on chart such as HH, HL, LH, LL.
Internal Order Blocks: Enables Internal Order Blocks & allows the user to select how many most recent Internal Order Blocks appear on the chart.
Swing Order Blocks: Enables Swing Order Blocks & allows the user to select how many most recent Swing Order Blocks appear on the chart.
Equal Highs & Lows: Displays EQH/EQL labels on chart for detecting equal highs & lows.
Bars Confirmation: Allows the user to select how many bars are needed to confirm an EQH/EQL symbol on chart.
Fair Value Gaps: Displays boxes to highlight imbalance areas on the chart.
Auto Threshold: Filter out non-significant fair value gaps.
Timeframe: Allows the user to select the timeframe for the Fair Value Gap detection.
Extend FVG: Allows the user to choose how many bars to extend the Fair Value Gap boxes on the chart.
Highs & Lows MTF: Allows the user to display previous highs & lows from daily, weekly, & monthly timeframes as significant levels.
Premium/Discount Zones: Allows the user to display Premium, Discount, and Equilibrium zones on the chart
Usage
imagen
Users can see automatic CHoCH and BOS labels to highlight breakouts of market structure, which allows to determine the market trend. In the chart below we can see the internal structure which displays more frequent labels within larger structures. We can also see equal highs & lows (EQH/EQL) labels plotted alongside the internal structure to frequently give indications of potential reversals.
imagen
In the chart below we can see the swing market structure labels. These are also labeled as BOS and CHoCH but with a solid line & larger text to show larger market structure breakouts & trend reversals. Users can be mindful of these larger structure labels while trading internal structures as displayed in the previous chart.
imagen
Order blocks highlight areas where institutional market participants open positions, one can use order blocks to determine confirmation entries or potential targets as we can expect there is a large amount of liquidity at these order blocks. In the chart below we can see 2 potential trade setups with confirmation entries. The path outlined in red would be a potential short entry targeting the blue order block below, and the path outlined in green would be a potential long entry, targeting the red order blocks above.
imagen
As we can see in the chart below, the bullish confirmation entry played out in this scenario with the green path outlined in hindsight. As price breaks though the order blocks above, the indicator will consider them mitigated causing them to disappear, and as per the logic of these order blocks they will always display 5 (by default) on the chart so we can now see more actionable levels.
imagen
The Smart Money Concepts indicator has many other features and here we can see how they can also help a user find potential levels for price action trading. In the screenshot below we can see a trade setup using the Previous Monthly High, Strong High, and a Swing Order Block as a stop loss. Accompanied by the Premium from the Discount/Premium zones feature being used as a potential entry. A potential take profit level for this trade setup that a user could easily identify would be the 50% mark labeled with the Fair Value Gap & the Equilibrium all displayed automatically by the indicator.
imagen
Conclusion
This indicator highlights all relevant components of Smart Money Concepts which can be a very useful interpretation of market structure, liquidity, & more simply put, price action. The term was coined & popularized primarily within the forex community & by ICT while making its way to become a part of many traders' analysis. These concepts, with or without this indicator do not guarantee a trader to be trading within the presence of institutional or "bank-level" liquidity, there is no supporting data regarding the validity of these teachings.
11 oct 2022
Notas de prensa
- Fixed array.get errors when enabling Order Blocks
- Fixed max_bars_back error when enabling Previous Highs/Lows
- Added Order Block Filter setting with 2 methods allowing users to filter out volatile Order Blocks.
- Added borders to Internal Order Blocks
- Minor changes
24 oct 2022
Notas de prensa
- Fixed order block alert not alerting on break
- Fixed order block not being deleted when broken
- Minor changes
9 feb 2023
Notas de prensa
- Added "Label Size" setting to increase size on internal market structure, swing market structure, and EQH/EQL labels.
- Minor changes
5 sept 2024
Notas de prensa
- Improved script performance
- Enhanced detection capabilities for structures, order blocks, fair value gaps, and equal highs and lows
- Monochrome style can be applied to fair value gaps and premium/discount zones.
- The correct style has now been applied to the MTF highs and lows levels
- Minor changes
10 sept 2024
Notas de prensa
- Fixed previous high/low causing errors on low timeframes
- Minor changes
Script de código abierto
Siguiendo fielmente el espíritu de TradingView, el creador de este script lo ha publicado en código abierto, permitiendo que otros traders puedan revisar y verificar su funcionalidad. ¡Enhorabuena al autor! Puede utilizarlo de forma gratuita, pero tenga en cuenta que la publicación de este código está sujeta a nuestras Normas internas.
LuxAlgo
Siguiendo
Get access to our exclusive tools: luxalgo.com
Join our 150k+ community: discord.gg/lux
All content provided by LuxAlgo is for informational & educational purposes only. Past performance does not guarantee future results.
También en:
Exención de responsabilidad
La información y las publicaciones que ofrecemos, no implican ni constituyen un asesoramiento financiero, ni de inversión, trading o cualquier otro tipo de consejo o recomendación emitida o respaldada por TradingView. Puede obtener información adicional en las Condiciones de uso.

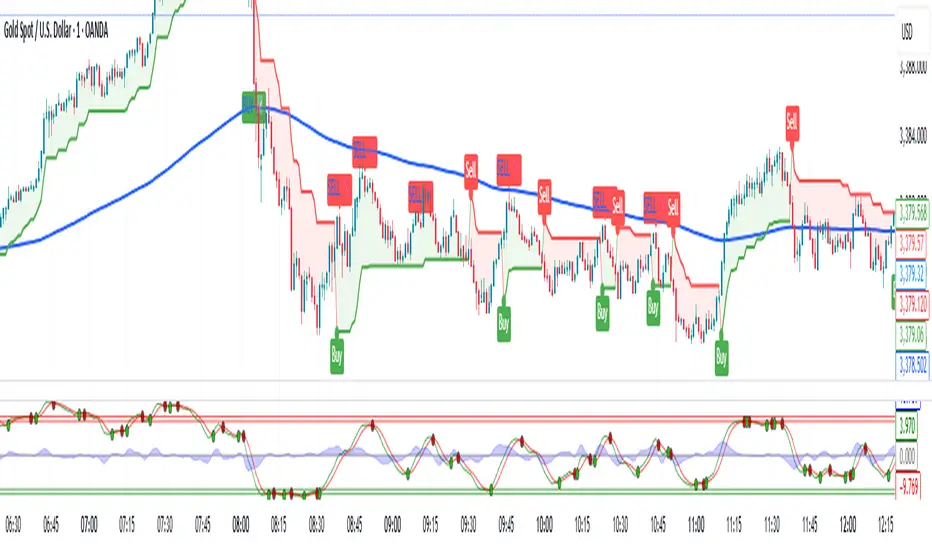
Crypto Trend Master Pro + Hull Trend (MARK804 Enhanced)Strategy Overview: Crypto Trend Master Pro + Hull Signals
Strategy Essence
This script merges multi-dimensional trend analysis by blending EMA-ATR trend filters with the precision of Hull Moving Averages. Focused solely on arrow-based trade signals, it delivers clean, high-conviction entries via fortified dual confirmation logic—all while maintaining a minimalist aesthetic for traders who prize clarity.
Key Components & Design Philosophy
Dual Confirmation Structure
Only triggers a BUY arrow when both the EMA-ATR slope indicates bullishness and the Hull MA confirms upward momentum. Similarly, a SELL arrow appears only when both bearish signals align—filtering noise and reinforcing signal conviction.
Hull MA Variant Flexibility
Traders can toggle between HMA, EHMA, or THMA versions of the Hull MA, calibrating the balance between responsiveness and smoothing based on preference and timeframe.
Minimalist Visual Interface
Discrete arrow shapes—green for BUY, red for SELL—appear directly on the chart, delivering precise signal points with no extraneous labeling or clutter.
Alert-Ready for Seamless Automation
Each signal format (BUY/SELL) is natively benchmarked with alertcondition, enabling seamless integration into automated workflows or notification systems.
Clean Code Architecture
Structured around strong boolean logic (longSignal, shortSignal), the script remains efficient, readable, and straightforward to adapt or integrate into broader systems.
Pro-Level Considerations
Feature Advantage for Professional Traders
Dual Confirmation Boosts reliability by aligning trend filters
Hull Variant Options Tailors sensitivity to different market volatilities
Arrow-Only UI Keeps chart focused and minimizes visual distraction
Alert Compatibility Straightforward integration with alert/automation tools
Modular Design Supports expansion—add stop-loss, multi-timeframe logic
Community-Level Insight
As one seasoned user put it:
“If you're a pro, you know where repaint comes in and how to avoid it. You understand slippage and test on demo accounts regularly.”

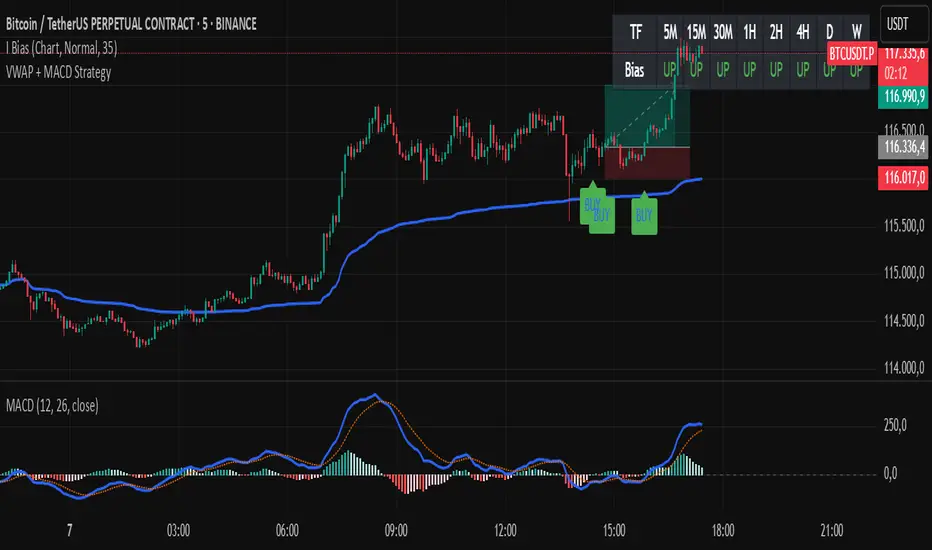
VWAP + MACD Estrategia MilloVWAP + MACD Strategy
This indicator combines the VWAP (Volume Weighted Average Price) with MACD (Moving Average Convergence Divergence) to create buy and sell signals. It helps traders identify potential market entry and exit points based on price action and momentum.
Conditions for Buy:
The price must be above the VWAP.
The MACD line crosses above the signal line (bullish crossover).
The MACD line is below the zero line.
Conditions for Sell:
The price must be below the VWAP.
The MACD line crosses below the signal line (bearish crossover).
The MACD line is above the zero line.
Features:
The VWAP line is plotted to represent the average price, weighted by volume, over a specified period.
Buy signals appear when all conditions are met for an upward price movement.
Sell signals appear when all conditions are met for a downward price movement.
MACD and Signal Line: The MACD helps to confirm momentum, while the signal line indicates possible trend reversals.
Customizable: You can modify the VWAP and MACD parameters to suit different trading strategies.
This strategy is designed for intraday traders and scalpers, aiming to catch quick movements while being aware of market momentum.
Feel free to share this description along with the code! Let me know if you need any adjustments or further explanations.
Time Window Optimizer [theUltimator5]The Time Window Optimizer is designed to identify the most profitable 30-minute trading windows during regular market hours (9:30 AM - 4:00 PM EST). This tool helps traders optimize their intraday strategies by automatically discovering time periods with the highest historical performance or allowing manual selection for custom analysis. It also allows you to select manual timeframes for custom time period analysis.
🏆 Automatic Window Discovery
The core feature of this indicator is its intelligent Auto-Find Best 30min Window system that analyzes all 13 possible 30-minute time slots during market hours.
How the Algorithm Works:
Concurrent Analysis: The indicator simultaneously tracks performance across all 13 time windows (9:30-10:00, 10:00-10:30, 10:30-11:00... through 15:30-16:00)
Daily Performance Tracking: For each window, it captures the percentage change from window open to window close on every trading day
Cumulative Compounding: Daily returns are compounded over time to show the true long-term performance of each window, starting from a normalized value of 1.0
Dynamic Optimization: The system continuously identifies the window with the highest cumulative return and highlights it as the optimal choice
Statistical Validation: Performance is validated through multiple metrics including average daily returns, win rates, and total sample size
Visual Representation:
Best Window Line: The top-performing window is displayed as a thick colored line for easy identification
All 13 Lines (optional): Users can view performance lines for all time windows simultaneously to compare relative performance
Smart Coloring: Lines are color-coded (green for gains, red for losses) with the best performer highlighted in a user-selected color
📊 Comprehensive Performance Analysis
The indicator provides detailed statistics in an information table:
Average Daily Return: Mean percentage change per trading session
Cumulative Return: Total compounded performance over the analysis period
Win Rate: Percentage of profitable days (colored green if ≥50%, red if <50%)
Buy & Hold Comparison: Shows outperformance vs. simple buy-and-hold strategy
Sample Size: Number of trading days analyzed for statistical significance
🛠️ User Settings
imgur.com
Auto-Optimization Controls:
Auto-Find Best Window: Toggle to enable/disable automatic optimization
Show All 13 Lines: Display all time window performance lines simultaneously
Best Window Line Color: Customize the color of the top-performing window
Manual Mode:
imgur.com
Custom Time Window: Set any desired time range using session format (HHMM-HHMM)
Crypto Support: Built-in timezone offset adjustment for cryptocurrency markets
Chart Type Options: Switch between candlestick and line chart visualization
Visual Customization:
imgur.com
Background Highlighting: Optional background color during active time windows
Candle Coloring: Custom colors for bullish/bearish candles within the time window
Table Positioning: Flexible placement of the statistics table anywhere on the chart
🔧 Technical Features
Market Compatibility:
Stock Markets: Optimized for traditional market hours (9:30 AM - 4:00 PM EST)
Cryptocurrency: Includes timezone offset adjustment for 24/7 crypto markets
Exchange Detection: Automatically detects crypto exchanges and applies appropriate settings
Performance Optimization:
Efficient Calculation: Uses separate arrays for each time block to minimize computational overhead
Real-time Updates: Dynamically updates the best-performing window as new data becomes available
Memory Management: Optimized data structures to handle large datasets efficiently
💡 Use Cases
Strategy Development: Identify the most profitable trading hours for your specific instruments
Risk Management: Focus trading activity during historically successful time periods
Performance Comparison: Evaluate whether time-specific strategies outperform buy-and-hold
Market Analysis: Understand intraday patterns and market behavior across different time windows
📈 Key Benefits
Data-Driven Decisions: Base trading schedules on historical performance data
Automated Analysis: No manual calculation required - the algorithm does the work
Flexible Implementation: Works in both automated discovery and manual selection modes
Comprehensive Metrics: Multiple performance indicators for thorough analysis
Visual Clarity: Clear, color-coded visualization makes interpretation intuitive
This indicator transforms complex intraday analysis into actionable insights, helping traders optimize their time allocation and improve overall trading performance through systematic, data-driven approach to market timing.


anand ha + RsiHow it works:
Green Line: When RSI > 50 AND Heikin Ashi is bullish (uptrend)
Red Line: When RSI < 50 AND Heikin Ashi is bearish (downtrend)
The line dynamically positions itself below price during uptrends and above price during downtrends
Uses ATR to maintain appropriate distance from price action
Includes subtle background fill between price and the trend line
Key Features:
Single clean trend line (no candles, no extra indicators)
Color changes based on trend direction
Self-adjusting position using ATR
Smooth transitions to avoid whipsaws
Minimal visual clutter, just like SuperTrend
The line will stay green below price when both RSI is above 50 and Heikin Ashi shows bullish momentum, and red above price when both conditions turn bearish. This gives you a clear visual trend following system in a simple line format.
