Trend Magic Real-Time Cross for TradersPostTrend Magic Real-Time Cross for TradersPost. IIIIIIIIIIIIIIIIIIIIIIIIIIIIIIIIIIIIIIIIIIIIIIIIIIIIIIIIIIIIIIIIIIIIIIIIII
Chart patterns

Kalman VWMA For LoopKalman VWMA For Loop Indicator
The Kalman VWMA For Loop indicator is a sophisticated tool designed to smooth price data using a Kalman filter applied to a Volume Weighted Moving Average (VWMA). By combining the VWMA’s volume-weighted price sensitivity with the adaptive noise reduction of a Kalman filter, this indicator provides traders with a robust momentum and trend-following signal. The indicator includes a customizable for-loop mechanism to potentially iterate over a range of calculations or parameters, enhancing flexibility for advanced trading strategies. Visual outputs are plotted to help traders identify trends and potential trading opportunities with reduced noise.
How It Works
VWMA Calculations
Volume Weighted Moving Average (VWMA): Computes a VWMA based on a user-selected price source (default: Close) over a configurable period (default: 14). The VWMA weights price data by trading volume, providing a more accurate representation of market activity compared to a simple moving average.
Kalman Filter Calculation
Kalman Filter: Applies a Kalman filter to the price source to smooth price movements and reduce noise.
The filter uses:
Process Noise: Controls the adaptability of the filter to price changes (default: 0.01).
Measurement Noise: Adjusts sensitivity to price fluctuations (default: 3).
Filter Order (N): Defines the number of states in the Kalman filter (default: 3), allowing for multi-state modeling of price dynamics.
The Kalman filter iteratively predicts and updates the price estimate using state estimates and error covariances stored in arrays. This process minimizes noise while preserving significant price trends.
For-Loop Mechanism
The script includes a for-loop structure with user-defined parameters (from and to_, defaulting to 1 and 25, respectively). While the provided code does not fully implement the for-loop’s functionality, it is intended to allow iterative calculations or parameter sweeps, such as testing multiple periods or thresholds within the specified range. This feature enhances the indicator’s flexibility for optimization or multi-scenario analysis.
Visual Representations
The indicator plots the VWMA as a red line on the chart, providing a clear visual reference for the volume-weighted trend.
The Kalman-filtered price is calculated but not plotted in the provided code. When plotted, it would appear as a smoothed price line, highlighting the underlying trend with reduced noise.
The for-loop parameters suggest potential for additional visual outputs (e.g., multiple VWMA lines or signals) if fully implemented, but the current script only plots the VWMA.
Customization & Parameters
The Kalman VWMA For Loop indicator offers flexible parameters to suit various trading styles:
Moving Average Parameters:
Price Source: Select the input price (default: Close; options: Close, High, Low, Open).
MA Period: Adjust the VWMA calculation period (default: 14).
Kalman Parameters:
Process Noise: Adjusts the filter’s adaptability to price changes (default: 0.01).
Measurement Noise: Controls sensitivity to price fluctuations (default: 3).
Filter Order (N): Sets the number of states for the Kalman filter (default: 3).
For-Loop Parameters:
From: Starting value for the for-loop (default: 1).
To: Ending value for the for-loop (default: 25).
Color Settings: The VWMA is plotted in red, with potential for additional customizable colors if the for-loop is expanded to plot multiple outputs.
Trading Applications
This indicator is versatile and can be applied across various markets and strategies:
Trend Following:
Use the Kalman-filtered price and VWMA to identify the direction and strength of trends, with the smoothed output reducing false signals in volatile markets.
Momentum Trading: The VWMA highlights volume-driven price movements, allowing traders to enter or exit based on momentum shifts.
Parameter Optimization: The for-loop structure (if fully implemented) enables testing multiple VWMA periods or Kalman parameters, aiding in strategy optimization.
Scalping and Swing Trading: Adjust the MA period and Kalman parameters to suit short-term (scalping) or longer-term (swing trading) strategies.
Final Note
The Kalman VWMA For Loop indicator is a powerful tool for traders seeking to combine volume-weighted price analysis with advanced noise reduction via a Kalman filter. Its customizable parameters and potential for iterative calculations through the for-loop make it adaptable to various trading styles. While the for-loop functionality is not fully implemented in the provided code, completing it could enable dynamic parameter testing or signal generation. As with all indicators, backtest thoroughly and integrate into a comprehensive trading strategy for optimal results.

CE XAU/USDT Strategy📌 Auto-Trading Strategy Using CE on XAU/USDT (5M)
Indicator: CE
Parameters:
• ATR Period: 1
• ATR Multiplier: 1.85
Timeframe: 5 minutes
Instrument: Gold (XAU/USD)
🔁 Logic:
• Buy signal → Close short, open long
• Sell signal → Close long, open short
⚙️ Automation:
1. CE indicator on TradingView generates signals
2. Signals are sent via webhook to a Python bot
3. The bot opens/closes trades in MT5 accordingly
✅ Advantages:
• Full automation
• Operates 24/7 without manual intervention
⚠️ Important:
• Always test on a demo account
• Manage risk and position size properly
📌 Стратегия автоторговли по CE на XAU/USDT (5М)
Индикатор: CE
Параметры:
• ATR Period: 1
• ATR Множитель: 1.85
Таймфрейм: 5 минут
Инструмент: Золото (XAU/USD)
🔁 Логика:
• Buy сигнал → закрыть шорт, открыть лонг
• Sell сигнал → закрыть лонг, открыть шорт
⚙️ Автоматизация:
1. CE в TradingView генерирует сигналы
2. Webhook отправляет их в Python-бот
3. Бот открывает/закрывает сделки в MT5
✅ Плюсы:
• Полная автоматизация
• Работа 24/7 без вмешательства
⚠️ Важно:
• Тестируй на демо
• Управляй рисками и лотами

Volume vs Volatility Trend Signal1 is increasing volume decreasing volatility -1 is decreasing volume increasing volatility 0 is neither

Scalping Indicator v6This Script Show You Recent Scalping Trades u can get instantly we have use the knowledge we gain across the time we might be right or wrong do your own research and use this indicator on ur own risk

Corys Buy and SellThe Cory’s Buy and Sell indicator is an advanced, all-in-one trading toolkit that combines dynamic trend detection, volatility breakout alerts, and visual EMA strength to help traders confidently identify high-probability buy and sell opportunities.
🔍 Key Features:
Adaptive Supertrend Engine
Powered by a modified Keltner Channel, this trend-following algorithm generates timely BUY 🚀 and SELL 😡 signals based on market momentum and volatility, with adjustable sensitivity and factor settings for full control.
EMA Energy Bands (Optional)
A cascade of 15 EMAs (from 9 to 51 periods) visually maps market energy. Colours shift from green (bullish) to red (bearish), showing short- to medium-term trend strength at a glance.
Trend Catcher Overlay
Highlights major shifts in trend using a fast/slow EMA crossover (10 vs 20 EMA). Bars are coloured to reflect bullish reversals for added confidence.
Pullback Signal Detection
Identifies bullish pullback opportunities when price reclaims key EMA levels after a crossover, marked with a green triangle for entry timing.
Built-in Range Detection System
Automatically highlights price consolidation zones using ATR-based logic. When price breaks above or below the detected range, the zone changes colour (green for breakout up, red for breakdown), helping traders spot breakout opportunities.
Smart Labels & Alerts
Instant BUY/SELL labels on the chart and built-in alert conditions make this indicator suitable for both discretionary and automated trading strategies.
⚙️ Customisable Inputs:
Sensitivity (for trend signals)
EMA Energy toggle
Keltner & ATR Lengths
Range Detection parameters and styling
Best For: Trend traders, breakout traders, and swing traders looking for a clean, powerful overlay that combines momentum, structure, and volatility in one tool.

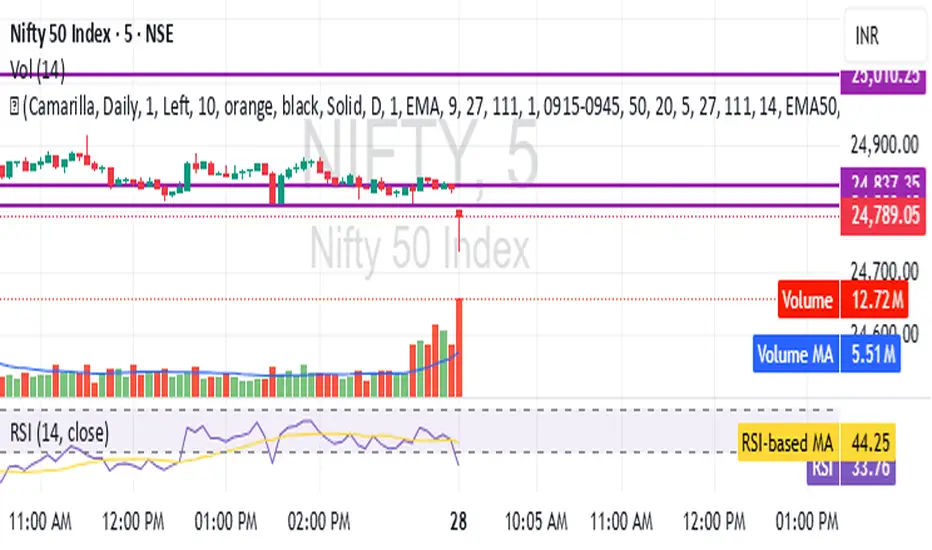
PHL Sweep Signals(1 Hour)PHL Sweep Signals (Full History)
This indicator is designed to identify high-probability reversal setups by detecting liquidity sweeps of the previous standard hour's high and low (PHL). It provides clear, actionable signals complete with visual aids and a data table to keep you in tune with the higher-timeframe context.
Key Features
Previous Hour Levels: Automatically draws the high and low of the previous standard hour as key reference lines for the current trading hour. The line colors rotate to provide a clear visual separation.
Bearish Sweep Signal: Identifies a specific bearish pattern: a green (bullish) candle that wicks above the previous hour's high but fails to hold, with its body remaining entirely below the line.
Bullish Sweep Signal: Identifies the opposite bullish pattern: a red (bearish) candle that wicks below the previous hour's low but is absorbed, with its body remaining entirely above the line.
Clear Visual Signals: When a signal is confirmed, the indicator provides a multi-faceted alert:
Plots a "Buy" or "Sell" arrow on the chart.
Draws a colored box around the signal candle for easy identification.
Displays a label with the potential Stop Loss size (calculated from the size of the signal candle).
Informative Display Table: Includes a convenient table in the corner showing the Open and Close data for the last 3 hours, helping you stay aware of the broader market context without leaving your chart.
Built-in Alerts: Triggers an alert for every confirmed Buy and Sell signal so you never miss a potential setup.
How to Use
This indicator helps you spot potential exhaustion and reversals at key hourly levels.
A "Sell" signal suggests a failed breakout to the upside, indicating potential weakness and a possible entry for shorts.
A "Buy" signal suggests a failed breakdown to the downside, indicating potential strength and a possible entry for longs.
As with any tool, these signals are most powerful when used as part of a comprehensive trading strategy and combined with your own analysis for confirmation.
Optimal Settings:
Timeframe: 5-Minute
Time Zone: UTC-4 (New York Time)
-ratheeshinv

NY/LDN/TOK Stock Exchange Opening HoursThis indicator displays vertical dotted lines marking the exact opening times of the three major global stock exchanges: New York (NYSE), London (LSE), and Tokyo (TSE). Perfect for traders who need to track market opening sessions across different time zones.
Features:
New York Stock Exchange (NYSE): 9:30 AM EST/EDT
London Stock Exchange (LSE): 8:00 AM GMT/BST
Tokyo Stock Exchange (TSE): 9:00 AM JST
Key Highlights:
✓ Automatic daylight saving time adjustments for NY and London
✓ Individual color customization for each market
✓ Toggle on/off functionality for each exchange
✓ Clean vertical dotted lines (1-pixel width) that extend across the entire chart
✓ Interactive legend in bottom-right corner showing active markets
✓ Weekdays only (Monday-Friday) - no weekend lines
✓ Uses official local time zones for accurate timing
Customizable Settings:
Enable/disable individual exchanges
Custom color selection for each market line
Dynamic legend that shows only enabled markets
Time Zone Handling:
The indicator automatically handles daylight saving time transitions using official time zones:
America/New_York (EST/EDT)
Europe/London (GMT/BST)
Asia/Tokyo (JST - no DST)
Perfect for:
Multi-market traders
Session overlap analysis
Global market timing coordination
Institutional trading schedules
Simply add to your chart and customize colors/visibility in the indicator settings. The legend will automatically update to show your active markets in their respective colors.

Supertrend Strategy (5m)📊 Strategy: Buy/Sell Based on EMA Crossover (5-Minute Timeframe)
📊 Стратегия: Buy/Sell по пересечению EMA (5 минут)

FVG + IFVG Gap (ULTRA) by Aditya NejeThis Indicator shows Fair Value Gap and Inverse Fair Value gaps

Fibonacci Range Detector ║ BullVision🔬 Overview
The Fibonacci Range Mapper is a dynamic technical tool designed to identify, track, and visualize price ranges using Fibonacci levels. Whether you're trading manually or prefer automated structure recognition, this indicator helps you contextualize market moves and locate key price zones with precision.
⚙️ Core Logic
🔍 Range Detection (Auto & Manual Modes)
In Auto mode, the indicator uses an advanced ZigZag system based on ATR or percentage thresholds to confirm market swings and construct Fibonacci-based ranges.
In Manual mode, traders can define their own swing low and high to generate precise custom ranges.
📐 Fibonacci Mapping
Each detected range is automatically plotted with key Fibonacci retracement levels — 0%, 25%, 50%, 75%, 100% — along with optional extensions (127.2% and 161.8%) to anticipate price continuations or reversals.
📋 Live Data Table
An integrated info panel dynamically displays crucial metrics:
• Range size
• Current price zone (Discount / Mid / Premium)
• Position within range (%)
• Distance to range extremes
• Range status (Pending or Confirmed)
🕰️ Historical Memory
Up to 20 past ranges can be stored and visualized simultaneously, helping traders recognize repeated price behaviors and contextual support/resistance levels.
🎨 Visual Highlights
Zones of interest (0–25% = Discount, 75–100% = Premium) are color-coded with custom transparency, and labels can be toggled for clarity. The current active range updates in real time as structure evolves.
🔧 User Customization
• Detection Method: Choose between ATR or % ZigZag for automated swing identification
• Confirmation Delay: Set how many bars to wait before confirming a new high
• Manual Overrides: Select exact price levels when you want full control
• Extensions & Labels: Toggle additional lines and info to suit your charting style
• Visual Table Position: Customize where the data table appears on screen
• Color Scheme: Define your own zone gradients for better visual interpretation
📈 Use Cases
This indicator is ideal for traders who want to:
• Identify value zones within local or macro price structures
• Plan trades around Fibonacci retracement and extension levels
• Detect shifts in market structure using an adaptive ZigZag logic
• Track recurring price ranges and historical reaction points
• Enhance technical confluence with clean, visual price mapping
⚠️ Important Notes
This tool is not a buy/sell signal generator — it is a visual framework for structure-based analysis.
Use it in conjunction with your existing strategy and risk management process.
Always confirm with broader context and multi-timeframe alignment.

Day‑trade Long/Short Signalsday trade Long\Short signals idskator
Displays EMA 5, 8, and 13 to track the trend.
Signals LONG when EMA5 crosses above EMA8 and the MACD line is above the signal line.
Signals SHORT when EMA5 crosses below EMA8 and the MACD line is below the signal line.

Enhanced Market Structure StrategyATR-Based Risk Management:
Stop Loss: 2 ATR from entry (configurable)
Take Profit: 3 ATR from entry (configurable)
Dynamic Position Sizing: Based on ATR stop distance and max risk percentage
Advanced Signal Filters:
RSI Filter:
Long trades: RSI < 70 and > 40 (avoiding overbought)
Short trades: RSI > 30 and < 60 (avoiding oversold)
Volume Filter:
Requires volume > 1.2x the 20-period moving average
Ensures institutional participation
MACD Filter (Optional):
Long: MACD line above signal line and rising
Short: MACD line below signal line and falling
EMA Trend Filter:
50-period EMA for trend confirmation
Long trades require price above rising EMA
Short trades require price below falling EMA
Higher Timeframe Filter:
Uses 4H/Daily EMA for multi-timeframe confluence
Enhanced Entry Logic:
Regular Entries: IDM + BOS + ALL filters must pass
Sweep Entries: Failed breakouts with tighter stops (1.6 ATR)
High-Probability Focus: Only trades when multiple confirmations align
Visual Improvements:
Detailed Entry Labels: Show entry, stop, target, and risk percentage
SL/TP Lines: Visual representation of risk/reward
Filter Status: Bar coloring shows when all filters align
Comprehensive Statistics: Real-time performance metrics
Key Strategy Parameters:
pinescript// Recommended Settings for Different Markets:
// Forex (4H-Daily):
// - CHoCH Period: 50-75
// - ATR SL: 2.0, ATR TP: 3.0
// - All filters enabled
// Crypto (1H-4H):
// - CHoCH Period: 30-50
// - ATR SL: 2.5, ATR TP: 4.0
// - Volume filter especially important
// Indices (4H-Daily):
// - CHoCH Period: 50-100
// - ATR SL: 1.8, ATR TP: 2.7
// - EMA and MACD filters crucial
Expected Performance Improvements:
Win Rate: 55-70% (improved filtering)
Profit Factor: 2.0-3.5+ (better risk/reward with ATR)
Reduced Drawdown: Stricter filters reduce false signals
Consistent Risk: ATR-based stops adapt to volatility
This enhanced version provides much more robust signal filtering while maintaining the core market structure edge, resulting in higher-probability trades with consistent risk management.

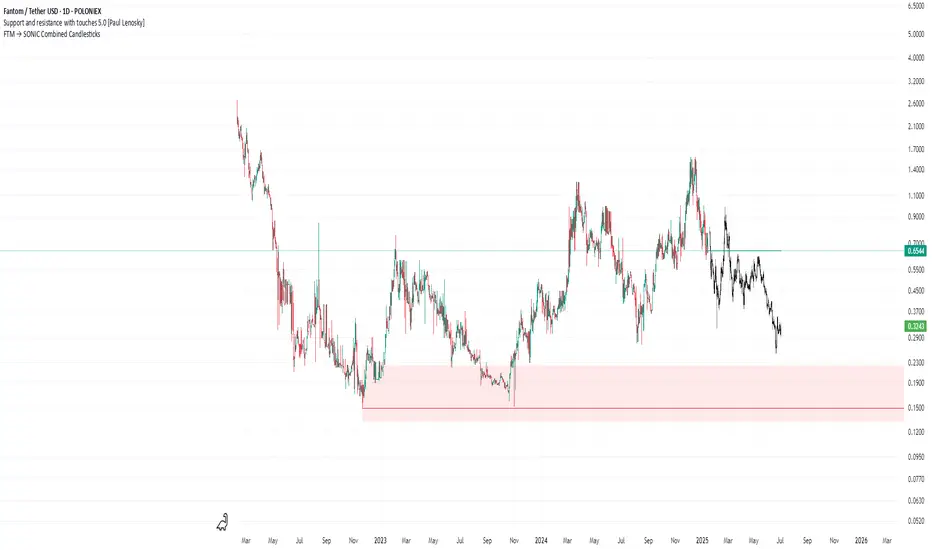
FTM → SONIC Combined Candlesticksthis script combines the chart of FTM and SONIC to get a better overview of the entire price action
ORB Scalp setup by UnenbatDescription
ORB Scalp Setup by Unenbat is a precise breakout scalping tool that identifies short-term price ranges at the transition between hourly sessions.
📌 Core Features:
Draws a dynamic box using the price range from the last 3 minutes of the previous hour and the first 3 minutes of the new hour (total 5m59s range).
Automatically plots:
Box representing the selected range.
Opening Price Line at the start of the hour.
TP Lines (Take Profit) above and below the box at customizable distances.
BE Lines (Break-Even) above and below the box at customizable distances.
Box and line lengths are user-defined (default: 60 minutes).
Works across historical data (up to the last 100 days).
Fully customizable visuals (colors, offsets, visibility toggles).
🎯 How to Use:
Ideal for scalp traders using breakout strategies.
Enter trades when price breaks above or below the box range.
Use TP and BE lines as clear reference levels for exits or trailing stop logic.
⚙️ Custom Settings:
Enable/disable each component (box, open line, TP line, BE line).
Set your own offset in pips for TP/BE lines.
Adjust the box duration to match your trading style.
Modify start and end times of the range as needed.

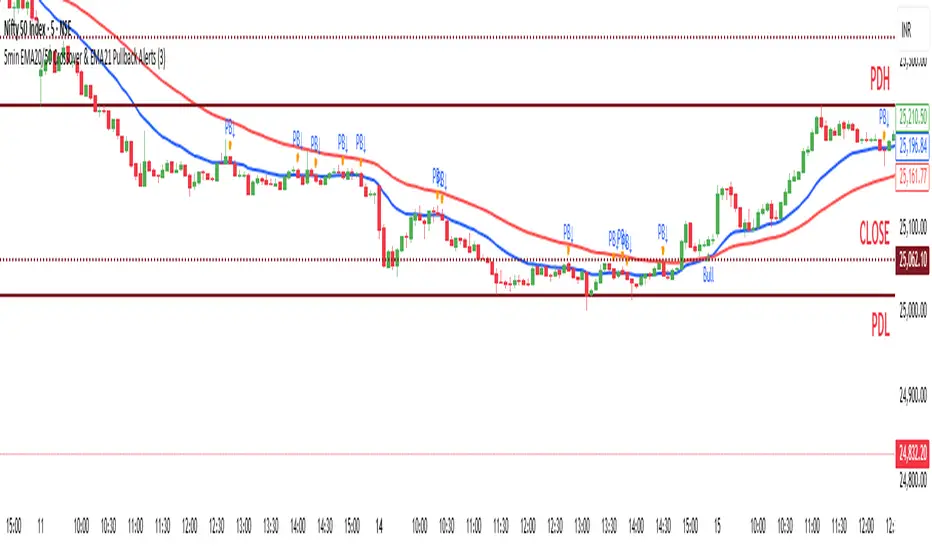
Sesiones + FVG + PDH / PDLMarket Sessions: Define and visualize four market sessions (New York, London, Tokyo, Sydney) with options to display ranges, trend lines, averages, VWAP, and highs/lows.
Dashboard: A panel that displays the status of the sessions (active/inactive) and, in advanced mode, the coefficient of determination (R2) of the trend line and the volume for each session.
Fair Value Gaps (FVG) / Imbalances: Detect and draw Fair Value Gaps (also known as imbalances or inefficiencies) on multiple time frames, with options to extend them, change their color when tested, and adjust their levels if the price touches them.
Previous Day/Week/Month Levels: Displays the highs and lows of the previous day and week (PDH/PDL, PWH/PWL), as well as the opening prices of the current day, week, and month (DO, WO, MO).

Hidden Liquidity Shift DetectorPurpose
The Hidden Liquidity Shift Detector identifies candles that indicate potential hidden accumulation or distribution activity based on volume and price action behavior. These setups often represent institutional absorption of liquidity ahead of larger moves.
How It Works
The script detects candles with the following characteristics:
Small real body relative to the total candle range
A strong wick (upper or lower) indicating rejection
Volume significantly higher than the recent average
It flags:
Hidden Selling (Distribution) when a bearish candle has a long upper wick and high volume
Hidden Buying (Accumulation) when a bullish candle has a long lower wick and high volume
These candles are often missed by traditional indicators but may precede significant reversals or breakouts.
Features
Automatic detection of absorption-style candles
Volume spike filtering based on configurable multiplier
Wick and body ratio thresholds to fine-tune signal quality
Non-intrusive signal markers (colored circles)
Real-time alerts for hidden buying/selling signals
Usage Tips
Use on 15m to 4H charts for intraday detection, or Daily for swing setups
Combine with support/resistance or volume profile zones for higher conviction
Clusters of signals in the same area increase reversal probability
Can be used alongside Wyckoff-style logic or smart money concepts

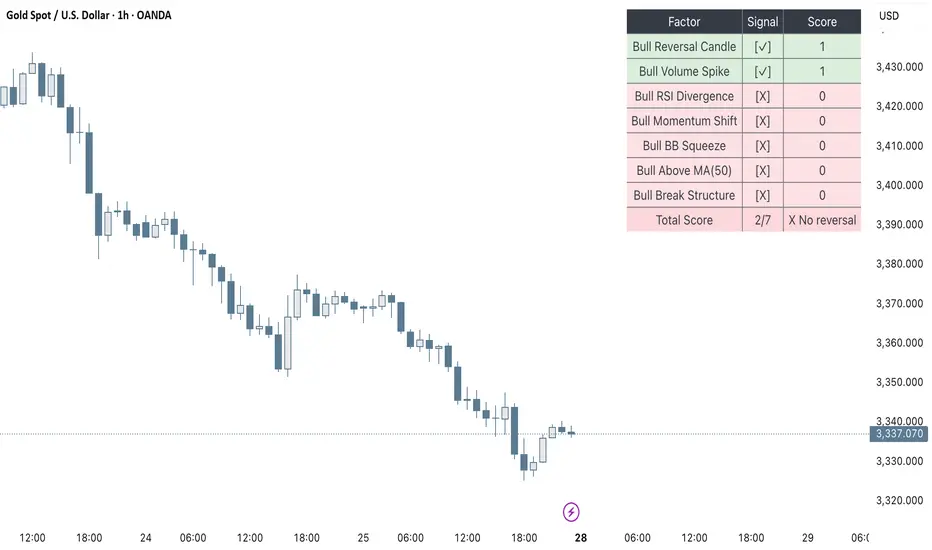
Clarix Smart Reversal ScorecardPurpose
Designed to identify potential trend reversal setups based on a rules-based scoring system. It helps traders quickly assess the strength of reversal signals using objective technical criteria.
How It Works
The script evaluates seven key technical conditions for both bullish and bearish reversals. Each condition met adds 1 point to the total score (max 7). A table displays the results with a final score and an automatic conclusion based on the strength of the setup.
Features
Reversal signal scoring from 0 to 7
Bullish and bearish detection modes
Visual scorecard table with individual factors
Configurable minimum score to show
Alert conditions for strong (5+) and perfect (7) setups
Lightweight and optimized for all timeframes
Usage Tips
Set "Direction" to Bullish, Bearish, or Both depending on your strategy
Use on timeframes between 15m to 4H for optimal signals
A score of 5 or more suggests strong reversal potential
Combine with key support/resistance or trend context for higher accuracy
Avoid using during high-volatility news events for cleaner signals
EMA-SMA & RSI Strategyusing RSI and EMA strategy, it works on RSI based rules as well as indicator based rules

Clarix Smart FlipPurpose
This tool identifies high-probability intraday reversals by detecting when price flips through the daily open after strong early-session commitment.
How It Works
A valid flip occurs when:
The previous daily candle is bullish or bearish
The first hour today continues in the same direction
Then, the price flips back through the daily open with a minimum break threshold (user-defined)
This setup is designed to catch liquidity grabs or fakeouts near the daily open, where early buyers or sellers get trapped after showing commitment
Signal Logic
Buy Flip
Previous day bearish → first hour bearish → price flips above open
Sell Flip
Previous day bullish → first hour bullish → price flips below open
Features
Configurable flip threshold in percentage
Signals only activate after the first hour ends
Daily open line displayed on chart
Simple triangle markers with no visual clutter
Alerts ready to use for automation or notifications
Usage Tips
Use "Once Per Bar" alert mode to get notified immediately when the flip happens
Works best in active markets like FX, indices, or crypto
Adjust threshold based on asset volatility
Suggested stop loss: use the previous daily high for sell flips or the previous daily low for buy flips
Suggested take profit: secure at least 30 pips to aim for a 1:3 risk-to-reward ratio on average

Clarix Ichimoku DashboardPurpose
The Mariam Ichimoku Dashboard is designed to simplify the Ichimoku trading system for both beginners and experienced traders. It provides a complete view of trend direction, strength, momentum, and key signals all in one compact dashboard on your chart. This tool helps traders make faster and more confident decisions without having to interpret every Ichimoku element manually.
How It Works
1. Trend Strength Score
Calculates a score from -5 to +5 based on Ichimoku components.
A high positive score means strong bullish momentum.
A low negative score shows strong bearish conditions.
A near-zero score indicates a sideways or unclear market.
2. Future Cloud Bias
Looks 26 candles ahead to determine if the future cloud is bullish or bearish.
This helps identify the longer-term directional bias of the market.
3. Flat Kijun / Flat Senkou B
Detects flat zones in the Kijun or Senkou B lines.
These flat areas act as strong support or resistance and can attract price.
4. TK Cross
Identifies Tenkan-Kijun crosses:
Bullish Cross means Tenkan crosses above Kijun
Bearish Cross means Tenkan crosses below Kijun
5. Last TK Cross Info
Shows whether the last TK cross was bullish or bearish and how many candles ago it happened.
Helps track trend development and timing.
6. Chikou Span Position
Checks if the Chikou Span is above, below, or inside past price.
Above means bullish momentum
Below means bearish momentum
Inside means mixed or indecisive
7. Near-Term Forecast (Breakout)
Warns when price is near the edge of the cloud, preparing for a potential breakout.
Useful for anticipating price moves.
8. Price Breakout
Shows if price has recently broken above or below the cloud.
This can confirm the start of a new trend.
9. Future Kumo Twist
Detects upcoming twists in the cloud, which often signal potential trend reversals.
10. Ichimoku Confluence
Measures how many key Ichimoku signals are in agreement.
The more signals align, the stronger the trend confirmation.
11. Price in or Near the Cloud
Displays if the price is inside the cloud, which often indicates low clarity or a choppy market.
12. Cloud Thickness
Shows whether the cloud is thin or thick.
Thick clouds provide stronger support or resistance.
Thin clouds may allow easier breakouts.
13. Recommendation
Gives a simple trading suggestion based on all major signals.
Strong Buy, Strong Sell, or Hold.
Helps simplify decision-making at a glance.
Features
All major Ichimoku signals summarized in one panel
Real-time trend strength scoring
Detects flat zones, crosses, cloud twists, and breakouts
Visual alerts for trend alignment and signal confluence
Compact, clean design
Built with simplicity in mind for beginner traders
Tips
Best used on 15-minute to 1-hour charts for short-term trading
Avoid entering trades when price is inside the cloud because the market is often indecisive
Wait for alignment between trend score, TK cross, cloud bias, and confluence
Use the dashboard to support your trading strategy, not replace it
Enable alerts for major confluence or upcoming Kumo twists
