WaveMap: Elliott Wave & Fibonacci Targets(Mastersinnifty)Description
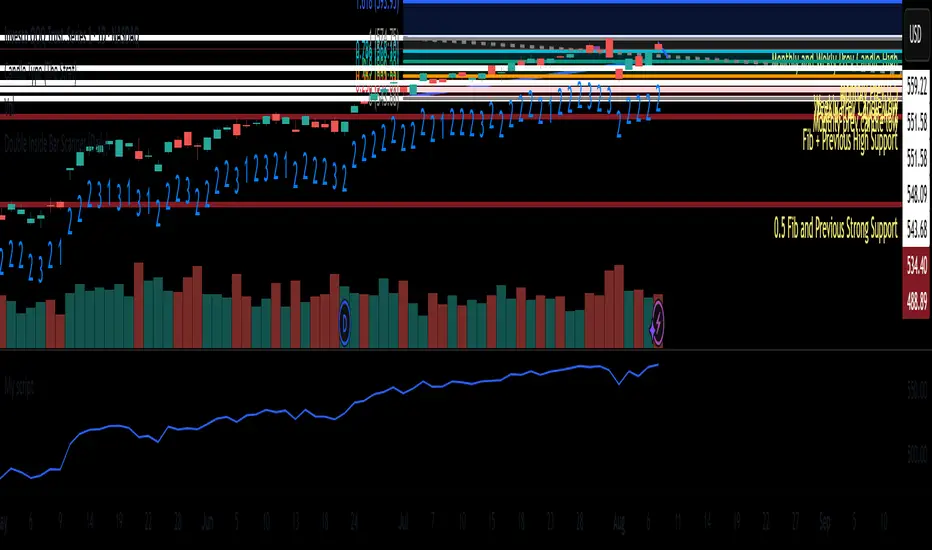
WaveMap: Elliott Wave & Fibonacci Targets is a multi-purpose wave analysis tool designed to identify Elliott Wave patterns, draw price projections, and display Fibonacci retracement levels directly on the chart. It combines pivot detection with pattern recognition to highlight potential impulse and corrective phases, along with probable future targets.
How It Works
Uses pivot highs and lows to detect swing points over a user-defined length.
Identifies basic Elliott Wave structures as Impulse Up, Impulse Down, or Corrective.
Calculates price targets based on typical wave relationships (e.g., 1.618× Wave 1 for Wave 3).
Plots Fibonacci retracement levels between the most recent swing high and low.
Displays projections for up to three potential future targets using dashed lines and labels.
Provides an information table showing current wave type, wave count, price, and trend bias.
Generates alerts when new wave highs or lows are detected.
Inputs
Wave Detection Length – Number of bars used for pivot identification.
Future Projection Bars – How far ahead projections are plotted.
Wave Sensitivity – Adjusts detection sensitivity for wave turns.
Show Wave Labels – Toggles the on-chart information table.
Show Future Projections – Enables/disables projection lines and targets.
Show Fibonacci Levels – Enables/disables Fibonacci retracement lines and labels.
Wave Lines Color – Color for wave connection lines.
Projection Color – Color for projected target lines.
Fibonacci Color – Color for Fibonacci retracement levels.
Use Case
Identify and visualize Elliott Wave patterns to assist in market structure analysis.
Plan trade entries and exits using projected wave targets.
Combine wave detection with Fibonacci retracement for confluence zones.
Track trend bias and momentum during live trading sessions.
Disclaimer
This script is for educational and informational purposes only. Elliott Wave and Fibonacci projections are subjective and should be used in conjunction with other forms of technical analysis. Past performance does not guarantee future results. Always perform your own research and manage risk appropriately before trading.
Chart patterns

Nifty50 Swing Trading Super Indicator# 🚀 Nifty50 Swing Trading Super Indicator - Complete Guide
**Created by:** Gaurav
**Date:** August 8, 2025
**Version:** 1.0 - Optimized for Indian Markets
---
## 📋 Table of Contents
1. (#quick-start-guide)
2. (#indicator-overview)
3. (#installation-instructions)
4. (#parameter-settings)
5. (#signal-interpretation)
6. (#trading-strategy)
7. (#risk-management)
8. (#optimization-tips)
9. (#troubleshooting)
---
## 🎯 Quick Start Guide
### What You Get
✅ **2 Complete Pine Script Indicators:**
- `swing_trading_super_indicator.pine` - Universal version for all markets
- `nifty_optimized_super_indicator.pine` - Specifically optimized for Nifty50 & Indian stocks
✅ **Key Features:**
- Multi-component signal confirmation system
- Optimized for daily and 3-hour timeframes
- Built-in risk management with dynamic stops and targets
- Real-time signal strength monitoring
- Gap analysis for Indian market characteristics
### Immediate Setup
1. Copy the Pine Script code from `nifty_optimized_super_indicator.pine`
2. Paste into TradingView Pine Editor
3. Add to chart on daily or 3-hour timeframe
4. Look for 🚀BUY and 🔻SELL signals
5. Use the information table for signal confirmation
---
## 🔍 Indicator Overview
### Core Components Integration
**🎯 Range Filter (35% Weight)**
- Primary trend identification using adaptive volatility filtering
- Optimized sampling period: 21 bars for Indian market volatility
- Enhanced range multiplier: 3.0 to handle market gaps
- Provides trend direction and strength measurement
**⚡ PMAX (30% Weight)**
- Volatility-adjusted trend confirmation using ATR-based calculations
- Dynamic multiplier adjustment based on market volatility
- 14-period ATR with 2.5 multiplier for swing trading sensitivity
- Offers trailing stop functionality
**🏗️ Support/Resistance (20% Weight)**
- Dynamic level identification using pivot point analysis
- Tighter channel width (3%) for precise Indian market levels
- Enhanced strength calculation with historical interaction weighting
- Provides entry/exit timing and breakout signals
**📊 EMA Alignment (15% Weight)**
- Multi-timeframe moving average confirmation
- Key EMAs: 9, 21, 50, 200 (popular in Indian markets)
- Hierarchical alignment scoring for trend strength
- Additional trend validation layer
### Advanced Features
**🌅 Gap Analysis**
- Automatic detection of significant price gaps (>2%)
- Gap strength measurement and impact on signals
- Specific optimization for Indian market overnight gaps
- Visual gap markers on chart
**⏰ Multi-Timeframe Integration**
- Higher timeframe bias from daily/weekly data
- Configurable daily bias weight (default 70%)
- 3-hour confirmation for precise entry timing
- Prevents counter-trend trades against major timeframe
**🛡️ Risk Management**
- Dynamic stop-loss calculation using multiple methods
- Automatic profit target identification
- Position sizing guidance based on signal strength
- Anti-whipsaw logic to prevent false signals
---
## 📥 Installation Instructions
### Step 1: Access TradingView
1. Open TradingView.com
2. Navigate to Pine Editor (bottom panel)
3. Create a new indicator
### Step 2: Copy the Code
**For Nifty50 & Indian Stocks (Recommended):**
```pinescript
// Copy entire content from nifty_optimized_super_indicator.pine
```
**For Universal Use:**
```pinescript
// Copy entire content from swing_trading_super_indicator.pine
```
### Step 3: Configure and Apply
1. Click "Add to Chart"
2. Select daily or 3-hour timeframe
3. Adjust parameters if needed (defaults are optimized)
4. Enable alerts for signal notifications
### Step 4: Verify Installation
- Check that all components are visible
- Confirm information table appears in top-right
- Test with known trending stocks for signal validation
---
## ⚙️ Parameter Settings
### 🎯 Range Filter Settings
```
Sampling Period: 21 (optimized for Indian market volatility)
Range Multiplier: 3.0 (handles overnight gaps effectively)
Source: Close (most reliable for swing trading)
```
### ⚡ PMAX Settings
```
ATR Length: 14 (standard for daily/3H timeframes)
ATR Multiplier: 2.5 (balanced for swing trading sensitivity)
Moving Average Type: EMA (responsive to price changes)
MA Length: 14 (matches ATR period for consistency)
```
### 🏗️ Support/Resistance Settings
```
Pivot Period: 8 (shorter for Indian market dynamics)
Channel Width: 3% (tighter for precise levels)
Minimum Strength: 3 (higher quality levels only)
Maximum Levels: 4 (focus on strongest levels)
Lookback Period: 150 (sufficient historical data)
```
### 🚀 Super Indicator Settings
```
Signal Sensitivity: 0.65 (balanced for swing trading)
Trend Strength Requirement: 0.75 (high quality signals)
Gap Threshold: 2.0% (significant gap detection)
Daily Bias Weight: 0.7 (strong higher timeframe influence)
```
### 🎨 Display Options
```
Show Range Filter: ✅ (trend visualization)
Show PMAX: ✅ (trailing stops)
Show S/R Levels: ✅ (key price levels)
Show Key EMAs: ✅ (trend confirmation)
Show Signals: ✅ (buy/sell alerts)
Show Trend Background: ✅ (visual trend state)
Show Gap Markers: ✅ (gap identification)
```
---
## 📊 Signal Interpretation
### 🚀 BUY Signals
**Requirements for BUY Signal:**
- Price above Range Filter with upward trend
- PMAX showing bullish direction (MA > PMAX line)
- Support/resistance breakout or favorable positioning
- EMA alignment supporting upward movement
- Higher timeframe bias confirmation
- Overall signal strength > 75%
**Signal Strength Indicators:**
- **90-100%:** Extremely strong - Maximum position size
- **80-89%:** Very strong - Large position size
- **75-79%:** Strong - Standard position size
- **65-74%:** Moderate - Reduced position size
- **<65%:** Weak - Wait for better opportunity
### 🔻 SELL Signals
**Requirements for SELL Signal:**
- Price below Range Filter with downward trend
- PMAX showing bearish direction (MA < PMAX line)
- Resistance breakdown or unfavorable positioning
- EMA alignment supporting downward movement
- Higher timeframe bias confirmation
- Overall signal strength > 75%
### ⚖️ NEUTRAL Signals
**Characteristics:**
- Conflicting signals between components
- Low overall signal strength (<65%)
- Range-bound market conditions
- Wait for clearer directional bias
### 📈 Information Table Guide
**Component Status:**
- **BULL/BEAR:** Current signal direction
- **Strength %:** Component contribution strength
- **Status:** Additional context (STRONG/WEAK/ACTIVE/etc.)
**Overall Signal:**
- **🚀 STRONG BUY:** All systems aligned bullish
- **🔻 STRONG SELL:** All systems aligned bearish
- **⚖️ NEUTRAL:** Mixed or weak signals
---
## 💼 Trading Strategy
### Daily Timeframe Strategy
**Setup:**
1. Apply indicator to daily chart of Nifty50 or Indian stocks
2. Wait for 🚀BUY or 🔻SELL signal with >75% strength
3. Confirm higher timeframe bias alignment
4. Check for significant support/resistance levels
**Entry:**
- Enter on signal bar close or next bar open
- Use 3-hour chart for precise entry timing
- Avoid entries during major news events
- Consider gap analysis for overnight positions
**Position Sizing:**
- **>90% Strength:** 3-4% of portfolio
- **80-89% Strength:** 2-3% of portfolio
- **75-79% Strength:** 1-2% of portfolio
- **<75% Strength:** Avoid or minimal size
### 3-Hour Timeframe Strategy
**Setup:**
1. Confirm daily timeframe bias first
2. Apply indicator to 3-hour chart
3. Look for signals aligned with daily trend
4. Use for entry/exit timing optimization
**Entry Refinement:**
- Wait for 3H signal confirmation
- Enter on pullbacks to key levels
- Use tighter stops for better risk/reward
- Monitor intraday support/resistance
### Risk Management Rules
**Stop Loss Placement:**
1. **Primary:** Use indicator's dynamic stop level
2. **Secondary:** Below/above nearest support/resistance
3. **Maximum:** 2-3% of portfolio per trade
4. **Trailing:** Move stops with PMAX line
**Profit Taking:**
1. **Target 1:** First resistance/support level (50% position)
2. **Target 2:** Second resistance/support level (30% position)
3. **Runner:** Trail remaining 20% with PMAX
**Position Management:**
- Review positions at daily close
- Adjust stops based on new signals
- Exit if trend changes to opposite direction
- Reduce size during high volatility periods
---
## 🎯 Optimization Tips
### For Nifty50 Trading
- Use daily timeframe for primary signals
- Monitor sector rotation impact
- Consider index futures for better liquidity
- Watch for RBI policy and global cues impact
### For Individual Stocks
- Verify stock follows Nifty correlation
- Check sector-specific news and events
- Ensure adequate liquidity for position size
- Monitor earnings calendar for volatility
### Market Condition Adaptations
**Trending Markets:**
- Increase position sizes for strong signals
- Use wider stops to avoid whipsaws
- Focus on trend continuation signals
- Reduce counter-trend trading
**Range-Bound Markets:**
- Reduce position sizes
- Use tighter stops and quicker profits
- Focus on support/resistance bounces
- Increase signal strength requirements
**High Volatility Periods:**
- Reduce overall exposure
- Use smaller position sizes
- Increase stop-loss distances
- Wait for clearer signals
### Performance Monitoring
- Track win rate and average profit/loss
- Monitor signal quality over time
- Adjust parameters based on market changes
- Keep trading journal for pattern recognition
---
## 🔧 Troubleshooting
### Common Issues
**Q: Signals appear too frequently**
A: Increase "Trend Strength Requirement" to 0.8-0.9
**Q: Missing obvious trends**
A: Decrease "Signal Sensitivity" to 0.5-0.6
**Q: Too many false signals**
A: Enable "3H Confirmation" and increase strength requirements
**Q: Indicator not loading**
A: Check Pine Script version compatibility (requires v5)
### Parameter Adjustments
**For More Sensitive Signals:**
- Decrease Signal Sensitivity to 0.5-0.6
- Decrease Trend Strength Requirement to 0.6-0.7
- Increase Range Filter multiplier to 3.5-4.0
**For More Conservative Signals:**
- Increase Signal Sensitivity to 0.7-0.8
- Increase Trend Strength Requirement to 0.8-0.9
- Enable all confirmation features
### Performance Issues
- Reduce lookback periods if chart loads slowly
- Disable some visual elements for better performance
- Use on liquid stocks/indices for best results
---
## 📞 Support & Updates
This super indicator combines the best of Range Filter, PMAX, and Support/Resistance analysis specifically optimized for Indian market swing trading. The multi-component approach significantly improves signal quality while the built-in risk management features help protect capital.
**Remember:** No indicator is 100% accurate. Always combine with proper risk management, market analysis, and your trading experience for best results.
**Happy Trading! 🚀**

Tabela RSI e Tendência EMA MTF - 2This custom TradingView indicator provides a consolidated view of trend and Relative Strength Index (RSI) across multiple timeframes, all within an intuitive table directly on your chart. Designed for traders seeking quick and efficient analysis of market momentum and direction across different time horizons, this indicator automatically adapts to the asset you are currently viewing.

Gelişmiş Mum Ters StratejiAdvanced Candle Reversal Strategy Overview
This TradingView PineScript indicator detects potential reversal signals in candlestick patterns, focusing on a sequence of directional candles followed by a wick-based reversal candle. Here's a step-by-step breakdown:
User Inputs:
candleCount (default: 6): Number of consecutive candles required (2–20).
wickRatio (default: 1.5): Minimum wick-to-body ratio for reversal (1.0–5.0).
Options to show background colors and an info table.
Candle Calculations:
Computes body size (|close - open|), upper wick (high - max(close, open)), and lower wick (min(close, open) - low).
Identifies bullish (close > open) or bearish (close < open) candles.
Checks for long upper wick (≥ body * wickRatio) for short signals or long lower wick for long signals.
Sequence Check:
Verifies if the last candleCount candles are all bearish (for long signal) or all bullish (for short signal), including the current candle.
Signal Conditions:
Long Signal: candleCount bearish candles + current candle has long lower wick (plotted as green upward triangle below bar with "LONG" text).
Short Signal: candleCount bullish candles + current candle has long upper wick (plotted as red downward triangle above bar with "SHORT" text).
Additional Features:
Alerts for signals with custom messages.
Optional translucent background color (green for long, red for short).
Plots tiny crosses for long wicks not triggering full signals (yellow above for upper, orange below for lower).
Info table (top-right): Displays strategy summary, candle count, and signal explanations.
Debug label: On signals, shows wick/body ratio above the bar.
The strategy aims for reversals after trends (e.g., after 6 red candles, a red candle with long lower wick signals buy). Customize via inputs; backtest for effectiveness. Not financial advice.

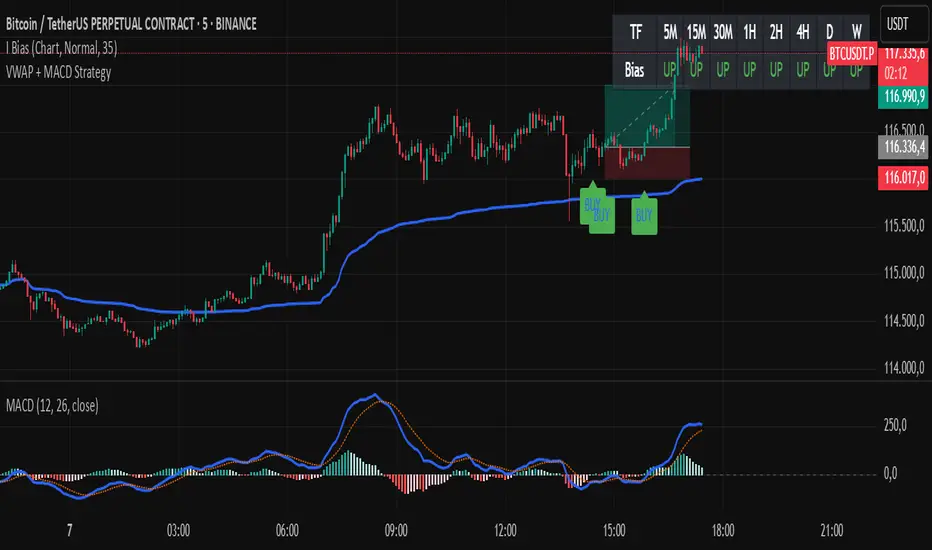
VWAP + MACD Estrategia MilloVWAP + MACD Strategy
This indicator combines the VWAP (Volume Weighted Average Price) with MACD (Moving Average Convergence Divergence) to create buy and sell signals. It helps traders identify potential market entry and exit points based on price action and momentum.
Conditions for Buy:
The price must be above the VWAP.
The MACD line crosses above the signal line (bullish crossover).
The MACD line is below the zero line.
Conditions for Sell:
The price must be below the VWAP.
The MACD line crosses below the signal line (bearish crossover).
The MACD line is above the zero line.
Features:
The VWAP line is plotted to represent the average price, weighted by volume, over a specified period.
Buy signals appear when all conditions are met for an upward price movement.
Sell signals appear when all conditions are met for a downward price movement.
MACD and Signal Line: The MACD helps to confirm momentum, while the signal line indicates possible trend reversals.
Customizable: You can modify the VWAP and MACD parameters to suit different trading strategies.
This strategy is designed for intraday traders and scalpers, aiming to catch quick movements while being aware of market momentum.
Feel free to share this description along with the code! Let me know if you need any adjustments or further explanations.
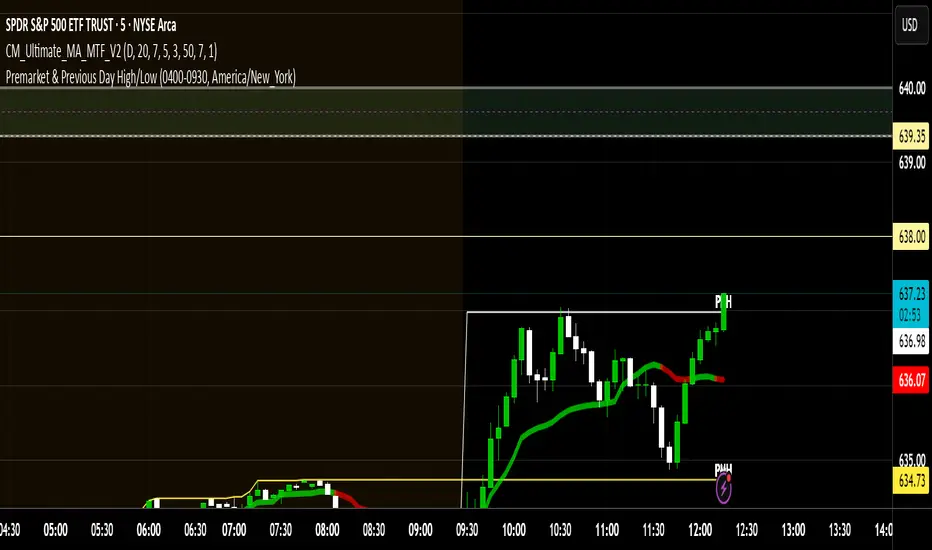
BTC/USD Breakout Hours – IST (Hyderabad)This indicator highlights the most volatile BTC/USD trading hours based on Hyderabad (IST) time.
It marks three key breakout windows:
London–US Overlap (17:30–20:30 IST) – Highest liquidity & volatility
US Market Open Momentum (19:00–23:30 IST) – Strong trend moves
Early London Session (12:30–15:30 IST) – Pre-US setup moves
The script automatically converts chart time to IST, shades each breakout window, and includes optional alerts for:
Window start
15 minutes before start
Ideal for traders who want to align entries with high-probability market moves while avoiding low-volume hours.
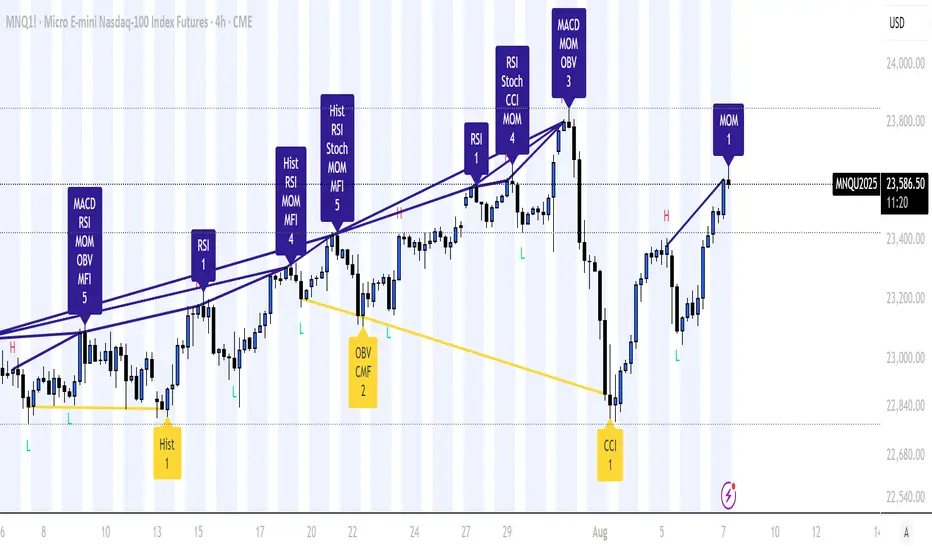
Divergence Mucho Indicators w/ AlertsUsed to signal divergences of well known indicators bearish or bullish. I prefer to create the alert option that shows 4 or more signaling.
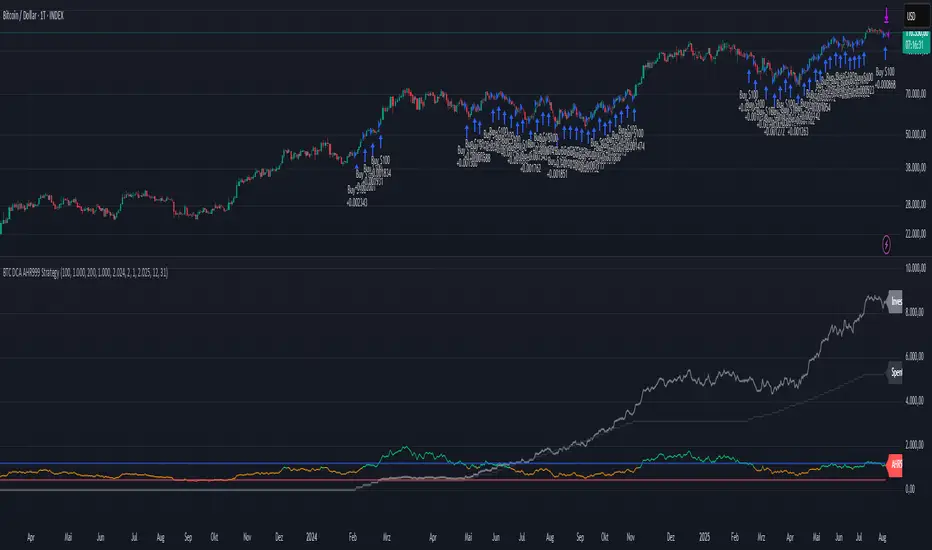
BTC DCA AHR999 Strategy
This is an easy to understand and perform DCA strategy, based on the AHR999 indicator.
The initial strategy is based on the AHR999 indicator script from discountry, that is with this script transformed into a TV strategy:
The logic is pretty simple:
we do a DCA buy every week (in the code it is set on monday)
we do a small DCA buy, as long as AHR999 < 1.2 (signaling moderate BTC price)
we do a big DCA buy, as long as AHR < 0.45 (signaling undervalued BTC price)
we skip buys, as long as AHR > 1.2 (signaling overvalued BTC price)
Values for "small DCA buy" and "big DCA buy" can be adjusted, aswell as timeframe, we want the backtest for and a scale factor, to show the AHR999 indicator in the plot, aswell as the spent capital and the net worth of the accumulated BTC.
The scale factor of the plot can be varied, depending on the timeframe and input capital you are using (recommendation is to use a scale factor to be able to see the AHR999 indicator itself on the chart in a meaningful way).
RSI (14) with Auto Zone Colors — Overbought/Oversold HighlighterThis indicator plots the Relative Strength Index (RSI 14) with dynamic color changes for instant visual clarity:
✅ Green line in overbought zone (≥70)
✅ Red line in oversold zone (≤30)
✅ White line in neutral range (30–70)
Includes reference lines at 70, 50, and 30 for quick decision-making. Perfect for spotting momentum extremes, divergences, and potential reversal points without squinting at numbers. Works on any timeframe.

RSI - 主图 [盯盘狗]
On the right side of the K-line main chart, RSI (Relative Strength Index) is presented in the form of an independent panel, forming a closely linked "watchdog" monitoring combination with price trends.
The RSI indicator line is framed by a numerical range of 0-100, with three different periodic lines (usually 6 days, 12 days, and 24 days) interweaving and fluctuating within the panel: the short-term line is sensitive, capturing subtle price changes like a hunting dog, and fleeting ups and downs can trigger its rapid fluctuations; The medium-term line is relatively stable, like an experienced guard dog, anchoring the trend direction in short-term fluctuations; Long term lines are like steady sheepdogs, filtering out noise and outlining the strong and weak contours of large cycles.
When the indicator line breaks through the overbought warning line above 70, it sounds like a "watchdog dog" giving a warning bark, indicating that the price may face downward pressure due to overheating; When it falls below the oversold area of 30, it gives a potential rebound signal like a dog sensing an opportunity. The golden cross (short-term over medium-term, long-term) and death cross (short-term over medium-term, long-term) of the three lines are like the body language of a "market dog", intuitively conveying the transition nodes of long and short forces, allowing traders to capture the strong and weak market sentiment at the same time as the main chart price changes, achieving a close monitoring effect of "one chart, two views".
Coin Circle/Virtual Currency/Quantitative Strategy Name: Watch Dog
one ️⃣ Strategy Description:
🔍 Principle:
By monitoring over 200 currencies and automatically opening positions when conditional opening signals appear;
If the stop loss occurs, the next double opening will be executed in a loop until the profit is taken;
Maximum record:
Three day profit of 133%
Eight day return of 242%
17 day return of 553% 🚀
✅ advantage:
Automatic opening+automatic take profit and stop loss
The winning rate is as high as 80%
Contact v: rggboom, join the group
Address: github.com

MomentumSync-PSAR: RSI·ADX Filtered 3-Tier Exit StrategyTriSAR-E3 is a precision swing trading strategy designed to capitalize on early trend reversals using a Triple Confirmation Model. It triggers entries based on an early Parabolic SAR bullish flip, supported by RSI strength and ADX trend confirmation, ensuring momentum-backed participation.
Exits are tactically managed through a 3-step staged exit after a PSAR bearish reversal is detected, allowing gradual profit booking and downside protection.
This balanced approach captures trend moves early while intelligently scaling out, making it suitable for directional traders seeking both agility and control.

🔍 Confirmed Scalping Signals (Stoch+EMA+Supertrend)🔍 Confirmed Scalping Signals (Stoch+EMA+Supertrend)
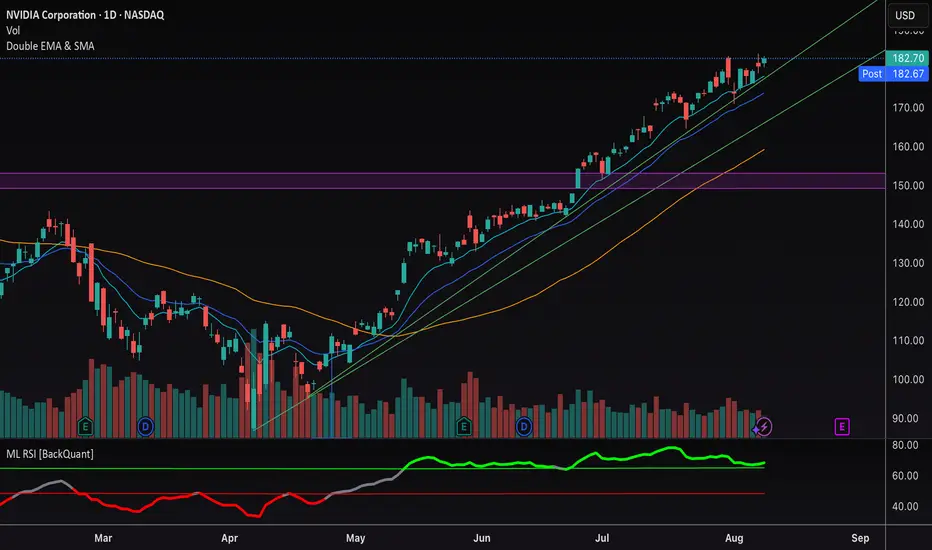
Double EMA & SMAThis indicator plots two Exponential Moving Averages (EMAs) and one Simple Moving Average (SMA) directly on the price chart to help identify market trends and momentum shifts.
By default, it displays:
• EMA 1 (10-period) – short-term trend
• EMA 2 (20-period) – medium-term trend
• SMA (50-period) – broader trend baseline
The combination allows traders to quickly spot trend direction, potential reversal points, and areas of dynamic support or resistance. Suitable for scalping, swing trading, and longer-term analysis across any market.
RSI + MACD + EMA Buy/Sell ComboRSI + MACD + EMA Buy/Sell Combo with signals if all 2 lines up it will create buy and cell signals
【macd】macd背离主图版
The intuitive expression of deviating from the signal
When the price is out of sync with the MACD indicator, the main chart will strengthen the divergence feature through dynamic annotation:
Top divergence: When the price reaches a new high (such as a higher upper shadow or physical vertex formed by the K-line), but the MACD bar shows a shortening trend, and the MACD line fails to break through the previous high synchronously, a downward arrow will appear next to the high K-line, and an orange shadow will be used to mark the "top divergence interval", indicating the depletion of bullish momentum;
Bottom divergence: When the price reaches a new low (such as a lower shadow or physical low on the candlestick), but the MACD bar elongates instead and the MACD line does not synchronously fall below the previous low, an upward arrow will appear next to the low candlestick and a blue shadow will mark the "bottom divergence interval", indicating insufficient bearish momentum.
Coin Circle/Virtual Currency/Quantitative Strategy Name: Watch Dog
one ️⃣ Strategy Description:
🔍 Principle:
By monitoring over 200 currencies and automatically opening positions when conditional opening signals appear;
If the stop loss occurs, the next double opening will be executed in a loop until the profit is taken;
Maximum record:
Three day profit of 133%
Eight day return of 242%
17 day return of 553% 🚀
✅ advantage:
Automatic opening+automatic take profit and stop loss
The winning rate is as high as 80%
Contact v: rggboom, join the group
Address: github.com

Hurst Cycle Projections & Market Phase Analyzer(Mastersinnifty)Description
The Hurst Cycle Projections & Market Phase Analyzer is a technical analysis tool designed to detect dominant market cycles, project potential future price paths, and identify prevailing market phases. Using the Hurst exponent, harmonic cycle analysis, and trend strength evaluation, it provides traders with visual cycle channels, forward projections, and an at-a-glance market condition table.
This indicator is ideal for traders who want to combine cycle theory with trend analysis for timing entries, exits, and managing risk.
How It Works
Calculates the Hurst exponent to determine whether the market is trending or mean-reverting.
Identifies the dominant cycle length using pivot-based cycle detection.
Generates a cycle price channel to frame current market action.
Performs harmonic analysis to track multiple related cycles.
Projects future price levels based on cycle phase, trend strength, and mean reversion tendencies.
Displays a summary table with Hurst exponent, cycle length, trend strength, cycle phase, and market state.
Includes alerts for Hurst exponent crossovers and cycle turning points.
Inputs
Cycle Analysis Length – Number of bars used for cycle detection and Hurst exponent calculation.
Projection Bars – Number of future bars to project prices.
Show Cycle Lines – Toggle visibility of cycle markers.
Show Price Projections – Enable/disable forward price lines.
Show Cycle Channel – Display cycle-based price channel.
Cycle Sensitivity – Adjust responsiveness of cycle detection.
Colors – Customize cycle, projection, and channel colors.
Use Case
Identify whether the market is currently trending or mean-reverting.
Anticipate potential price turning points based on cycle phases.
Project possible future price levels for trade planning.
Spot trend strength and direction within the context of cycles.
Assist in swing trading, position trading, or long-term analysis.
Disclaimer
This indicator is for educational and analytical purposes only. It does not constitute financial advice. Trading in financial markets involves risk, and past performance is not indicative of future results. Always use proper risk management and consult with a licensed financial professional before making investment decisions.

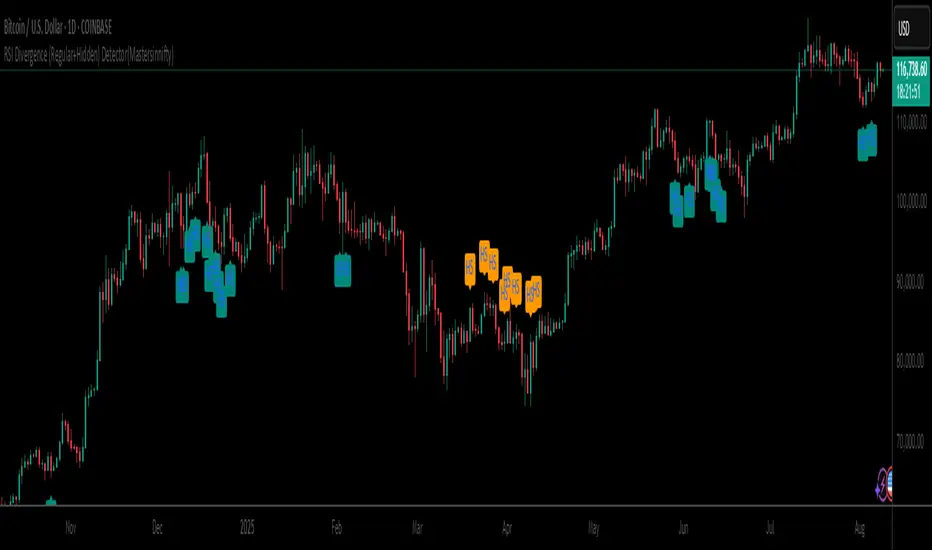
RSI Divergence (Regular+Hidden) Detector(Mastersinnifty)Description
The RSI Divergence (Regular + Hidden) Detector identifies both regular and hidden divergences between price and the Relative Strength Index (RSI). It automatically marks divergence points on the chart using short-form labels for quick recognition:
RB – Regular Bullish Divergence
RS – Regular Bearish Divergence
HB – Hidden Bullish Divergence
HS – Hidden Bearish Divergence
This tool helps traders spot potential reversals or trend continuation setups with clear, on-chart visual signals.
How It Works
Calculates RSI based on user-selected source and length.
Scans a specified lookback range for matching high/low points in price and RSI.
Validates divergences based on minimum RSI difference and minimum price percentage difference.
Marks detected divergences with short-form labels directly on the price chart.
Allows toggling between regular and hidden divergence detection.
Inputs
RSI Length – Period for RSI calculation.
Lookback Bars – Number of bars to scan for divergence.
Minimum RSI Difference – Minimum required RSI value change between points.
Minimum Price Difference (%) – Minimum required price percentage change between points.
Overbought / Oversold Levels – RSI thresholds for signal validation.
Show Regular Divergences – Enable/disable regular divergence detection.
Show Hidden Divergences – Enable/disable hidden divergence detection.
Use Case
Identify potential reversal points using regular divergences.
Spot possible trend continuation opportunities with hidden divergences.
Enhance entry/exit timing by combining divergence signals with other technical tools.
Apply in any market and timeframe, from scalping to swing trading.
Disclaimer
This indicator is for educational and research purposes only. It does not guarantee future performance. Always combine signals with your own analysis and risk management strategy before making trading decisions.
CCI Multi-Period Long/Short Strategythe strategy based on multi period cci. you can use it on 15 min. or bigger timeframe.

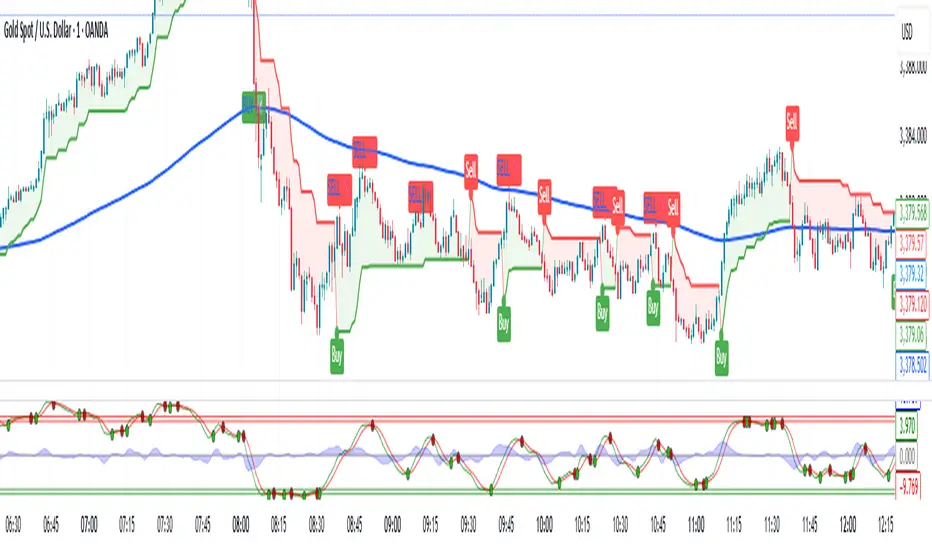
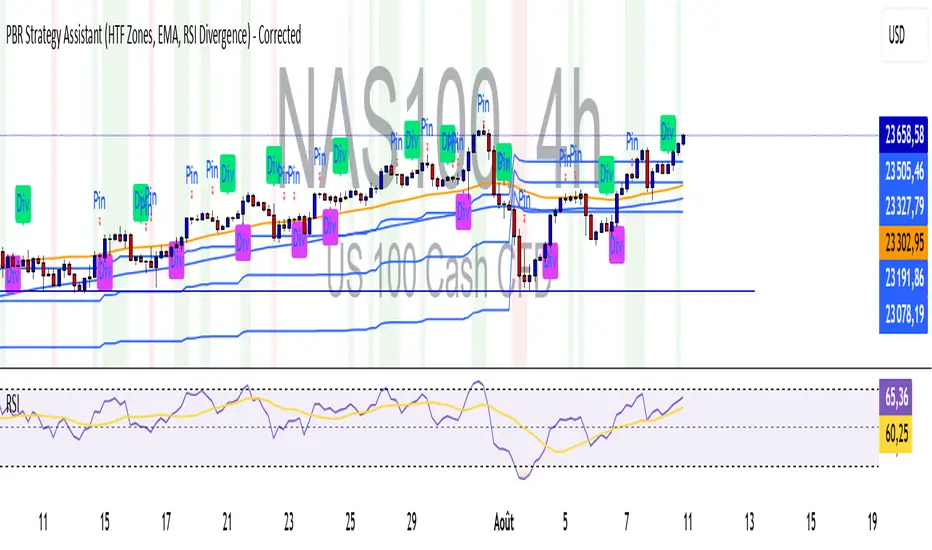
PBR Strategy Assistant Gold.D FingerGold.D Finger Strategy. This indicator gives an overview of my first strategies with several confluences. I just wanted to test what it would look like in this format, but it does not exactly match the one I actually use.
EMA band 12/60/150/200EMA band consisting of 12/60/150/200
Specifically for Indian stock market, can be used for other trading scripts after testing.
Best use case : on Daily TF.
Bull run entry criteria, Not bear market or Bottom catching.

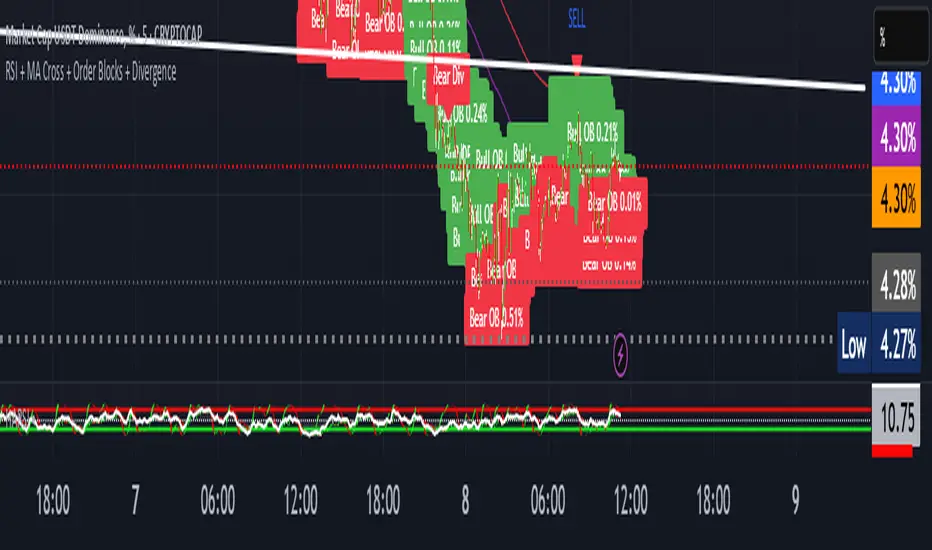
Divergence Mucho Indicators v6 AlertsShows divergence for well known indicators. Allows option to create alert for 4 or more divergences signaling.
Double Inside Bar Scanner [Daily]Double Inside Bar Scanner . Captures Double Inside based on last 2 daily Bars