The Strat The Strat Bar Type Identifier – Pure Price Action Logic
This open-source indicator implements the foundational bar classification of "The Strat" method developed by Rob Smith. It identifies each candle on the chart as one of the three core types used in The Strat:
* Inside Bar (1): The candle’s range is fully within the previous candle’s range. This indicates consolidation or balance and often precedes breakouts or reversals.
* Two-Up Bar (2U): The current candle breaks the previous high but does not break its low. This is considered bullish directional movement.
* Two-Down Bar (2D): The current candle breaks the previous low but not the high. This signals bearish directional movement.
* Outside Bar (3): The candle breaks both the high and the low of the previous candle, signaling a broadening formation and high volatility.
The script plots a character below each candle based on its type:
* "1" for Inside Bar
* "2" for Two-Up or Two-Down (color-coded)
* "3" for Outside Bar
This tool helps traders quickly identify actionable setups according to The Strat method and serves as a foundation for more advanced strategies like the 3-1-2 reversal or 1-2-2 continuation.
All calculations are based purely on price action—no indicators, no smoothing, no lagging elements. It is ideal for traders looking to understand price structure and bar sequencing from a Strat perspective.
To use:
1. Add the indicator to any chart and timeframe.
2. Look for the numbers below the candles.
3. Analyze the sequence of bar types to spot Strat setups.
This script is educational and can be extended with multi-timeframe context, FTFC logic, actionable signals, or broadening formation detection.
Clean, minimal, and faithful to the core principles of The Strat.
Chart patterns

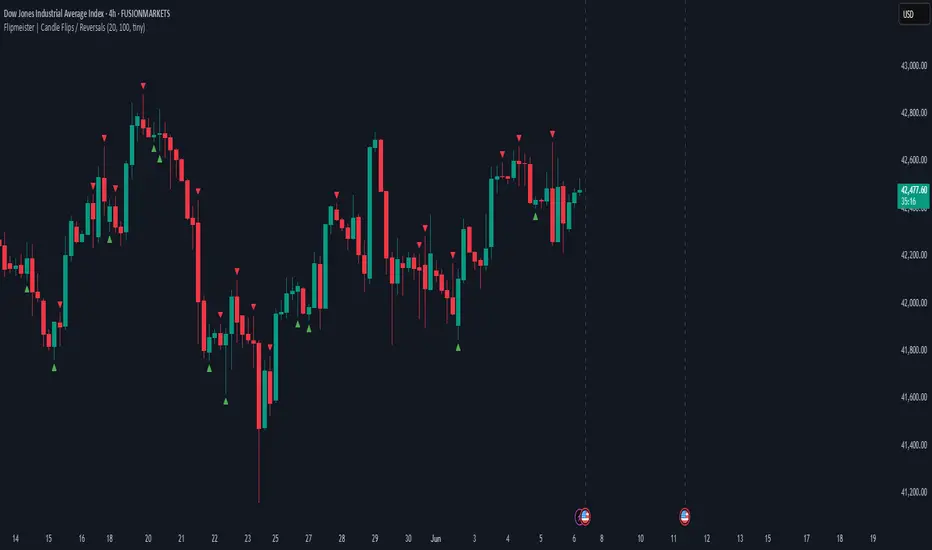
Flipmeister | Candle Flips / ReversalsOpinionated way to highlight important candle flips and can lead to trading opportunities.
- Green to Red flip needs to break previous candle's high and flip to qualify
- Red to Green flip needs to break previous candle's low and flip to qualify
You can configure:
- Min Wick Size for marker to be shown
- Max lookback in bars to limit the amount of markers on the chart
Alerts! You can setup alert conditions for any flip and it's going to notify you when it happens.
Create alert -> Condition: Flipmeister -> Function: Any Flip (or any other available condition).
Enhanced Daily Sentiment & Auction Area Trading StrategyDetermine Daily Sentiment (Anchor Chart - Daily TF):
Analyze Yesterday's Daily Candle: Look at the previous day's daily candlestick (high, low, open, close). This is the "most important information."
Establish Bias: If yesterday's candle was bullish (closed higher), the bias for today is generally long (approx. 80% of the time). If bearish, the bias is short.
Moving Average Context: Note if the daily price is above or below its short-term moving average (e.g., 21 or 50 MA). This should align with the candle's bias (e.g., bullish daily candle above its MA).
Pre-Market & Opening Analysis (Information Gathering):
Check for Gaps: Observe if the market is gapping up or down in the pre-market session relative to yesterday's close. This provides an early clue to current sentiment.
Consider Overall Sentiment: Briefly factor in relevant news or overarching market sentiment (e.g., data releases, overall market feeling from yields, gold etc.). Trading Window: Focus primarily on trading within the first hour of the U.S. market open, as this is when volatility is typically highest, which the strategy relies on.
Setup 5-Minute Chart for Execution (Trading TF - 5-min):
Apply Moving Average: Use the same short-term moving average (e.g., 21 or 50 MA) as on the daily chart.
Seek Alignment (Crucial): The 5-minute chart's trend and price action relative to its MA must align with the daily chart's bias and MA relationship.
If Daily bias is LONG (price above daily MA), the 5-minute chart should also show price establishing itself above its 5-min MA, ideally with a similar "45-degree angle" uptrend.
If Daily bias is SHORT (price below daily MA), the 5-minute chart should also show price establishing itself below its 5-min MA, with a similar downtrend. If there's no clear alignment between the daily and 5-minute chart structure/MA, do not trade.
Identify the "Auction Area" (Value/Congestion) on the 5-Minute Chart:
This is a recent area of congestion, a small support/resistance flip, or where price has paused, consolidated, and is retesting, often near the 5-minute MA.
Uptrend (Long Bias): Look for a pullback (a small "V" shape dip) towards the 5-minute MA or a recent small resistance-turned-support area. This is the "auction retest" before a potential breakout higher.
Downtrend (Short Bias): Look for a pullback rally (an inverted "V" shape) towards the 5-minute MA or a recent small support-turned-resistance area.

Gann Swing PointsIndicator Logic
This is a GANN-style swing indicator that classifies bars based on their high/low structure relative to the previous bar.
I strongly encourage you to replay bars on Tradingview using this indicator to get a sense of how it creates pivot (or swing) points
Bar Classification:
Up-Bar (direction: 'up'): Higher High and Higher Low (HH/HL)
Down-Bar (direction: 'down'): Lower High and Lower Low (LH/LL)
Outside-Bar (generates 2 directions):
Green: 'down' then 'up'
Red: 'up' then 'down'
Inside-Bar: No direction generated (HL/LH)
Swing Line Logic
The swing line continues in the current direction until n opposite directions are detected.
n is the "n-direction" parameter (commonly set to 2, so 2 consecutive opposite direction is needed to turn the swing)
When n opposing directions occur, the swing turns, creating a pivot point
Inside bar is ignored, so e.g up-bar -> inside-bar -> up-bar generates "up", "up" direction
A top pivot is formed when the swing turns down
A bottom pivot is formed when it turns up
Note: This swing logic is inherently lagging — it only confirms tops/bottoms after the fact
This swing structure gives the system a clear and noise-resistant way to identify pivot points (swing-points)

Symbol vs Benchmark Performance & Volatility TableThis tool puts the current symbol’s performance and volatility side-by-side with any benchmark —NASDAQ, S&P 500, NIFTY or a custom index of your choice.
A quick glance shows whether the stock is outperforming, lagging, or just moving with the market.
⸻
Features
• ✅ Returns over 1W, 1M, 3M, 6M, 12M
• 🔄 Benchmark comparison with optional difference row
• ⚡ Volatility snapshot (20D, 60D, or 252D)
• 🎛️ Fully customizable:
• Show/hide rows and timeframes
• Switch between default or custom benchmarks
• Pick position, size, and colors
Built to answer a simple, everyday question — “How’s this really doing compared to the broader market?”
Thanks to @BeeHolder, whose performance table originally inspired this.
Hope it makes your analysis a little easier and quicker.

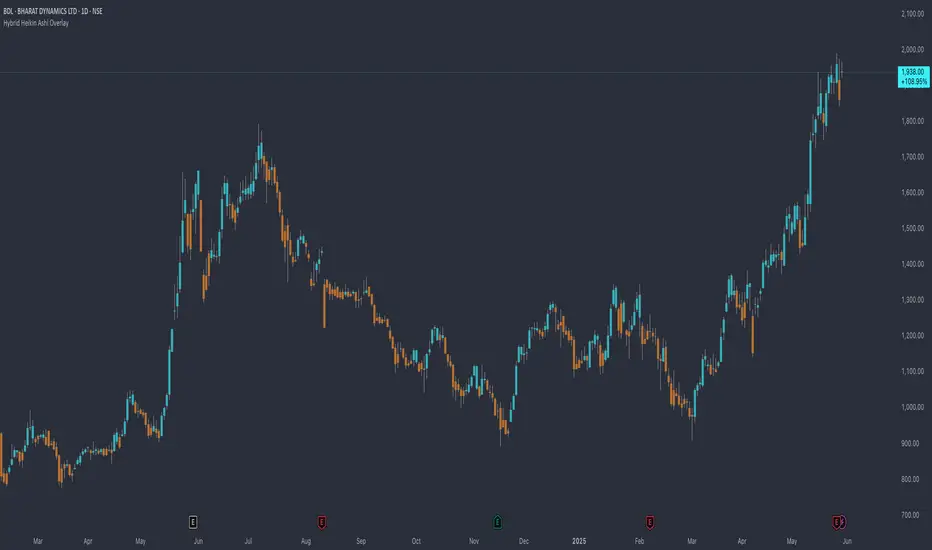
Hybrid Heikin Ashi OverlayHybrid Heikin Ashi Overlay
I personally like Heikin Ashi for its simplicity in showing clean trends. However, it tends to smooth out price action so much that we sometimes miss key signals from the actual candles.
This indicator overlays Heikin Ashi-style background colors while keeping regular candles intact — giving you the best of both worlds:
• Smoother trend visibility
• No loss of execution precision
• Customizable colors & transparency
🔹 No repainting
🔹 No strategy logic — purely visual
🔹 Designed to reduce clutter and help traders stay focused on structure
Created by: @yug_and_her
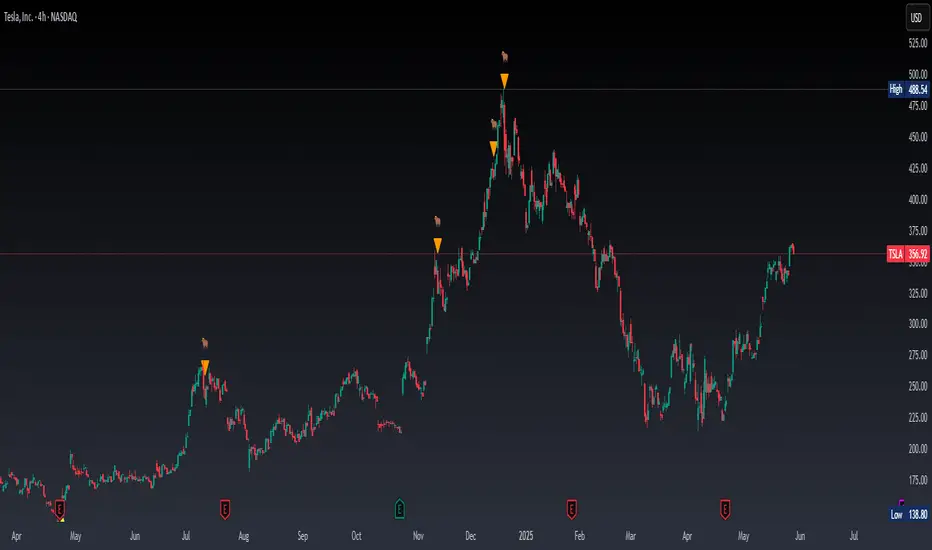
Real Time Swing Trap DetectorThe Real Time Swing Trap Detector is a minimalist, pro-grade tool for instantly spotting classic “bull traps” and “bear traps” on any chart.
This indicator identifies swing traps in real time by tracking significant swing highs and lows, then watching for fast, false breakouts (bull traps) and breakdowns (bear traps) within a user-defined window.
How it works:
Detects when price breaks a major swing high/low (using configurable lookback).
If price quickly reclaims the broken level within X bars (trap window), a trap is confirmed and a subtle icon (🐂 for bull, 🐻 for bear) is displayed on the chart—no labels, no clutter.
You can enable/disable alerts for bull/bear traps individually or together, and receive notifications the moment a trap is detected.
Use cases:
Spot and avoid classic market “fakeouts” that trap breakout traders.
Confirm SMC/ICT “Judas swing” setups, or filter for high-probability reversals.
Works on all timeframes and assets: stocks, crypto, forex, indices.
Inputs:
Swing Lookback Bars: How far back to define swing points (default: 50)
Major Swing Filter: Additional filter for only the most significant highs/lows (default: 200)
Trap Bars (Look Ahead): Window in which a trap must be confirmed (default: 10)
Enable Bull/Bear Trap Alerts: Toggle real-time alerts for each trap type.
Visuals:
🐻 icon below bar for bear trap (short squeeze/reversal)
🐂 icon above bar for bull trap (long squeeze/reversal)
How to set up alerts:
Add the indicator to your chart, open TradingView’s Alerts panel, and choose “Bear Trap Alert,” “Bull Trap Alert,” or “Any Trap Alert” for instant notifications.
Candle Breakout Oscillator [LuxAlgo]The Candle Breakout Oscillator tool allows traders to identify the strength and weakness of the three main market states: bullish, bearish, and choppy.
Know who controls the market at any given moment with an oscillator display with values ranging from 0 to 100 for the three main plots and upper and lower thresholds of 80 and 20 by default.
🔶 USAGE
The Candle Breakout Oscillator represents the three main market states, with values ranging from 0 to 100. By default, the upper and lower thresholds are set at 80 and 20, and when a value exceeds these thresholds, a colored area is displayed for the trader's convenience.
This tool is based on pure price action breakouts. In this context, we understand a breakout as a close above the last candle's high or low, which is representative of market strength. All other close positions in relation to the last candle's limits are considered weakness.
So, when the bullish plot (in green) is at the top of the oscillator (values above 80), it means that the bullish breakouts (close below the last candle low) are at their maximum value over the calculation window, indicating an uptrend. The same interpretation can be made for the bearish plot (in red), indicating a downtrend when high.
On the other hand, weakness is indicated when values are below the lower threshold (20), indicating that breakouts are at their minimum over the last 100 candles. Below are some examples of the possible main interpretations:
There are three main things to look for in this oscillator:
Value reaches extreme
Value leaves extreme
Bullish/Bearish crossovers
As we can see on the chart, before the first crossover happens the bears come out of strength (top) and the bulls come out of weakness (bottom), then after the crossover the bulls reach strength (top) and the bears weakness (bottom), this process is repeated in reverse for the second crossover.
The other main feature of the oscillator is its ability to identify periods of sideways trends when the sideways values have upper readings above 80, and trending behavior when the sideways values have lower readings below 20. As we just saw in the case of bullish vs. bearish, sideways values signal a change in behavior when reaching or leaving the extremes of the oscillator.
🔶 DETAILS
🔹 Data Smoothing
The tool offers up to 10 different smoothing methods. In the chart above, we can see the raw data (smoothing: None) and the RMA, TEMA, or Hull moving averages.
🔹 Data Weighting
Users can add different weighting methods to the data. As we can see in the image above, users can choose between None, Volume, or Price (as in Price Delta for each breakout).
🔶 SETTINGS
Window: Execution window, 100 candles by default
🔹 Data
Smoothing Method: Choose between none or ten moving averages
Smoothing Length: Length for the moving average
Weighting Method: Choose between None, Volume, or Price
🔹 Thresholds
Top: 80 by default
Bottom: 20 by default

High/Low last 1-3 candlesHere you can display the high and low of the last 1, 2 or 3 candles. The whole thing is updated with every new candle. you can also switch the lines on or off as you wish and adjust the colour of the lines. have fun with it

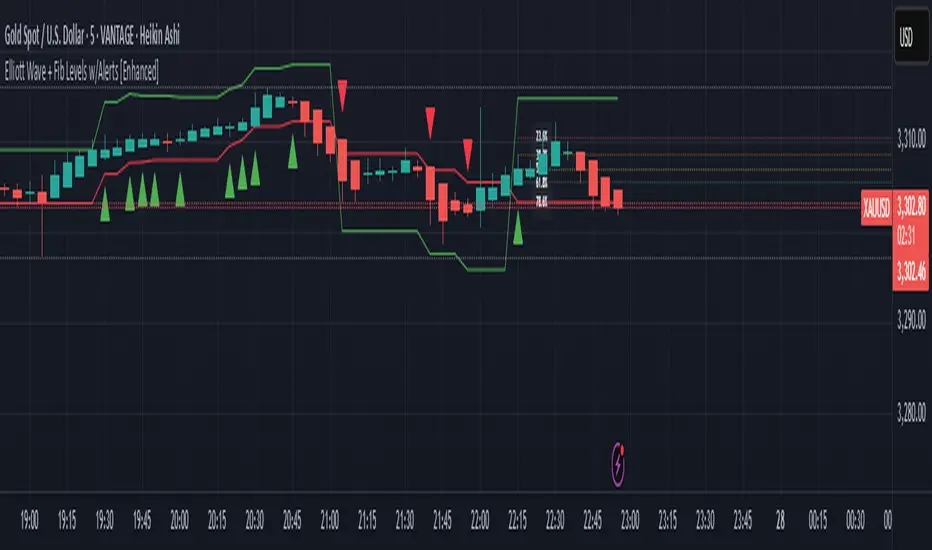
Elliott Wave + Fib Levels w/Alerts [Enhanced]Elliott Wave + Fibonacci Levels with Alerts
This powerful TradingView indicator combines Elliott Wave detection with customizable Fibonacci retracement levels to help identify key price zones and potential trade opportunities. It automatically detects bullish and bearish waves based on recent highs and lows, with an optional EMA filter to improve trend accuracy.
Key features include:
Dynamic detection of Elliott Waves based on configurable wave length.
Visualization of Fibonacci retracement levels on detected waves, with customizable percentage levels and optional labels for clarity.
ATR-based automatic calculation of stop loss and take profit levels with adjustable multipliers.
Real-time alerts triggered on new wave formations, indicating bullish or bearish setups with precise entry price details.
Clean plotting of entry signals, stop loss, and take profit zones directly on the chart.
User-friendly input controls to tailor the indicator to your trading style, including options to toggle EMA filtering, Fibonacci level display, and alert activation.
Ideal for traders looking to combine classic wave analysis with Fibonacci support/resistance levels and actionable trade alerts, this indicator streamlines technical analysis and trade management in one easy-to-use tool.
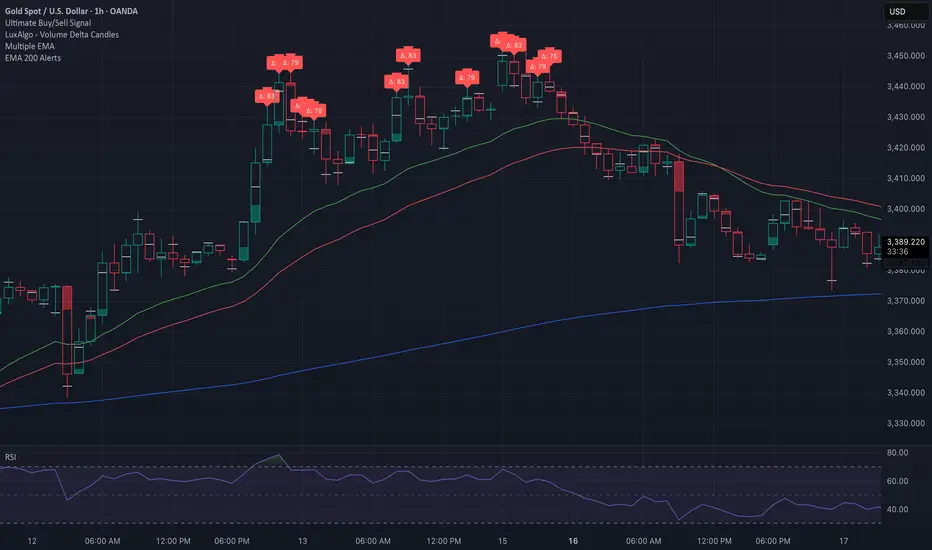
EMA 200 Price Deviation Alerts (1H Only)This script monitors the price deviation from the 200-period Exponential Moving Average (EMA) exclusively on the 1-hour chart. It generates alerts when the absolute difference between the current price and the EMA 200 exceeds a user-defined threshold (default: 65).
Features:
Works only on 1-hour (60-minute) charts to avoid false signals on other timeframes.
Customizable deviation threshold via script input.
Visual display of the 200 EMA on the chart.
Alert system to notify when price deviates significantly above or below the EMA.
Buy/Sell arrows shown when conditions are met:
Sell arrow appears when price is above the EMA and deviation exceeds threshold.
Buy arrow appears when price is below the EMA and deviation exceeds threshold.
Use this tool to identify potential overextended price moves relative to long-term trend support or resistance on the 1H timeframe.
Super Arma Institucional PRO v6.3Super Arma Institucional PRO v6.3
Description
Super Arma Institucional PRO v6.3 is a multifunctional indicator designed for traders looking for a clear and objective analysis of the market, focusing on trends, key price levels and high liquidity zones. It combines three essential elements: moving averages (EMA 20, SMA 50, EMA 200), dynamic support and resistance, and volume-based liquidity zones. This integration offers an institutional view of the market, ideal for identifying strategic entry and exit points.
How it Works
Moving Averages:
EMA 20 (orange): Sensitive to short-term movements, ideal for capturing fast trends.
SMA 50 (blue): Represents the medium-term trend, smoothing out fluctuations.
EMA 200 (red): Indicates the long-term trend, used as a reference for the general market bias.
Support and Resistance: Calculated based on the highest and lowest prices over a defined period (default: 20 bars). These dynamic levels help identify zones where the price may encounter barriers or supports.
Liquidity Zones: Purple rectangles are drawn in areas of significantly above-average volume, indicating regions where large market participants (institutional) may be active. These zones are useful for anticipating price movements or order absorption.
Purpose
The indicator was developed to provide a clean and institutional view of the market, combining classic tools (moving averages and support/resistance) with modern liquidity analysis. It is ideal for traders operating swing trading or position trading strategies, allowing to identify:
Short, medium and long-term trends.
Key support and resistance levels to plan entries and exits.
High liquidity zones where institutional orders can influence the price.
Settings
Show EMA 20 (true): Enables/disables the 20-period EMA.
Show SMA 50 (true): Enables/disables the 50-period SMA.
Show EMA 200 (true): Enables/disables the 200-period EMA.
Support/Resistance Period (20): Sets the period for calculating support and resistance levels.
Liquidity Sensitivity (20): Period for calculating the average volume.
Minimum Liquidity Factor (1.5): Multiplier of the average volume to identify high liquidity zones.
How to Use
Moving Averages:
Crossovers between the EMA 20 and SMA 50 may indicate short/medium-term trend changes.
The EMA 200 serves as a reference for the long-term bias (above = bullish, below = bearish).
Support and Resistance: Use the red (resistance) and green (support) lines to identify reversal or consolidation zones.
Liquidity Zones: The purple rectangles highlight areas of high volume, where the price may react (reversal or breakout). Consider these zones to place orders or manage risks.
Adjust the parameters according to the asset and timeframe to optimize the analysis.
Notes
The chart should be configured only with this indicator to ensure clarity.
Use on timeframes such as 1 hour, 4 hours or daily for better visualization of liquidity zones and support/resistance levels.
Avoid adding other indicators to the chart to keep the script output easily identifiable.
The indicator is designed to be clean, without explicit buy/sell signals, following an institutional approach.
This indicator is perfect for traders who want a visually clear and powerful tool to trade based on trends, key levels and institutional behavior.

MestreDoFOMO MACD VisualMasterDoFOMO MACD Visual
Description
MasterDoFOMO MACD Visual is a custom indicator that combines a unique approach to MACD with stochastic logic and simulated Renko-based direction signals. It is designed to help traders identify entry and exit opportunities based on market momentum and trend changes, with a clear and intuitive visualization.
How It Works
Stylized MACD with Stochastic: The indicator calculates the MACD using EMAs (exponential moving averages) normalized by stochastic logic. This is done by subtracting the lowest price (lowest low) from a defined period and dividing by the range between the highest and lowest price (highest high - lowest low). The result is a MACD that is more sensitive to market conditions, magnified by a factor of 10 for better visualization.
Signal Line: An EMA of the MACD is plotted as a signal line, allowing you to identify crossovers that indicate potential trend reversals or continuations.
Histogram: The difference between the MACD and the signal line is displayed as a histogram, with distinct colors (fuchsia for positive, purple for negative) to make momentum easier to read.
Simulated Renko Direction: Uses ATR (Average True Range) to calculate the size of Renko "bricks", generating signals of change in direction (bullish or bearish). These signals are displayed as arrows on the chart, helping to identify trend reversals.
Purpose
The indicator combines the sensitivity of the Stochastic MACD with the robustness of Renko signals to provide a versatile tool. It is ideal for traders looking to capture momentum-based market movements (using the MACD and histogram) while confirming trend changes with Renko signals. This combination reduces false signals and improves accuracy in volatile markets.
Settings
Stochastic Period (45): Sets the period for calculating the Stochastic range (highest high - lowest low).
Fast EMA Period (12): Period of the fast EMA used in the MACD.
Slow EMA Period (26): Period of the slow EMA used in the MACD.
Signal Line Period (9): Period of the EMA of the signal line.
Overbought/Oversold Levels (1.0/-1.0): Thresholds for identifying extreme conditions in the MACD.
ATR Period (14): Period for calculating the Renko brick size.
ATR Multiplier (1.0): Adjusts the Renko brick size.
Show Histogram: Enables/disables the histogram.
Show Renko Markers: Enables/disables the Renko direction arrows.
How to Use
MACD Crossovers: A MACD crossover above the signal line indicates potential bullishness, while below suggests bearishness.
Histogram: Fuchsia bars indicate bullish momentum; purple bars indicate bearish momentum.
Renko Arrows: Green arrows (upward triangle) signal a change to an uptrend; red arrows (downward triangle) signal a downtrend.
Overbought/Oversold Levels: Use the levels to identify potential reversals when the MACD reaches extreme values.
Notes
The chart should be set up with this indicator in isolation for better clarity.
Adjust the periods and ATR multiplier according to the asset and timeframe used.
Use the built-in alerts ("Renko Up Signal" and "Renko Down Signal") to set up notifications of direction changes.
This indicator is ideal for day traders and swing traders who want a visually clear and functional tool for trading based on momentum and trends.

Pin Bar Highlighter OnlyAbsolutely — here’s a full **description and breakdown** of what the script does:
---
## 📜 Script Name:
**"Pin Bar Highlighter Only"**
---
## 🎯 Purpose:
This script **detects and highlights classic pin bar reversal candles** directly on the chart — without plotting any entry, stop loss, or take profit levels.
It’s designed for traders who:
* Want to manually assess trades
* Prefer a clean chart
* Use pin bar price action as a signal for potential reversals
---
## ✅ What It Does:
* **Scans each candle** to check if it qualifies as a **bullish** or **bearish pin bar**
* If valid:
* Plots a **green triangle below** bullish pin bars
* Plots a **red triangle above** bearish pin bars
* Keeps your chart **minimal and uncluttered**
---
## 📌 How It Detects a Pin Bar:
### 🔹 1. Candle Structure:
* Measures the total candle range: `high - low`
* Calculates the **body size**: `abs(close - open)`
* Calculates the **upper and lower wick sizes**
### 🔹 2. Pin Bar Criteria:
* The **wick (nose)** must be at least **2/3 of the total candle length**
* The **body** must be small — **≤ 1/3** of the total range
* The **body** must be located at **one end** of the candle
* The wick must **pierce the high/low** of the previous candle
---
## 📍 Bullish Pin Bar Requirements:
* Close > Open (green candle)
* Lower wick ≥ 66% of candle range
* Body ≤ 33% of range
* Candle **makes a new low** (current low < previous low)
### 📍 Bearish Pin Bar Requirements:
* Close < Open (red candle)
* Upper wick ≥ 66% of candle range
* Body ≤ 33% of range
* Candle **makes a new high** (current high > previous high)
---
## 🖼️ Visual Output:
* 🔻 Red triangle **above** bearish pin bars
* 🔺 Green triangle **below** bullish pin bars
---
## 🛠️ Example Use Cases:
* Identify **reversal points** at support/resistance
* Confirm signals with **VWAP**, supply/demand zones, or AVWAP (manually plotted)
* Use in **conjunction with other strategies** — without clutter
---
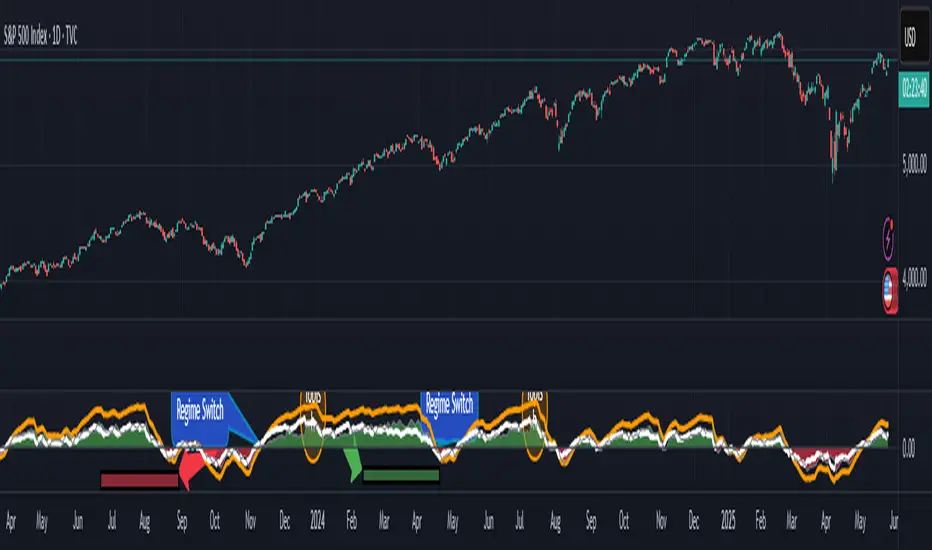
RSI.TrendContext
The Relative Strength Index (RSI) is one of the most widely used classical indicators in technical analysis, typically employed to identify overbought or oversold market conditions. It reflects the degree of upside or downside dominance within a specified period. However, in its standard form, RSI is not particularly effective as a standalone entry trigger.
The RSI.Trend indicator enhances the RSI to provide a more reliable method for distinguishing between bullish and bearish market regimes and offers specific entry triggers. It adds supplementary value to the pure RSI read.________________________________________
Concept
In trending markets, an Exponential Moving Average (EMA) of the price is often smoother and more stable than raw price data. As a result, the RSI calculated on this smoothed price (i.e., the EMA) tends to react earlier and more consistently than the standard RSI. Specifically:
• In uptrends, the RSI of the EMA tends to exceed the RSI of the original price.
• In downtrends, it tends to lag behind.
The difference between these two RSI readings provides a stable and less noisy measure of market bias—positive in uptrends, negative in downtrends. The crossing points can serve as entry triggers. This is, what the RSI.Trend is trying to capture.
________________________________________
The RSI.Trend indicator operates as follows:
• It first computes the 5-period EMA of the price series of the underlying ("EMA5").
• It calculates the 14-period RSI of the original price series ("RSI") as well as the 14-period RSI of EMA5 ("RSIEMA").
• It then determines the 14-period EMA of RSI ("RSI.MA") and RSIEMA ("RSIEMA.MA").
These values are used to define a Baseline and a Trigger Line:
• Baseline: The average of RSI and RSI.MA.
• Trigger Line: The average of RSIEMA and RSIEMA.MA.
Essentially, the baseline represents a smoother version of the RSI of the original price series, while the trigger line is a smoother version of the RSI on the EMA5 of the original price series.
Additionally, the RSI.Trend Background Value is calculated as the difference between the Trigger Line and the Baseline, slightly accelerated by incorporating the current bias of this difference. This acceleration causes the Background Value to react somewhat faster than the pure difference between the two lines.
How to use the RSI.Trend:
• As mentioned in the introductory context, during uptrends, the trigger line remains above the baseline; in downtrends, it stays below the baseline.
• A crossover of the baseline by the trigger line indicates a regime shift from bearish to bullish and can signal avoiding adding short positions, closing short positions, or adding long positions.
• A crossunder of the baseline by the trigger line indicates a regime shift from bullish to bearish and can signal avoiding adding long positions, closing long positions, or adding short positions.
• The level of the Trigger Line can serve as a confidence indicator; for instance, if the trigger line crosses under the baseline coming from very high values, it implies high confidence.
• The Background Value indicates the accelerated difference between the two lines:
o > 0 (Green background): Indicates a Bullish regime.
o < 0 (Red background): Indicates a Bearish regime.
The Background Value reacts slightly faster than line crossings due to its acceleration relative to the difference of the two lines.
Including these lines in the script besides the Background Value, provides insight into their levels and their origins, aiding in formulating confidence in an entry trigger, which the background value alone cannot provide. The change in slope of the trigger Line can also be used as an early and fast position-trigger.
Finally, the Background Value can be utilized in continuous trading scenarios (i.e., no entry points, always engaged) as a multiplier on a predefined max-exposure value, representing the current exposure as a fraction of that max-exposure.
The usage of RSI.Trend is also exemplified in the introductory chart.________________________________________
Final Notes
As with all indicators, the RSI.Trend is most effective when used in conjunction with other technical tools and market context. It does not predict future price movements; rather, it reflects current market dynamics and recent directional tendencies. Use it with discretion and as part of a broader trading strategy.
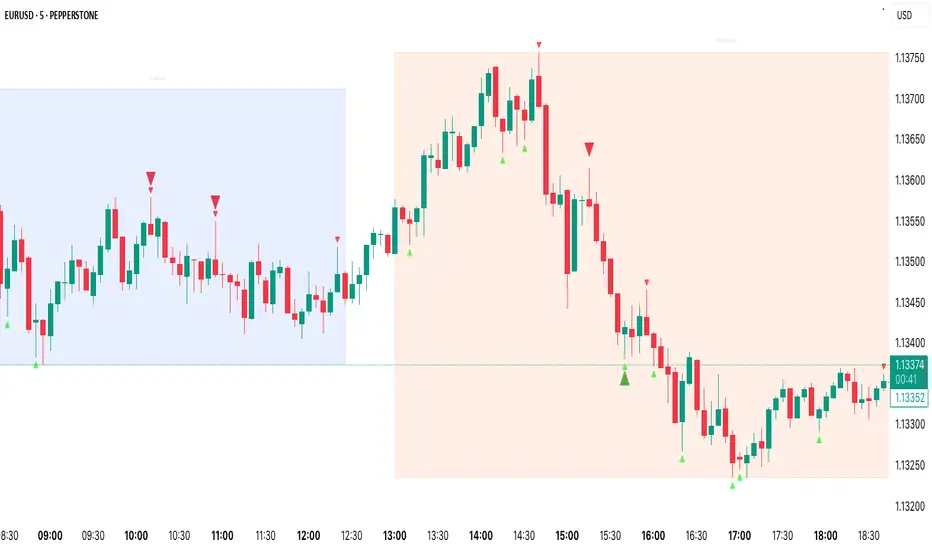
Auto FaustAuto Faust – Intraday Market Context & Structure
Auto Faust is a visual market overlay designed for intraday traders who want fast context without relying on signals or automation. It combines classic price tools — VWAP, EMAs, RSI, Chop Score, and market structure trendlines — into a single glanceable dashboard.
🔍 What It Does:
VWAP (Volume Weighted Average Price): Shows the day's fair value price anchor.
EMAs (3, 21, 113, 200): Map short-term to long-term trend alignment. Crossovers can be used for confluence or caution.
RSI (10): Monitors local momentum. Displayed in a compact table.
Chop Score: Measures how directional price action is. High chop = ranging conditions; low = trending.
Session High/Low Tracker: Tracks the daily extremes in real-time.
Volume Monitor: Shows current candle volume, color-coded vs previous bar (green = higher, red = lower).
Dynamic Support & Resistance Lines: Plotted from pivot highs/lows (not static levels).
Automatic Trendlines: Drawn from swing structure, updating live.
📊 How to Use:
Use EMAs + VWAP alignment to assess directional bias.
Confirm clean trends with low Chop Score and RSI support.
Watch for price interaction around dynamic S/R lines and trendline breaks.
Use volume coloring to assess if momentum is increasing or fading.
No buy/sell signals are generated — this is a trader-facing tool to guide discretionary decision-making.

MTF Candle Direction Forecast + Breakdown🧭 MTF Candle Direction Forecast + Breakdown 🔥📈🔼
This script is a multi-timeframe (MTF) price action dashboard that helps traders assess real-time directional bias across five customizable timeframes — with a focus on candle behavior, trend alignment, and confidence strength.
📌 What It Does
For each timeframe, this dashboard summarizes:
Current direction → Bullish, Bearish, or Neutral
Confidence score (0–100) → How strongly price is likely to continue in that direction
Candle strength → 🔥 icon appears if the current candle has a large body relative to its range
Trend alignment:
📈 = EMA9 is above EMA20
🔼 = Price is above VWAP
Color-coded background to visually reinforce directional state
Each row gives you a visual “at-a-glance” readout of what price is doing right now — not in the past.
💡 Why It’s Useful
✅ Direction forecasting based on price action
Instead of lagging indicators, this script prioritizes:
Candle body-to-range ratio (momentum)
Real-time VWAP/EMA structure
Immediate price positioning
✅ Confidence is quantified
The score (0–100) helps you judge how reliable each directional signal is:
90+ → Strong conviction
50–70 → Mixed but potentially valid
<40 → Weak move or early signal
✅ Timeframe confluence at a glance
See whether multiple timeframes are aligning directionally — helpful for scalping, day trading, or waiting for multi-timeframe breakout setups.
✅ Visual & intuitive
Icons, colors, and layout make it easy to scan your dashboard instead of deciphering charts or code.
🛠️ Adjustable Settings
Setting Description
Timeframe 1–5 Choose any timeframes to monitor (e.g., 5m, 15m, 1h, 4h)
Candle Display Mode Show trend color via emoji (🟢/🔴) or background shading
Strong Candle Threshold Adjust the body-to-range % needed to trigger 🔥 strength
Bullish/Bearish Background Customize label color coding
Neutral Background (opacity) Set transparency or styling for flat/consolidating zones
Table Location Place the dashboard anywhere on the chart
🎯 Use Cases
Scalpers: Confirm trend across 1m/5m/15m before entering
Day Traders: Use confidence score to avoid low-momentum setups
Swing Traders: Monitor higher timeframes for trend shifts while tracking intraday noise
VWAP/EMA traders: Quickly see when price is reclaiming or losing critical trend levels
🧠 What Makes It Unique?
Unlike generic trend meters or mashups of standard indicators, this script:
Uses live candle dynamics (not just closes or lagging values)
Computes directional bias and confidence together
Visualizes strength and structure in a compact, readable interface
Let’s you filter by price action, not just indicator alignment
💥 Why Traders Love Will Love It
✅ Instant clarity on which timeframes agree
✅ No more guessing candle strength or trend health
✅ Confidence score keeps you out of weak trades
✅ Works with any strategy — trend following, VWAP reclaim, EMA scalps, even breakouts
✅ Keeps your chart clean — all the context, none of the clutter
⚠️ Transparency🧬 Under the Hood
Powered by live candle body analysis, trend structure (EMA9 vs EMA20), and VWAP placement.
All scores are generated in real-time — No repainting or lookahead bias: all values are computed with lookahead=barmerge.lookahead_on
Confidence scores reflect the current candle only — they do not predict future moves but measure momentum and alignment in real-time
Labels update per bar and respond to subtle shifts in candle structure and trend indicators
✅ MTF Trend Snapshot (Live Output Example Shown in Chart Above)
This dashboard gives you a fast, visual summary of market trend and momentum across 5 timeframes. Here's what it's telling you right now:
🕔 5 Minute (5m)
📉 EMA Trend: Down
🔼 Price: Above VWAP
Direction: Bearish (42)
🟥 Weak bearish bias. Short-term pullback against a stronger trend. Use caution — lower confidence and mixed structure.
⏱️ 15 Minute (15m)
📈 EMA Trend: Up
🔼 Price: Above VWAP
Direction: Bullish (73)
🟩 Clean bullish structure with growing momentum. Solid for intraday confirmation.
🕧 30 Minute (30m)
📈 EMA Trend: Up
🔼 Price: Above VWAP
Direction: Bullish (77)
🟩 Stronger trend forming. Above VWAP and EMAs — building conviction.
🕐 1 Hour (1h)
📈 EMA Trend: Up
🔼 Price: Above VWAP
Direction: Bullish (70)
🟩 Confident, clean trend. Good alignment across indicators. Ideal timeframe for swing entries.
🕓 4 Hour (4h)
🔥 Strong Candle
📈 EMA Trend: Up
🔼 Price: Above VWAP
Direction: Bullish (100)
🟩 Full trend alignment with max momentum. Strong body candle + structure — high confidence continuation.
🧠 Quick Takeaway
🔻 5m is pulling back short term
✅ 15m through 4h are fully aligned Bullish
🔥 4h has max confidence — big-picture trend is intact
📈 Ideal setup for momentum traders looking to ride trend with multi-timeframe confirmation
Try pinning this dashboard to your chart during live trading to read price like a story across timeframes, and filter out weak setups with low-confidence noise.

Liquidity LinesLiquidity Lines Indicator
This advanced TradingView indicator identifies key liquidity zones on your price chart by detecting bullish and bearish engulfing candles, which often signify areas where liquidity accumulates. It helps traders visually spot potential support and resistance levels created by market participants’ stop-loss orders or pending orders.
Key Features :
-Aggregated Bars Option : Smooth out price data by grouping bars together, enabling clearer liquidity zone identification on higher timeframes or noisy charts.
-Upper Liquidity Lines : Displays dashed lines at recent highs where bearish engulfing patterns indicate potential resistance or supply zones.
-Lower Liquidity Lines : Displays dashed lines at recent lows where bullish engulfing patterns suggest potential support or demand zones.
-Customizable Colors : Choose your preferred colors for bullish (default black) and bearish (default white) liquidity lines for better visual distinction.
-Automatic Line Cleanup : Maintains chart clarity by automatically removing old liquidity lines after a configurable limit.
-Dynamic Alerts : Trigger alerts when price breaches upper or lower liquidity lines, signaling potential breakout or reversal opportunities.
Use Cases :

Hammer + EMA Strategy with Tick-based SL/TPWhat This Script Does:
Detects Hammer (bullish reversal) and Inverted Hammer (bearish reversal) patterns
Requires a simple trend context (using 2 bars back)
Confirms price position relative to EMA 50
Applies tick-based SL and TP
Plots buy/sell signals on chart with emoji labels

Algo Structure [ValiantTrader_]Explanation of the "Algo Structure" Trading Indicator
This Pine Script indicator, created by ValiantTrader_, is a multi-timeframe swing analysis tool that helps traders identify key price levels and market structure across different timeframes. Here's how it works and how traders can use it:
Core Components
1. Multi-Timeframe Swing Analysis
The indicator tracks swing highs and lows across:
The current chart timeframe
A higher timeframe (weekly by default)
An even higher timeframe (monthly by default)
2. Swing Detection Logic
Current timeframe swings: Identified when price makes a 3-bar high/low pattern
Higher timeframe swings: Uses the highest high/lowest low of the last 3 bars on those timeframes
3. Visual Elements
Horizontal lines marking swing points
Labels showing the timeframe and percentage distance from current price
An information table summarizing key levels
How Traders Use This Indicator
1. Identifying Key Levels
The indicator draws recent swing highs (red) and swing lows (green)
These levels act as potential support/resistance areas
Traders watch for price reactions at these levels
2. Multi-Timeframe Analysis
By seeing swings from higher timeframes (weekly, monthly), traders can:
Identify more significant support/resistance zones
Understand the broader market context
Spot confluence areas where multiple timeframes align
3. Measuring Price Distance
The percentage display shows how far current price is from each swing level
Helps assess potential reward/risk at current levels
Shows volatility between swings (wider % = more volatile moves)
4. Table Summary
The info table provides a quick reference for:
Exact price levels of swings
Percentage ranges between highs and lows
Comparison across timeframes
5. Trading Applications
Breakout trading: When price moves beyond a swing high/low
Mean reversion: Trading bounces between swing levels
Trend confirmation: Higher highs/lows in multiple timeframes confirm trends
Support/resistance trading: Entering trades at swing levels with other confirmation
Customization Options
Traders can adjust:
The higher timeframes analyzed
Whether to show the timeframe labels
Whether to display swing levels
Whether to show the info table
The indicator also includes price alerts for new swing highs/lows on the current timeframe, allowing traders to get notifications when market structure changes.
This tool is particularly valuable for traders who incorporate multi-timeframe analysis into their strategy, helping them visualize important price levels across different time perspectives

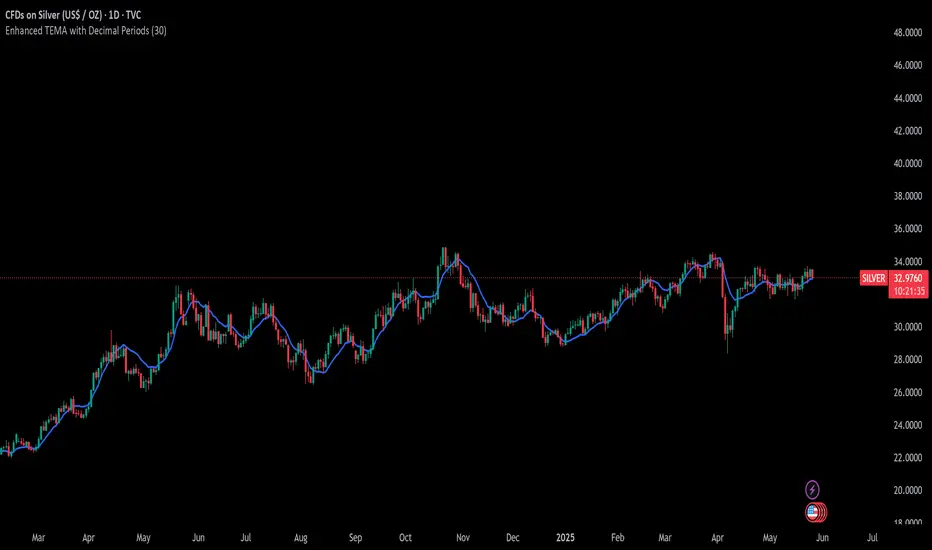
Enhanced TEMA with Decimal PeriodsImagine you have a special type of moving average line called a TEMA (Triple
Moving Average). A TEMA is designed to be even quicker to react to price changes than a regular EMA (Exponential Moving Average), helping traders spot trends faster.
What this script does:
Super-Precise TEMA Length:
Normally, when you set the "length" or "period" for a moving average, you use whole numbers (like 10 days, 20 days).
This script lets you be more precise and use decimal numbers for the TEMA's length (like 26.0 days, or even 26.7 days). This allows for very fine-tuning.
How it gets the "Decimal" EMA part (if you choose to use it):
If you want a TEMA with a length of, say, 26.7:
The script first needs to calculate EMAs with a length of 26.7.
To do this, it cleverly calculates two regular EMAs: one with a length of 26 and another with a length of 27 (the whole numbers just below and above 26.7).
Then, it blends these two EMAs. Since 26.7 is closer to 27, it takes more from the "27-period EMA" and a bit less from the "26-period EMA." This mix gives you an EMA that acts like it has a 26.7 period.
Building the TEMA:
A TEMA isn't just one EMA. It's made by taking an EMA of an EMA, and then an EMA of that. It's like smoothing the line multiple times, but in a special mathematical way to make it faster.
So, this script:
-Calculates the first "decimal EMA" (e.g., for 26.7).
-Calculates another "decimal EMA" of that first EMA line (again, using 26.7).
-Calculates a third "decimal EMA" of the second EMA line (still using 26.7).
Finally, it combines these three EMAs using a special TEMA formula to get the final, quick-reacting TEMA line.
Option to Switch Off Decimals:
There's a setting ("Use Decimal Periods"). If you turn this off, the script will just use regular whole-number EMAs to build the TEMA (it will round down your decimal input, so 26.7 would become 26).
Plotting:
The final "Enhanced TEMA" line is drawn on your price chart.
In Simple Terms:
This script gives you a TEMA (a fast-moving average) that you can set up with very precise decimal lengths (like 26.7 instead of just 26 or 27).
It does this "decimal magic" by smartly blending two regular EMAs. You can also choose to use it like a normal TEMA with whole numbers if you prefer. The goal is to give traders a very responsive trend-following line that can be fine-tuned to a high degree of precision.
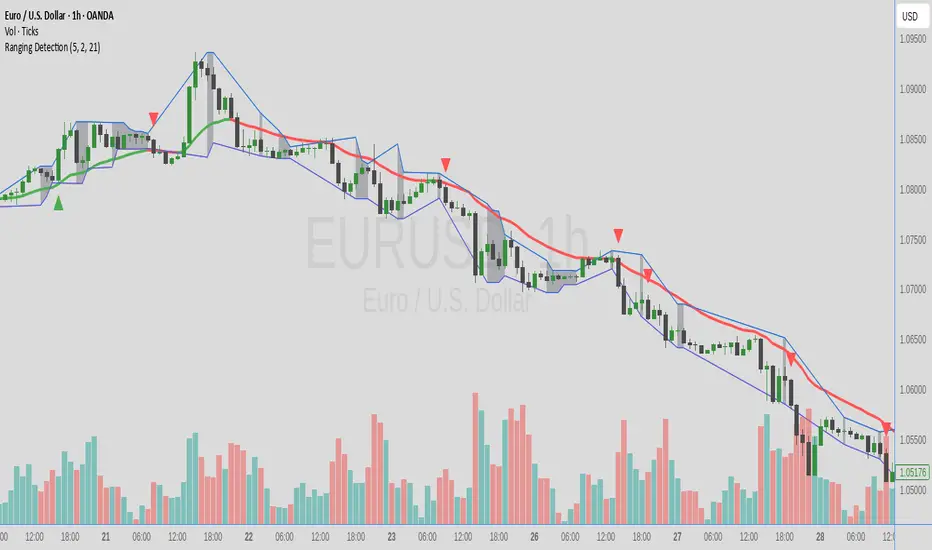
Ranging DetectionRange detection study v 0.1
Trying to find ranges on price charts. looking at H1 on EURUSD, the indicator will mark a line at the low and high of the last 10 candles, and mark the background grey if it detects a range - defined by how many candles since last high/low (default 3)
EMA 9/21 Cross + Volume FilterThis indicator plots fast (9-period) and slow (21-period) EMAs and highlights bullish or bearish crossovers only when volume exceeds its 20-period average, filtering out low-participation whipsaws. It places “UP”/“DN” triangles on qualifying crosses and includes built-in alertcondition() triggers plus a single alert() call, so one “Any alert() function call” alert delivers real-time push, e-mail, or webhook notifications. Adjustable inputs: EMA lengths, volume-SMA length, and a toggle to show/hide signal labels. Ideal for trend-following scalps or swing entries on any timeframe and ticker.
