Simple Daily OpenDisplays the daily open line, simple as that.
The line is drawn from the opening price of the first bar of the day. There is an option to choose the color, line style, and thickness.
Chart patterns

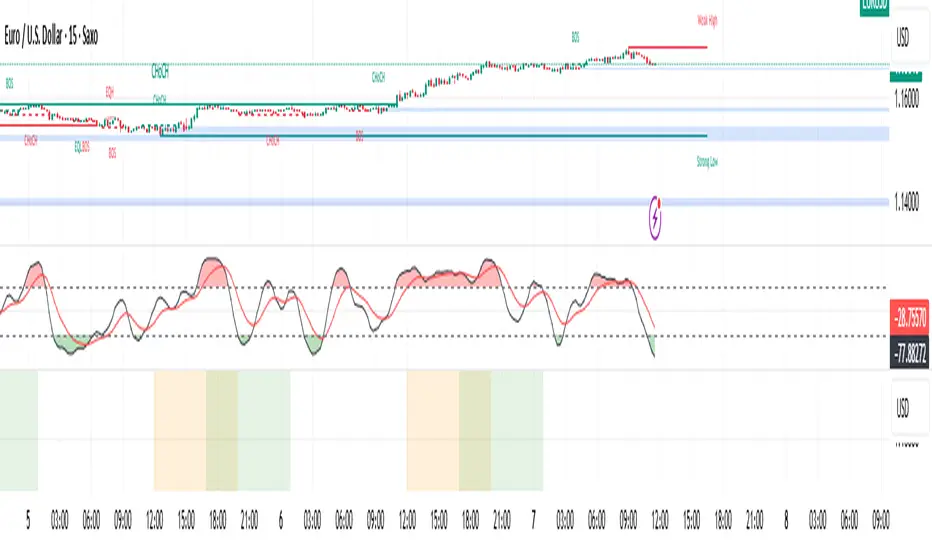
支撑和阻力|偏离ema200支撑与阻力:结合 EMA200 的偏离逻辑
在技术分析中,支撑位(价格下跌时的潜在止跌点)与阻力位(价格上涨时的潜在承压点)的有效性,常可通过与 EMA200(200 周期指数移动平均线)的偏离程度来验证 ——EMA200 作为反映中长期趋势的 “市场平均成本线”,其与价格的偏离幅度既能揭示趋势强度,也能提示支撑 / 阻力的潜在反转节点。
一、支撑位与 EMA200 的偏离
当价格处于中长期上升趋势(EMA200 向上倾斜)时:
正常偏离:价格回调至 EMA200 附近(偏离幅度≤5%),此时 EMA200 往往成为强支撑 —— 因中长期多头成本集中于此,买盘力量易在此处聚集,形成 “趋势回踩确认” 的支撑逻辑。
过度偏离(向下):价格大幅跌破 EMA200,且偏离幅度超过 10%(如股价较 EMA200 低 15%),说明短期抛压远超中长期多头承接力,原上升趋势可能松动。此时若在低位出现止跌 K 线(如锤子线、看涨吞没),且后续价格反弹向 EMA200 靠拢,该低位可能形成 “超跌后的弱势支撑”,但需警惕趋势反转风险。
在下降趋势中,EMA200 向下倾斜,价格反弹至 EMA200 附近时,常因中长期空头压制形成阻力,但若价格短暂突破后又快速回落,EMA200 反而会成为 “反弹的强阻力位”,此时价格与 EMA200 的正向偏离(如价格高于 EMA2005%)往往是短期反弹衰竭的信号。
【广告】
币圈/虚拟货币/量化策略名称:盯盘狗
1️⃣ 策略说明:
🔍 原理:
通过监控 200 多个币种,当有条件的开仓信号出现时自动开仓;
若止损,则下一次双倍开仓,循环执行直到止盈;
最大战绩:
三天收益 133%
八天收益 242%
十七天收益 553% 🚀
✅ 优点:
自动开仓 + 自动止盈止损
胜率高达 80%
联系v:rggboom,拉群
地址:https://github.com/Maikefee/DingPanDog
----------
Support and Resistance: Combining the Deviation Logic of EMA200
In technical analysis, the effectiveness of support levels (potential stop points when prices fall) and resistance levels (potential pressure points when prices rise) can often be verified by the degree of deviation from EMA200 (200 cycle index moving average) - EMA200, as a "market average cost line" reflecting medium and long-term trends, can not only reveal trend strength but also indicate potential reversal points of support/resistance.
1、 Deviation between support level and EMA200
When the price is in a medium to long-term upward trend (EMA200 tilting upwards):
Normal deviation: The price rebounds to around EMA200 (deviation margin ≤ 5%), at which point EMA200 often becomes strong support - because the cost of long positions in the medium and long term is concentrated here, buying forces are prone to gather here, forming a support logic of "trend retracement confirmation".
Excessive deviation (downward): If the price drops significantly below EMA200 and deviates by more than 10% (such as a 15% decrease in stock price compared to EMA200), it indicates that short-term selling pressure far exceeds the long-term bullish carrying capacity, and the original upward trend may loosen. If a stop falling candlestick appears at a low level (such as a hammer line or a bullish swallow), and the subsequent price rebound approaches EMA200, this low level may form a "weak support after oversold", but caution should be exercised against the risk of trend reversal.
In the downward trend, EMA200 tilts downwards, and when the price rebounds to around EMA200, resistance is often formed due to the suppression of short positions in the medium and long term. However, if the price briefly breaks through and then quickly falls back, EMA200 will become a "strong resistance level for rebound". At this time, the positive deviation of the price from EMA200 (such as a price higher than EMA2005%) is often a signal of short-term rebound failure.
Coin Circle/Virtual Currency/Quantitative Strategy Name: Watch Dog
one ️⃣ Strategy Description:
🔍 Principle:
By monitoring over 200 currencies and automatically opening positions when conditional opening signals appear;
If the stop loss occurs, the next double opening will be executed in a loop until the profit is taken;
Maximum record:
Three day profit of 133%
Eight day return of 242%
17 day return of 553% 🚀
✅ advantage:
Automatic opening+automatic take profit and stop loss
The winning rate is as high as 80%
Contact v: rggboom, join the group
Address: github.com

Multi-Signal Entry V1Multi‑Signal Entry v1 – (clean, versioned for tracking changes)
SQQQ Entry Scanner – (specific to your use case)
TQQQ/SQQQ Buy Alert – (clear that it’s for both sides if you add short logic later)
VWAP RSI ATR Vol Spike – (great if you want a technical name showing what’s used)
Fast Entry Signal Bot – (if you want a simple, trading-friendly name)

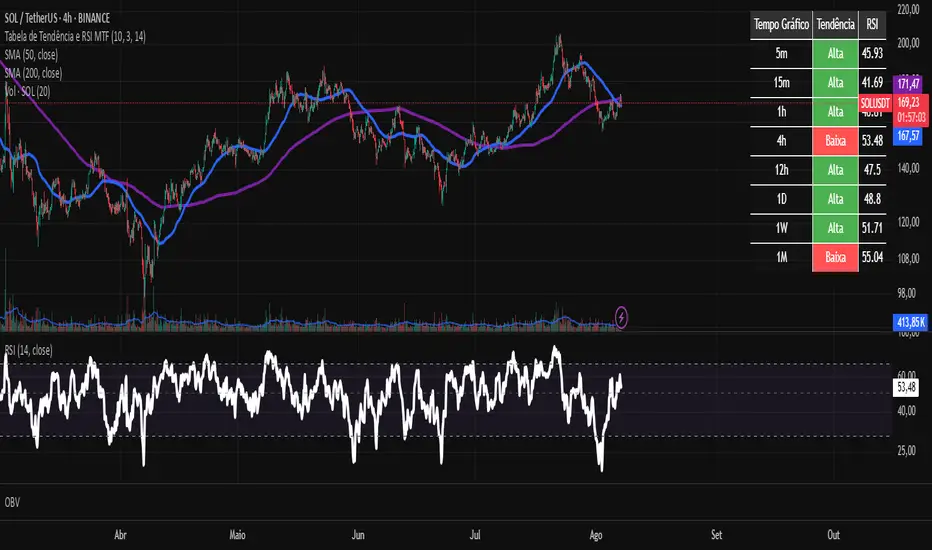
Tabela de Tendência e RSI MTF - PCThis custom TradingView indicator provides a consolidated view of trend and Relative Strength Index (RSI) across multiple timeframes, all within an intuitive table directly on your chart. Designed for traders seeking quick and efficient analysis of market momentum and direction across different time horizons, this indicator automatically adapts to the asset you are currently viewing.
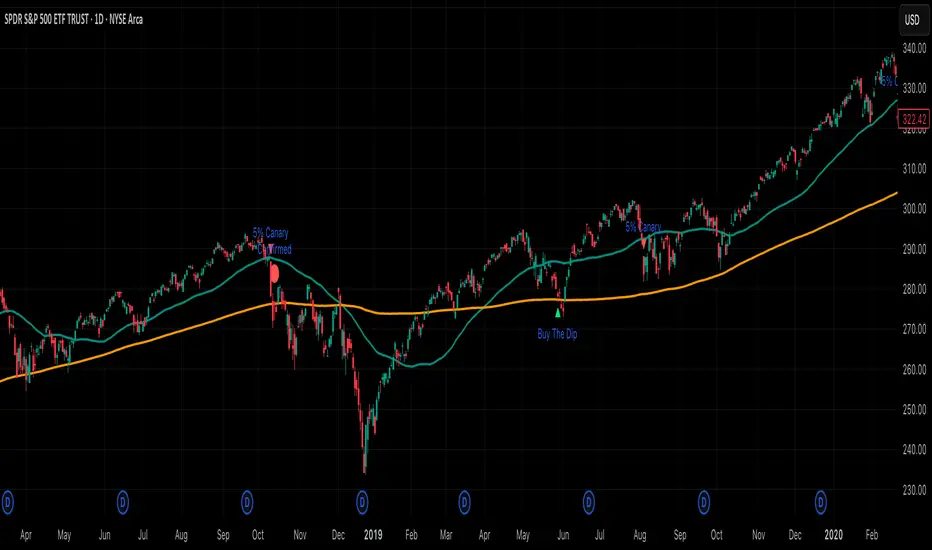
5% Canary (per Thrasher) Implements Thrasher’s framework using closing prices and simple, non-optimized thresholds. The study watches for the first 5% decline from the latest 52-week closing high and classifies it:
• 5% Canary: drop occurs in ≤ 15 trading days.
• Confirmed 5% Canary: within 42 trading days of a Canary, there are two consecutive closes below the 200-DMA.
• Buy-the-Dip: the first 5% decline takes > 15 days and 50-DMA > 200-DMA (uptrend).
Includes optional 50/200-DMA plots, clutter-reduction, and alert conditions. This is a signal framework, not a standalone system—pair with your own risk management.
Volume Breakout Candle Signals(Mastersinnifty)Description
The Volume Breakout Candle Signals indicator highlights price candles that occur with unusually high volume compared to recent history. By combining a moving average of volume with a user-defined breakout multiplier, it identifies bullish and bearish breakout candles and marks them directly on the chart.
How It Works
Calculates a Simple Moving Average (SMA) of volume over a user-selected period.
Compares current bar volume to the SMA multiplied by a breakout factor.
Flags candles as:
• Bullish breakout if volume is high and the candle closes higher than it opened.
• Bearish breakout if volume is high and the candle closes lower than it opened.
Marks breakout points with visual labels and background highlights for quick identification.
Inputs
Volume MA Length – Period for calculating the moving average of volume.
Breakout Multiplier – Factor above the average volume to qualify as a breakout.
Show Bullish Signals – Toggle bullish breakout labels.
Show Bearish Signals – Toggle bearish breakout labels.
Use Case
Identify potential breakout opportunities driven by significant market participation.
Spot volume surges that may precede trend continuation or reversals.
Combine with price action or other indicators for confirmation.
Useful for intraday scalping, swing trading, and breakout strategies.
Disclaimer
This tool is intended for educational purposes only and should not be considered financial advice. Trading involves risk, and past performance is not indicative of future results. Always perform your own analysis before making any trading decisions.

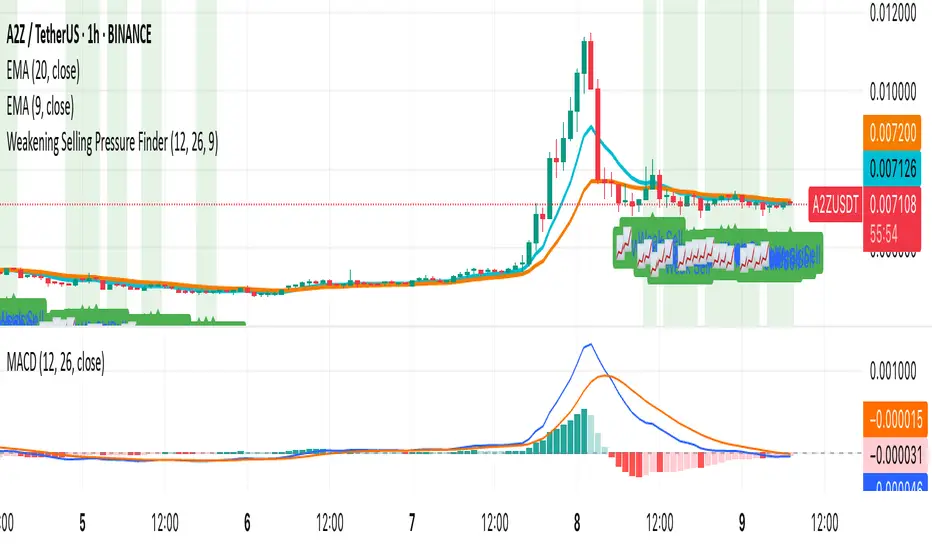
Weakening Selling Pressure FinderDescription:
This indicator helps traders identify potential trend reversals by detecting when selling pressure is weakening.
It uses the MACD histogram to spot moments when bearish momentum is still present but fading — a condition that often precedes a shift to bullish sentiment.
The indicator:
Highlights points where the MACD histogram is negative but rising
Marks these spots with a 📈 label for easy chart scanning
Works on any crypto pair and timeframe
Traders can use it to:
Spot early reversal setups before the crowd reacts
Time entries for potential trend changes
Complement other indicators like RSI, AO, or price action
This is a momentum shift detection tool — perfect for swing traders, scalpers, or anyone looking for early bullish signals after extended selling pressure.
EMA Crossover Strategy with Filters//@version=5
strategy("EMA Crossover Strategy with Filters", overlay=true,
initial_capital=100000, default_qty_type=strategy.percent_of_equity, default_qty_value=10)
// EMA lengths
ema9_len = 9
ema50_len = 50
ema100_len = 100
ema200_len = 200
// EMA calculation
ema9 = ta.ema(close, ema9_len)
ema50 = ta.ema(close, ema50_len)
ema100 = ta.ema(close, ema100_len)
ema200 = ta.ema(close, ema200_len)
// Plot EMAs
plot(ema9, color=color.yellow, title="9 EMA")
plot(ema50, color=color.orange, title="50 EMA")
plot(ema100, color=color.green, title="100 EMA")
plot(ema200, color=color.blue, title="200 EMA")
// Entry conditions
longCondition = ta.crossover(ema100, ema200) and ema9 > ema50
shortCondition = ta.crossunder(ema100, ema200) and ema9 < ema50
// Exit conditions
longExit = ta.crossunder(ema100, ema50)
shortExit = ta.crossover(ema100, ema50)
// Execute trades
if (longCondition)
strategy.entry("Long", strategy.long)
if (shortCondition)
strategy.entry("Short", strategy.short)
if (longExit)
strategy.close("Long")
if (shortExit)
strategy.close("Short")

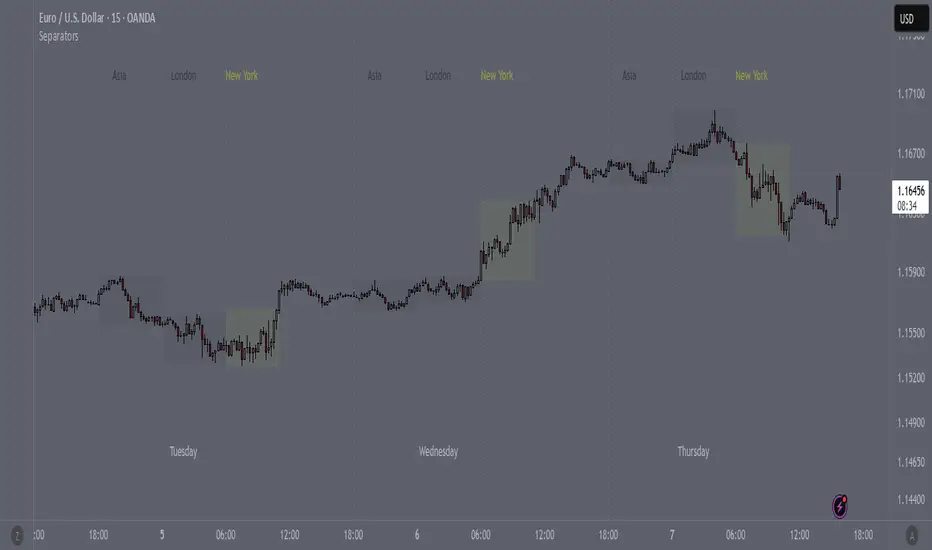
SeparatorsSession - H1 and below Time Frame
Day - H4 and below Time Frame
Month - D Time Frame
Quarter - W Time Frame
5 EMA No-Touch Breakout 1:3 (Only 5m)This strategy is built for traders who want to ride strong trends using the principle of EMA rejection.
The concept is simple:
📉 Sell when price stays below the 5 EMA without touching it — indicating strong bearish momentum.
📈 Buy when price stays above the 5 EMA without touching it — indicating strong bullish momentum.

Advance FVG with 3 EMAThis is a very powerful script and is an advanced version of Fair Value Gaps with powerful EMAs.

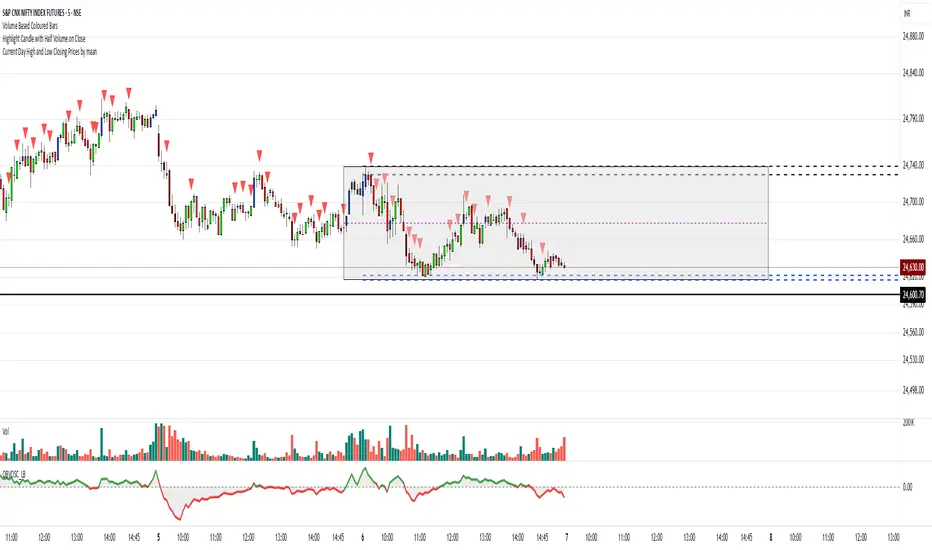
Highlight Candle with Half Volume on CloseIt checks volume of the current candle and compares with previous candle,
if volume is low then it highlights the candle. Lines are configurable.
Time Window Optimizer [theUltimator5]The Time Window Optimizer is designed to identify the most profitable 30-minute trading windows during regular market hours (9:30 AM - 4:00 PM EST). This tool helps traders optimize their intraday strategies by automatically discovering time periods with the highest historical performance or allowing manual selection for custom analysis. It also allows you to select manual timeframes for custom time period analysis.
🏆 Automatic Window Discovery
The core feature of this indicator is its intelligent Auto-Find Best 30min Window system that analyzes all 13 possible 30-minute time slots during market hours.
How the Algorithm Works:
Concurrent Analysis: The indicator simultaneously tracks performance across all 13 time windows (9:30-10:00, 10:00-10:30, 10:30-11:00... through 15:30-16:00)
Daily Performance Tracking: For each window, it captures the percentage change from window open to window close on every trading day
Cumulative Compounding: Daily returns are compounded over time to show the true long-term performance of each window, starting from a normalized value of 1.0
Dynamic Optimization: The system continuously identifies the window with the highest cumulative return and highlights it as the optimal choice
Statistical Validation: Performance is validated through multiple metrics including average daily returns, win rates, and total sample size
Visual Representation:
Best Window Line: The top-performing window is displayed as a thick colored line for easy identification
All 13 Lines (optional): Users can view performance lines for all time windows simultaneously to compare relative performance
Smart Coloring: Lines are color-coded (green for gains, red for losses) with the best performer highlighted in a user-selected color
📊 Comprehensive Performance Analysis
The indicator provides detailed statistics in an information table:
Average Daily Return: Mean percentage change per trading session
Cumulative Return: Total compounded performance over the analysis period
Win Rate: Percentage of profitable days (colored green if ≥50%, red if <50%)
Buy & Hold Comparison: Shows outperformance vs. simple buy-and-hold strategy
Sample Size: Number of trading days analyzed for statistical significance
🛠️ User Settings
imgur.com
Auto-Optimization Controls:
Auto-Find Best Window: Toggle to enable/disable automatic optimization
Show All 13 Lines: Display all time window performance lines simultaneously
Best Window Line Color: Customize the color of the top-performing window
Manual Mode:
imgur.com
Custom Time Window: Set any desired time range using session format (HHMM-HHMM)
Crypto Support: Built-in timezone offset adjustment for cryptocurrency markets
Chart Type Options: Switch between candlestick and line chart visualization
Visual Customization:
imgur.com
Background Highlighting: Optional background color during active time windows
Candle Coloring: Custom colors for bullish/bearish candles within the time window
Table Positioning: Flexible placement of the statistics table anywhere on the chart
🔧 Technical Features
Market Compatibility:
Stock Markets: Optimized for traditional market hours (9:30 AM - 4:00 PM EST)
Cryptocurrency: Includes timezone offset adjustment for 24/7 crypto markets
Exchange Detection: Automatically detects crypto exchanges and applies appropriate settings
Performance Optimization:
Efficient Calculation: Uses separate arrays for each time block to minimize computational overhead
Real-time Updates: Dynamically updates the best-performing window as new data becomes available
Memory Management: Optimized data structures to handle large datasets efficiently
💡 Use Cases
Strategy Development: Identify the most profitable trading hours for your specific instruments
Risk Management: Focus trading activity during historically successful time periods
Performance Comparison: Evaluate whether time-specific strategies outperform buy-and-hold
Market Analysis: Understand intraday patterns and market behavior across different time windows
📈 Key Benefits
Data-Driven Decisions: Base trading schedules on historical performance data
Automated Analysis: No manual calculation required - the algorithm does the work
Flexible Implementation: Works in both automated discovery and manual selection modes
Comprehensive Metrics: Multiple performance indicators for thorough analysis
Visual Clarity: Clear, color-coded visualization makes interpretation intuitive
This indicator transforms complex intraday analysis into actionable insights, helping traders optimize their time allocation and improve overall trading performance through systematic, data-driven approach to market timing.


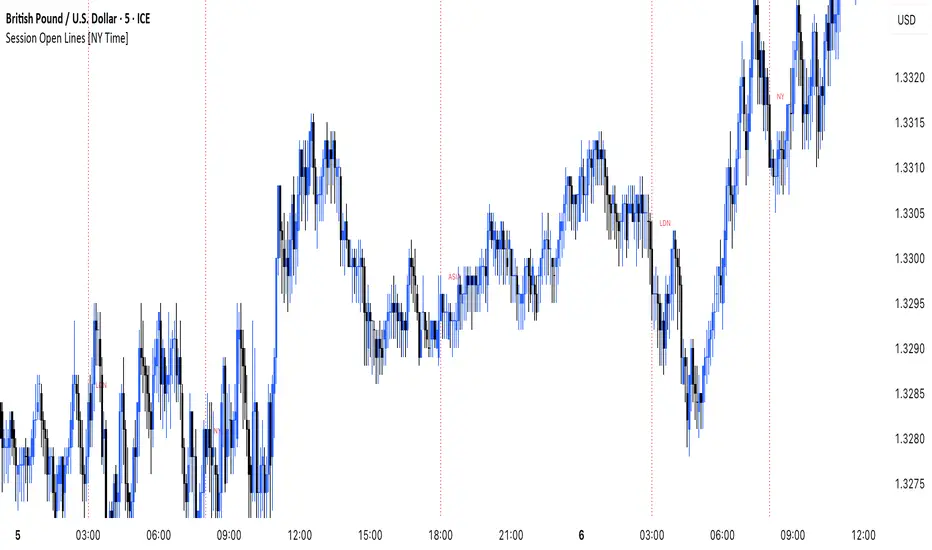
MANI SESSIONSOANDA:GBPUSD This indicator marks the opening times of the three main trading sessions — Asia, London, and New York — using vertical red dotted lines on the chart.
Each session is labeled with a minimal tag (“ASIA”, “LDN”, “NY”) displayed directly on the line for clean and unobtrusive reference.
All session times are based on the New York time zone and adjust automatically for each new day.
This tool helps intraday traders quickly identify session shifts, plan entries around high-volume hours, and stay locked into session-based strategy.
OANDA:GBPUSD
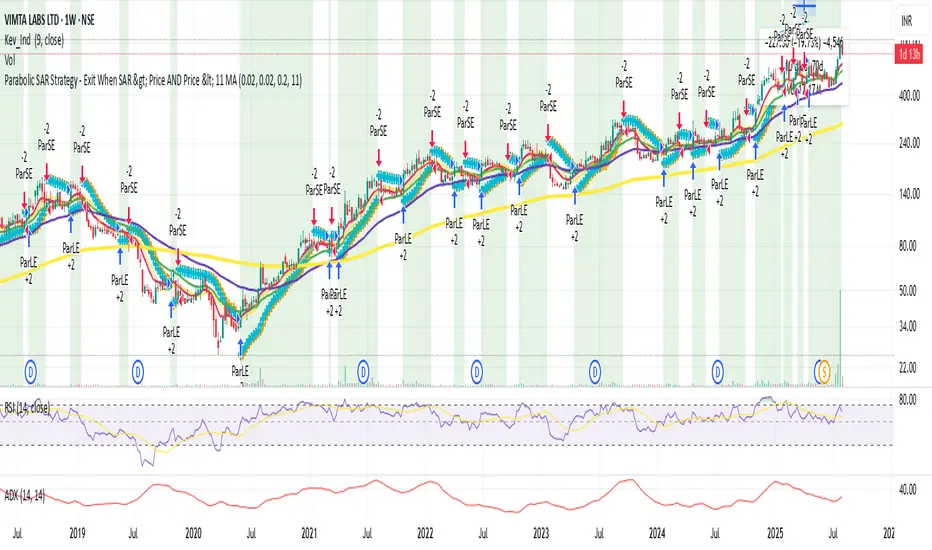
Parabolic SAR with Early Buy & MA-Based Exit Strategy📝 Strategy Description (Max SEO Impact)
This advanced Parabolic SAR-based trading strategy is designed to capture early trend reversals and exit intelligently using a dynamic moving average filter. It enters long trades when a PSAR reversal occurs, and exits only when the PSAR moves above price and the price falls below the 11-period SMA, helping avoid premature exits during volatile swings.
📌 Features:
• Custom Parabolic SAR calculation for refined trend tracking
• Background highlights during buy zones (SAR below price)
• Exit signals only when trend weakens (PSAR above + price under SMA)
• Red flag plotted on chart at exit bars for clear visual identification
• Works on all timeframes and instruments
Ideal for swing traders, trend followers, and strategy testers looking for smart PSAR-based entries with smoother exits.

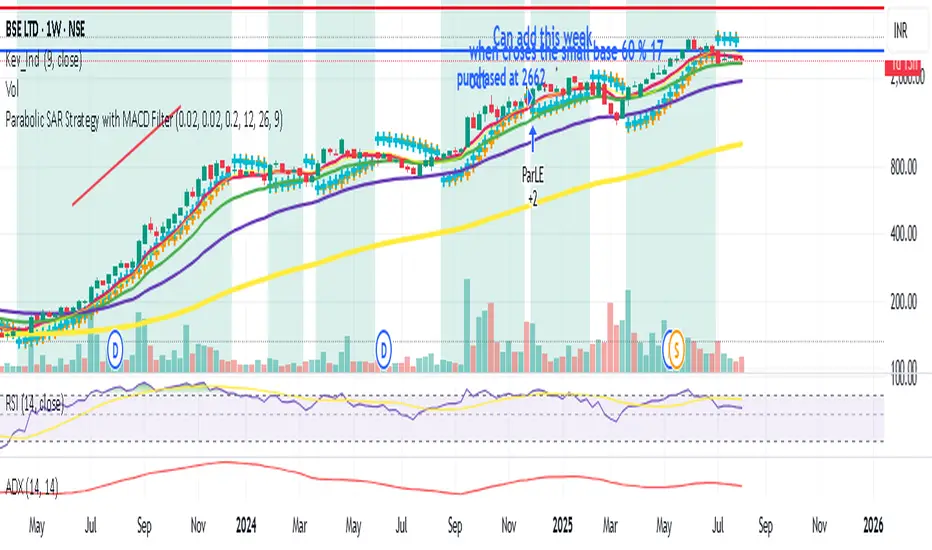
Parabolic SAR Strategy with MACD Confirmation & Trend Zone Highl📝 Description (SEO + Follower-Friendly):
🚀 Powerful Trend Strategy Using Parabolic SAR + MACD
This advanced Pine Script combines the classic Parabolic SAR trend-following system with MACD crossover confirmation, improving entry precision and filtering out false signals. The script also features:
✅ Dynamic trend zone background highlighting when SAR is below price
✅ MACD filter ensures trades align with market momentum
✅ Custom SAR logic with adaptive acceleration
✅ Clean visual SAR plots for easy trend tracking
✅ Fully backtestable with strategy.entry logic
🔎 Ideal for traders seeking early trend entries, momentum confirmation, and visual clarity.
📈 Works on all timeframes and pairs — perfect for swing traders, scalpers, and crypto enthusiasts.
💡 Use it as a base strategy or combine with your favorite indicators.
❤️ If you find this helpful, don't forget to like, comment, and follow for more premium strategies!


15-Minute and 60-Minute ORB with Wicks15 and 60 minute ORBs for each trading day. Simple, yet effective.
