Historical Year OverlayThis script allows you to simply source any historical calendar year and overlay it over any other year (usually a historical year overlaying a year in the future). It was made using an LLM for coding help and logic.
It is great for working out potential pivots and it also maps the previous profit/loss from the source year over the plot year so that we can see the connection to price levels throughout the plot year and also with the yearly close (we get a horizontal line for the close).
It uses the year open as a price reference to plot the P&L over the plot year (if use plot year option is selected).
if the year has not started yet you can use the "manual opening price" OR it will auto set to the current price (great for "replay mode", it will catch the actual opening price once it happens).
The settings are self explanatory. Choose a source year and plot year.
Choose a multiplier if you'd like (it simply multiplies the plot year P&L by that number; ie: 1 means the same as it was, 0.5 means half of what is was, 2 means 2x the source P&L)
The resolution is max default 50 line segments but you can simplify if you'd like.
I've released the code open-source so you can see what it is doing.
Please update it with all the enhancements you can think of.
Please let me know if you do this as I will be very interested!
Chart patterns

RSI Cloud Zones (by AButterfly)RSI instruction: Uptrend market only. LONG only. Should use only when SPY and QQQ are above 50 SMA and 200 SMA, and the 50sma is above 200sma, and RSI(14) is above 50 ............... BUY only in the GREEN area. Do NOT buy above GREEN green area. That would be chase (after a train, a ship that left). Take profit in the RED area, preferably on a green candle. This does not encourage SHORT-ing. LONG only. Disclaimer: This is an entertainment. If you lose money, don't blame this indicator or the creator. You have to pay attention to whether the market is on uptrend.

Order Blocks & FVG con Mitigación CRISVASPERIdentifica Bloques de ordenes y FVG, pero muestra el porcentaje de mitigaciones

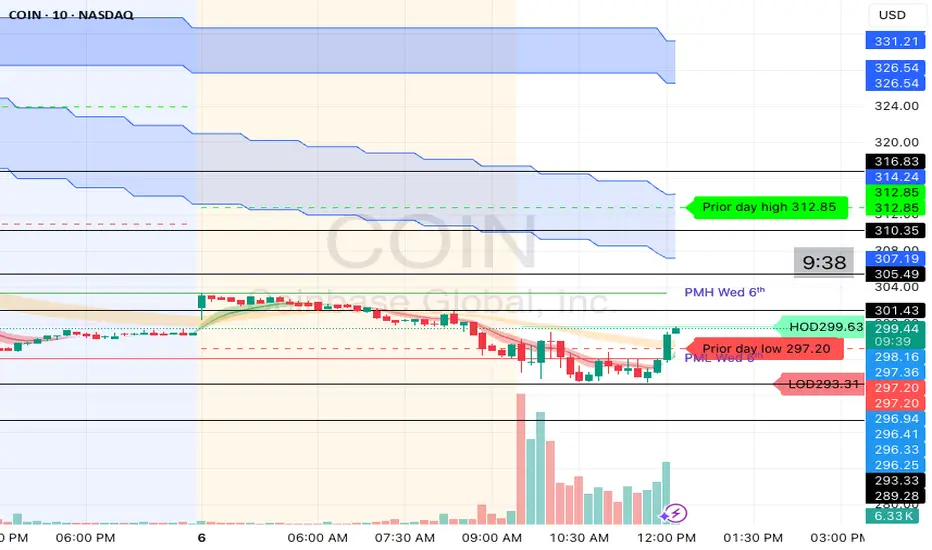
Price Levels: Prior/current/week/pre-market?after-hour high lowSee prior day levels including all time highs etc at one place. May change indicator settings and colors as you like.
MTF 200MULTI TIME FRAME 200MA
TIMEFRAME
1m 5m 15m 30m 60m 240m 1D
200 SMA
Check the chart for 200ma you were looking at a candle at a certain time

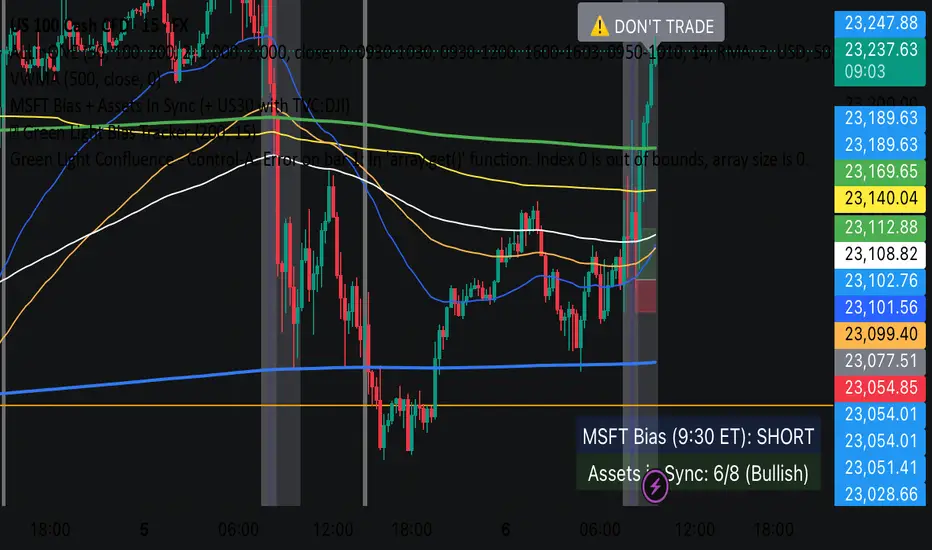
Green Light Confluence - Control-AIt scans the top 15 U.S. stocks in real time — including names like NASDAQ:AAPL , NASDAQ:AMZN , NASDAQ:NVDA , NASDAQ:GOOGL , NASDAQ:TSLA , and NASDAQ:MSFT — and identifies whether the majority are trending above or below their 200 EMA on the 1-minute chart.

Starter Edge StrategyStarter Edge Strategy
A clean and rule-based scalping strategy using ZLEMA, MACD and EMA filters.
Description
The Starter Edge Strategy is a structured technical trading system that combines trend-following and momentum indicators to identify potential entries on both the long and short side.
This script is intended for educational and research purposes only. It provides a clear visual framework for understanding basic momentum setups, with pre-defined risk/reward parameters and a focus on clarity of execution.
It is especially designed for beginner traders or small account investors who want to learn how to apply disciplined entries and exits with clear visual feedback. The strategy uses small position sizing and a low initial capital ($1000), making it more accessible to those just starting out.
All logic is fully transparent, with no repainting or subjective components.
Key Indicators
ZLEMA (Zero-Lag Exponential Moving Average)
MACD (based on ZLEMA)
EMA 100 for trend filtering
RSI for directional strength confirmation
Long Entry Conditions
Price above EMA 100
MACD crosses above the signal line
Histogram is rising
MACD and signal lines are not parallel
RSI > 50
Short Entry Conditions
Price below EMA 100
MACD crosses below the signal line
Histogram is falling
MACD and signal lines are not parallel
RSI < 50
Exit Logic
Take Profit: +2% from entry
Stop Loss: -1% from entry
Visual elements (optional): trade box, TP/SL lines, 2:1 risk/reward label
Strategy Settings
ZLEMA Length: 34
MACD: 12 / 26 / 9
EMA 100 Length: adjustable
RSI Period: 14
TP: 2% (default)
SL: 1% (default)
Position size: 0.1
Initial capital: $1000
Notes
This script is not financial advice.
Designed to help beginner traders study technical setups with clear visuals.
Backtesting and further validation are strongly recommended before live use.

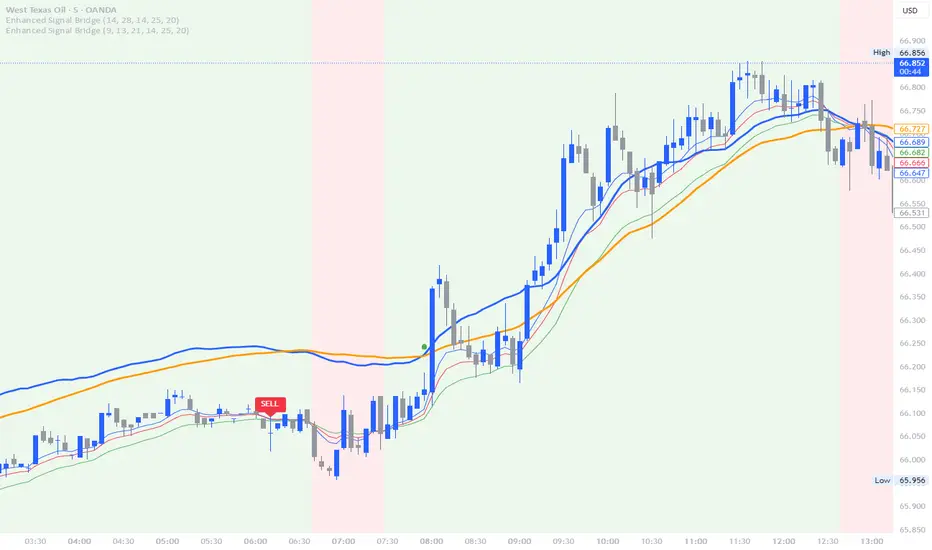
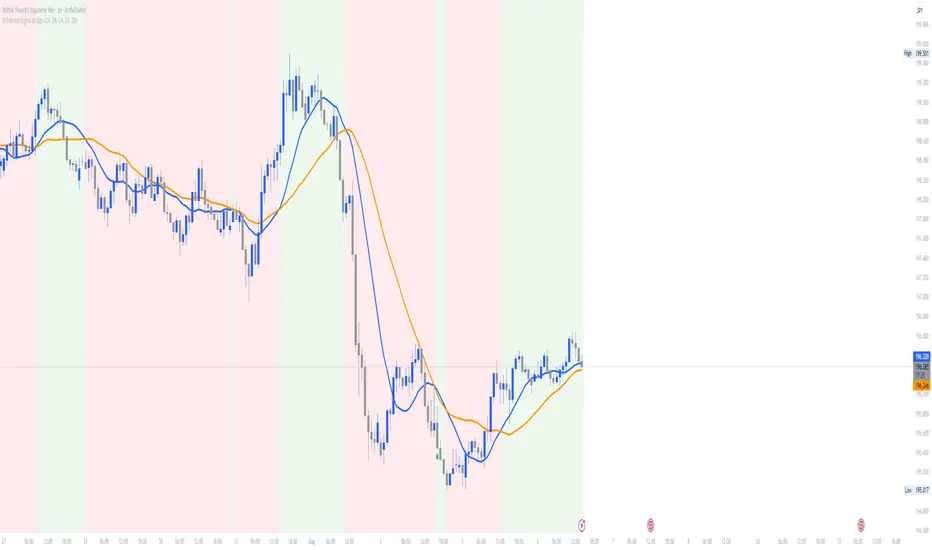
Enhanced Signal Bridge V1For the trading Careers members only base script for any pair on any time frame ( please double check as still a new script)
TSD Quantum [Moeinudin Montazerfaraj] 🔸 "TSD" stands for **Trend 1-2-3 and Supply & Demand**, which is the foundation of the trading style this indicator is built upon.
🔹 TSD Quantum is a specialized indicator designed exclusively for day traders who trade EURUSD, XAUUSD (Gold), and DAX40 on the 1H, 15M, and 5M timeframes using a Supply & Demand-based strategy.
This indicator is **not suitable for other symbols** and has been tailored specifically for these three assets to ensure high precision and effectiveness.
---
### 🔍 Key Features:
✅ **Trading Checklist Panel**
A built-in checklist helps you track every rule in your trading plan. If even one condition is left unchecked, the system highlights it in red and marks the trade as "Not Allowed." This feature enhances trading discipline.
✅ **Spread & ATR Control Panel**
Supports both auto-calculated and fixed values for spread and ATR. This is especially helpful when placing stop-losses quickly and accurately.
✅ **Inside & Outside Candle Detection**
A dedicated panel highlights whether the last candle is inside or outside. Hovering your mouse over the chart elements automatically colorizes the candles:
🔵 Blue = Outside candle
🔴 Red = Inside candle
Also displays the high/low of the latest outside bar.
✅ **Weekly Trade Stats Panel**
Custom-built for the mentioned three assets. You can enter your trades using either fixed risk or floating risk models.
✅ **Performance Metrics**
Helps you build and adjust a floating risk model—so you don’t have to enter every trade with the same lot size. Improves risk management across multiple trades.
✅ **Base Candles Display**
Grey and white base candles are marked based on supply and demand zones.
✅ **EOT Candles**
Candles with a green dot underneath indicate valid EOT opportunities for potential move-outs.
✅ **RC (Rejection Candle) Detection**
RC candles are automatically detected to alert you of potential traps or weaknesses during Supply/Demand formations.
---
### ⚠️ Disclaimer
This indicator does **not** issue buy/sell signals and **cannot guarantee profit or prevent loss**. It is a **tool for discretionary trading**, not an automated expert advisor.
All decisions must be made by the trader based on their own strategy and risk tolerance.
This is the **latest tested version** of TSD Quantum. All features have been validated and function as intended. Future updates will be provided if needed.
---
🙏 Thank you for reviewing this script. We hope it becomes a valuable addition to your day trading toolkit!

TSD Quantum [Moeinudin Montazerfaraj] 🔹 TSD Quantum is a specialized indicator designed exclusively for day traders who trade EURUSD, XAUUSD (Gold), and DAX40 on the 1H, 15M, and 5M timeframes using a Supply & Demand-based strategy.
This indicator is **not suitable for other symbols** and has been tailored specifically for these three assets to ensure high precision and effectiveness.
---
### 🔍 Key Features:
✅ **Trading Checklist Panel**
A built-in checklist helps you track every rule in your trading plan. If even one condition is left unchecked, the system highlights it in red and marks the trade as "Not Allowed." This feature enhances trading discipline.
✅ **Spread & ATR Control Panel**
Supports both auto-calculated and fixed values for spread and ATR. This is especially helpful when placing stop-losses quickly and accurately.
✅ **Inside & Outside Candle Detection**
A dedicated panel highlights whether the last candle is inside or outside. Hovering your mouse over the chart elements automatically colorizes the candles:
🔵 Blue = Outside candle
🔴 Red = Inside candle
Also displays the high/low of the latest outside bar.
✅ **Weekly Trade Stats Panel**
Custom-built for the mentioned three assets. You can enter your trades using either fixed risk or floating risk models.
✅ **Performance Metrics**
Helps you build and adjust a floating risk model—so you don’t have to enter every trade with the same lot size. Improves risk management across multiple trades.
✅ **Base Candles Display**
Grey and white base candles are marked based on supply and demand zones.
✅ **EOT Candles**
Candles with a green dot underneath indicate valid EOT opportunities for potential move-outs.
✅ **RC (Rejection Candle) Detection**
RC candles are automatically detected to alert you of potential traps or weaknesses during Supply/Demand formations.
---
### ⚠️ Disclaimer
This indicator does **not** issue buy/sell signals and **cannot guarantee profit or prevent loss**. It is a **tool for discretionary trading**, not an automated expert advisor.
All decisions must be made by the trader based on their own strategy and risk tolerance.
This is the **latest tested version** of TSD Quantum. All features have been validated and function as intended. Future updates will be provided if needed.
---
🙏 Thank you for reviewing this script. We hope it becomes a valuable addition to your day trading toolkit!

90 & 30 Minute Cycles — Persistent BoxesDescription:
This script visualizes custom 90-minute and 30-minute time cycles on your chart, starting from a user-defined time. Each 90-minute box contains three nested 30-minute boxes, all dynamically coloring and adjusting to price extremes for their cycle. The tool allows you to spot natural market rhythms, liquidity shifts, and key timing windows for trend reversals, expansions, and manipulations—techniques employed by some of the most effective intraday traders.
Features:
Adjustable start time for cycles.
90-minute cycles with embedded 30-minute cycles.
Each box automatically expands to include the true high and low during its period.
Alerts at the start of each new 30-minute window.
Works on any intraday timeframe (recommended: 1- to 5-minute charts for best effect).
How it helps:
This tool helps you visually structure the session and identify when the most significant moves and liquidity events are most likely to occur—based on time, not just price.
Many successful traders have found that structuring their day with these time blocks clarifies the market's rhythm, reduces noise, and improves decision-making.
If you find this indicator useful, consider leaving feedback or sharing how you use it in your trading.

Traderei Sessions v.1This Indicator shows the daily open, the last 24h daily highs & lows and the last highs & lows of the asia session.
you can increase the lenght of the line manually !
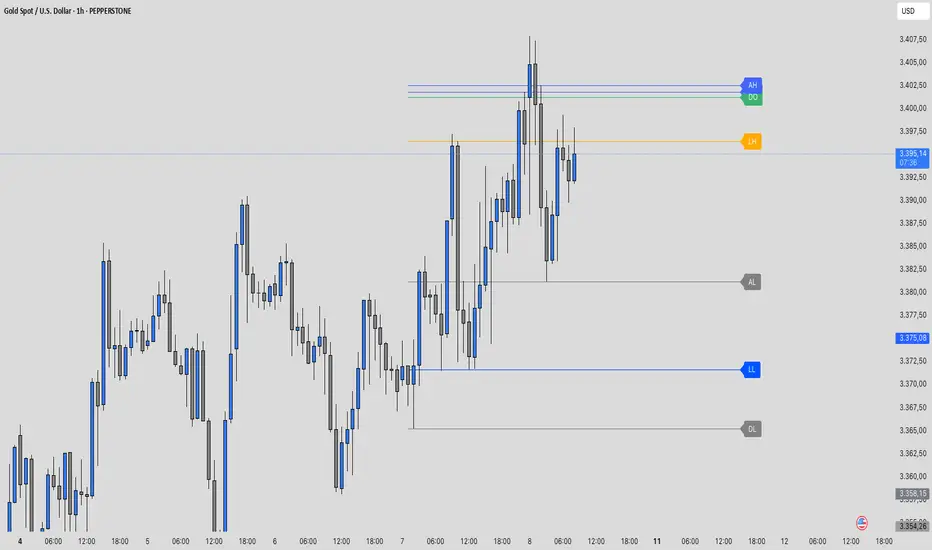
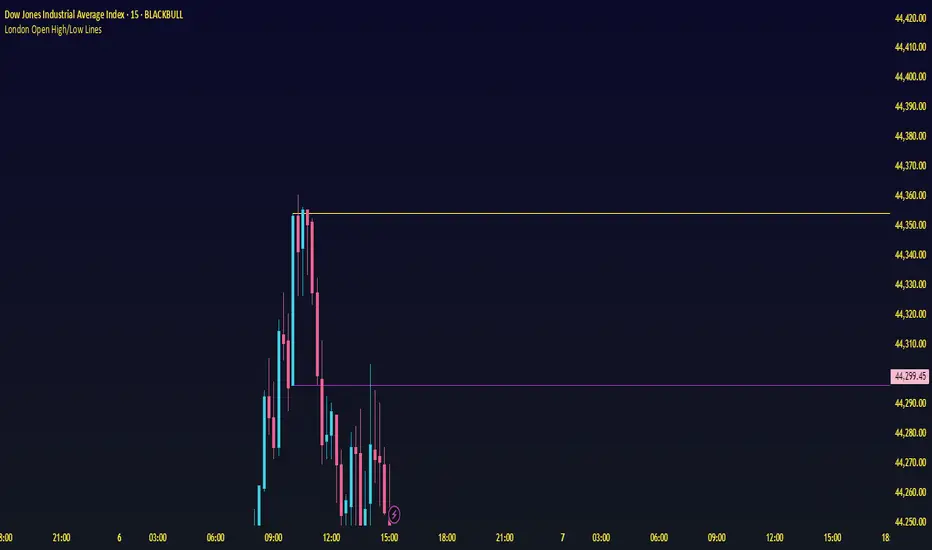
ORB M15 EarThRiseRAcest indicator trasează automat liniile de high și low pentru candela de 15 minute de la London Open, cu posibilitatea de a schimba culoarea și grosimea liniilor din setări. Ideal pentru strategii de tip opening range breakout. Compatibil cu orice instrument și funcționează pe timeframe de 15 minute.
Price Line Indicator
This indicator plots evenly spaced horizontal lines on the price chart starting from a user-defined price. You can customize:
Starting Price
Price Spacing (supports decimals)
Number of Lines
Line Color & Width
Each line is extended across the chart with a label showing its precise price level (up to 4 decimal places). Ideal for marking psychological levels, support/resistance zones, or custom grid setups.

Consolidation Box1. Overview & Purpose
The "Faithful Box" is a powerful TradingView indicator designed to automatically identify and visualize high-quality price consolidation zones, often known as 'trading ranges' or 'boxes'.
This tool is a direct Pine Script translation of a specific, robust Python-based analysis strategy. Its primary goal is not just to find any sideways movement, but to qualify it based on a strict set of rules, ensuring that only meaningful and tradable consolidation patterns are highlighted on the chart.
2. Core Logic: How It Works
The indicator's intelligence is based on several key rules translated from the original Python script:
Box Definition (Based on Closing Prices): The most crucial rule is how the box is defined. Unlike many tools that use candle wicks (highs and lows), this indicator establishes the Ceiling (Resistance) and the Floor (Support) of the box using the highest Close price and the lowest Close price over the specified analysis period. This provides a more stable and representative view of the true consolidation zone, ignoring outlier price spikes.
Quality Filters: A consolidation is only considered valid and drawn on the chart if it meets two strict criteria:
Minimum Touches: The price must "test" the ceiling and floor a minimum number of times. A "touch" is counted with a tolerance — the High of a candle only needs to get close to the ceiling, and the Low close to the floor. This simulates how price interacts with support and resistance zones in the real world.
Maximum Height: The consolidation range cannot be excessively wide or volatile. The box will only be drawn if its total height, as a percentage of its price, is below a user-defined limit.
3. Visual Features on the Chart
When a valid consolidation pattern is detected, the indicator draws a semi-transparent box over the analysis period. The most powerful visual feature is its dynamic coloring, which functions as a built-in alert system:
🟥 Red Box: The box turns red when the price enters the upper "Action Zone" (e.g., the top 30% of the range). This visually signals that the price is near a key resistance level, alerting the trader to a potential reversal or breakout opportunity.
🟩 Green Box: The box turns green when the price enters the lower "Action Zone" (e.g., the bottom 30% of the range). This highlights that the price is testing a key support level.
⬜ Gray Box: The box remains a neutral gray when the price is trading in the middle of the range, which can often be considered a "no-trade" or "wait-and-see" zone.
4. Configuration (Indicator Inputs)
You have full control over the indicator's sensitivity through its inputs:
Analysis Period (days): Defines the lookback window (in trading days) to search for a consolidation pattern. Common values are 42 (approx. 2 months) or 63 (approx. 3 months).
Maximum Box Height (%): Filters out consolidations that are too volatile or wide. A lower percentage will find tighter, more compressed consolidations.
Minimum Ceiling/Floor Touches: Defines the "strength" of the support and resistance levels. Requiring more touches will result in fewer detected patterns, but likely of higher quality.
Touch Tolerance (%): Defines how close the High/Low needs to get to the edge of the box to be counted as a touch. A value of 2% means a touch is registered if the price comes within 2% of the box's total height from the edge.
Action Zone (%): Customizes the size of the red (resistance) and green (support) zones. A value of 30% means the top 30% of the box will be the red zone, and the bottom 30% will be the green zone.

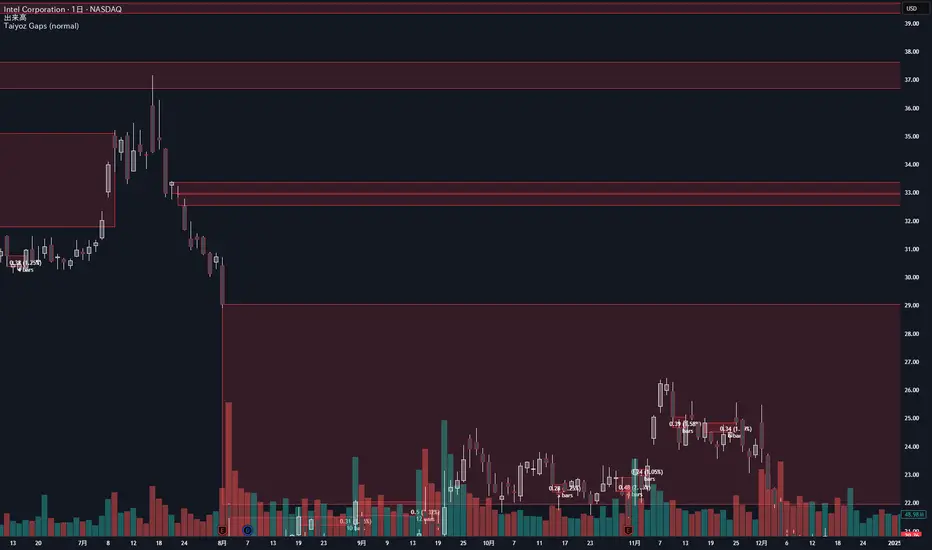
Taiyoz Gaps1. Purpose
Tyoz Gaps highlights “gaps” between yesterday’s close and today’s open directly on your chart. A gap occurs when the opening price is significantly above or below the prior bar’s close. By drawing persistent boxes around each gap, you can instantly see where price left a void and monitor when (or if) that void gets completely filled.
2. Gap Detection Logic
Threshold: A gap is only detected if the open-to-previous-close difference exceeds a user-defined “Minimal Deviation” (percentage of the 14-bar average high-low range).
Direction:
Gap Up: today’s open > yesterday’s close
Gap Down: today’s open < yesterday’s close
3. Box Drawing
For each detected gap, the script draws a rectangular box spanning from yesterday’s close level to today’s open level.
Border & Fill Colors are configurable separately for up-gaps and down-gaps.
Boxes extend to the right as new bars form.
4. Display & Filtering Options
Show Gap Up / Show Gap Down toggles let you hide bullish or bearish gaps independently.
Max Number of Gaps: Limits how many boxes remain on-screen; oldest boxes are removed when the limit is exceeded.
Limit Max Gap Trail Length: Optionally force-close any gap box after a given number of bars, even if unfilled.
5. Closing Logic
Full-Fill Only: A gap box stays visible until price fully “fills” it—i.e., for an up-gap, price must exceed the top edge (yesterday’s close); for a down-gap, price must cross below the bottom edge.
Once filled, the box is removed and a “Gap Closed” alert flag is set.
6. Labels & Alerts
Each active gap can optionally show a label at the gap’s lower edge containing:
Absolute size (in price points) and percentage of the gap
Bar count since the gap formed
Label Text Color and Label Text Size are both user-configurable.
Two built-in alertcondition()s fire when a new gap appears or when a gap closes.
5MA_Zigzag_RSI_Sessions_CandlesHere is the combination indicator so that you can select and choose the indicator which you want to show in the chart such as EMA, RSI table, Fibonacci Zigzag level, Market session and Candle theory.

5MA+ZZ+RSI+Sessions+CandlesHere is an combination indicator which presented the EMA, RSI, Fibonacci zigzag level, Market session and Candle theory.
You can visible which indicator you want.

Daily Pivot Points + R1 S1 R2 S2 with PricesThis indicator automatically plots daily pivot points (PP) along with the first and second resistance (R1, R2) and support (S1, S2) levels on your chart. Each level is clearly labeled with its price, making it easy to identify key areas for potential reversals or breakouts. Perfect for day traders and swing traders looking for reliable intraday support and resistance zones.

Efficient Candle Range (ECR)Efficient Candle Range (ECR)
A custom-built concept designed to detect zones of efficient price movement, often signaling the start, pause, or end of an implied move.
What is the Efficient Candle Range?
The Efficient Candle Range (ECR) is a unique tool that identifies price zones based on efficient candles—candles with relatively small bodies and balanced wicks. These candles reflect balanced or orderly price action, and when grouped into a range, they can reveal areas of temporary equilibrium in the market.
Rather than focusing on single candles, ECR builds a range that dynamically adjusts as new efficient candles form. This gives traders an objective way to track potential areas of absorption, distribution, or transition.
Why use ECR?
Efficient candles often occur:
At the beginning of a new move, after a liquidity sweep or shift in sentiment
At the end of a strong move, as momentum fades
Within consolidation zones, where price trades in a balanced, indecisive state
While ECRs can appear in any market condition, their interpretation depends on context:
In a range, an ECR might just reflect sideways balance.
But after a sweep or breakout, it could signal a potential shift in direction or continuation.
A close outside the ECR often marks the end of that balance and the start of a new impulse.
How it works
The script detects efficient candles based on body-to-range ratio and wick symmetry.
Consecutive ECs are grouped into a live ECR box.
The box dynamically extends as long as price stays inside the high-low range.
Once a candle closes outside, the ECR is considered invalid (fades visually, but remains visible for reference).
Each active range is labeled "ECR" within the box for easy tracking.
Customizable in settings
Max body percentage of range
Max wick imbalance
Box and label color/transparency
Suggested usage
Let the ECR define your observation zone.
Instead of reacting immediately to an efficient candle, wait for a confirmed breakout from the ECR to validate the next move.
Whether you trade breakouts, reversals, or continuation setups, ECR provides an objective way to visualize price balance and understand when the market is likely to expand.
Designed for individual traders looking to build structure around efficient price movement — no specific methodology required.

Sharp Entry TMixture of Combined Technical indicators :
FAST EMA
SLOW EMA
RSI
ADX
VOLUME
Combined together to provide sharp BUY and SELL signals .
