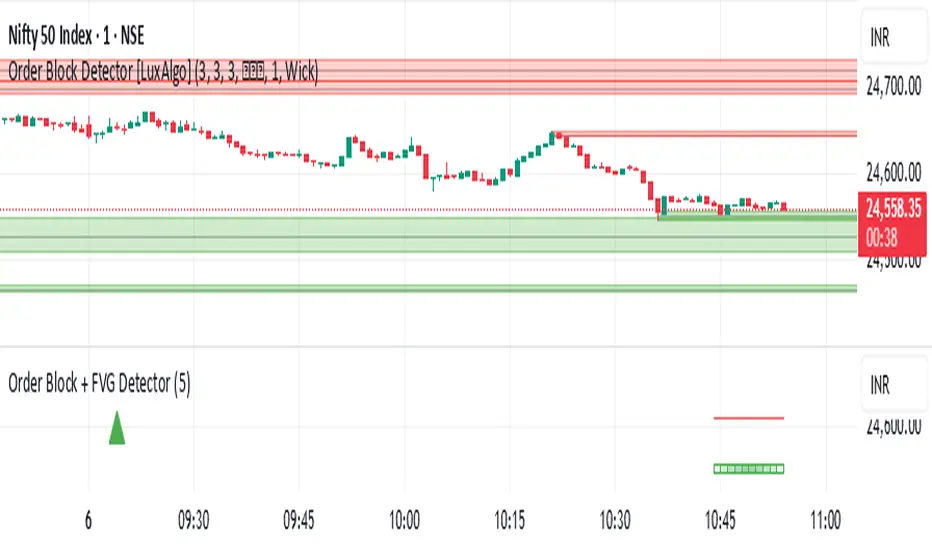
Order Block + FVG Detector- chakrashows OBs with entry and exits and volumes. It also shows the volumes in each Order block
Chart patterns
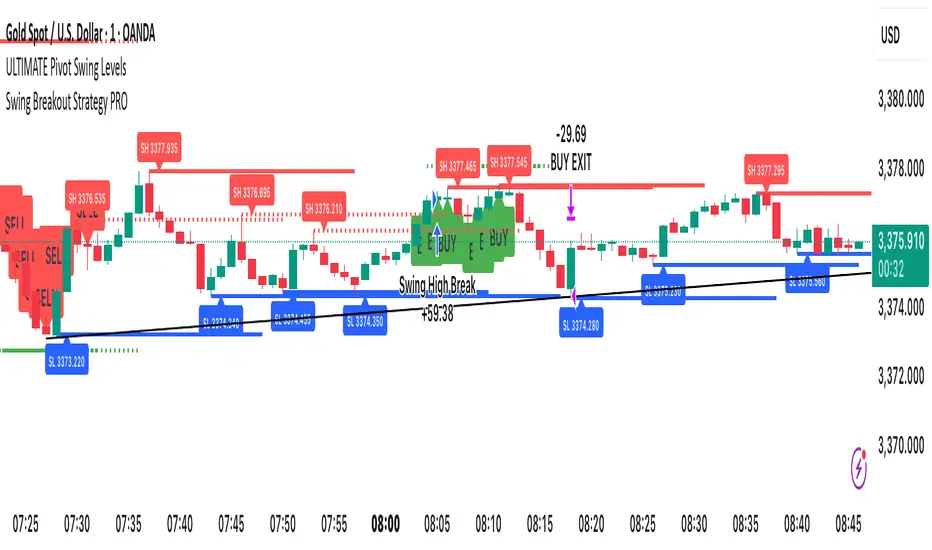
Swing Breakout Strategy PRO“Swing Strategy Pro”
A powerful trading tool designed for price action & swing traders. This indicator automatically detects swing highs and lows and generates precise Buy & Sell signals based on breakout confirmations.
✅ How It Works:
• Buy signal: When swing high breaks with confirmation candle
• Sell signal: When swing low breaks with confirmation candle
• Target = Distance between recent swing high & low
• Stop Loss = Opposite swing level
📌 Perfect for Breakout Trading, Swing Entries, and Trend Continuation strategies.
🎯 Fully automated with visual alerts & clean chart design.

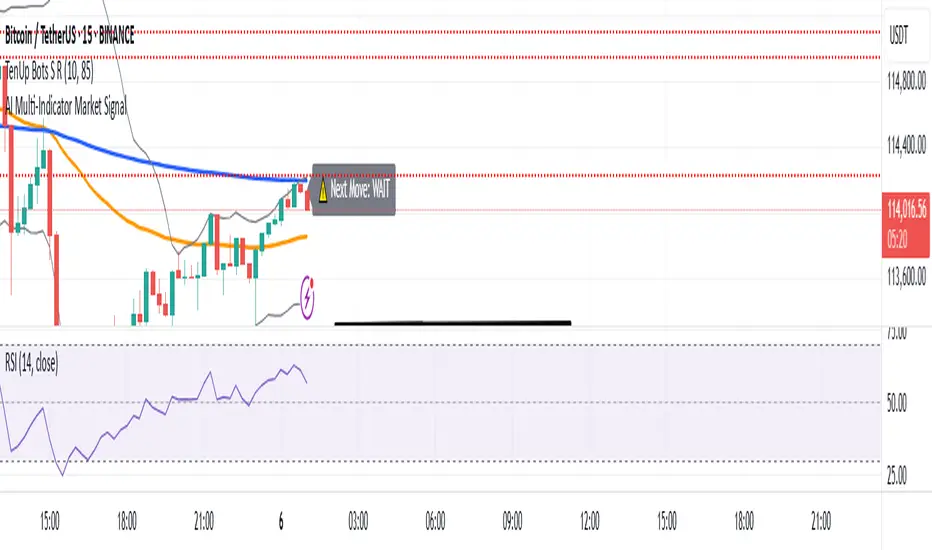
Multi-Indicator Market SignalMulti-Indicator Market Signal with rsi , macd ,volume buy and sell signal
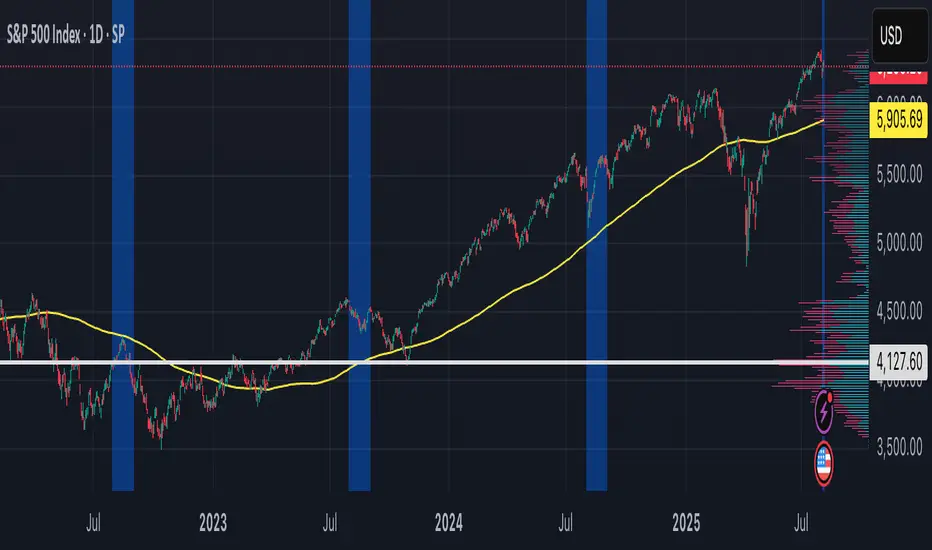
Period Highlighter ProPeriod Highlighter Pro is a versatile Pine Script indicator designed to visually highlight specific time periods on your TradingView charts, making it easier to analyze seasonal patterns, trading sessions, or specific weekdays. With customizable settings for months, weekdays, or intraday time ranges, this tool adapts to your trading strategy, allowing you to focus on key periods with precision.
Features
Flexible Highlight Modes: Choose from three modes to highlight:
Month Range: Highlight specific months or a range (e.g., March to June) for seasonal analysis.
Weekday Range: Highlight specific weekdays (e.g., Mondays or Monday to Wednesday) for weekly pattern analysis.
Time Range: Highlight daily time windows (e.g., 15:30–22:00) for intraday session analysis, restricted to weekdays.
Customizable Timezone: Set any IANA timezone (e.g., America/New_York, Europe/London) or UTC offset to align highlights with your preferred market hours.
Historical Range Control: Define how far back to apply highlights with options for years (Month Range), weeks (Weekday Range), or days (Time Range).
Visual Customization: Choose your highlight color to match your chart style.
User-Friendly Inputs: Intuitive dropdowns and tooltips guide you through configuring each mode, ensuring only relevant settings are adjusted.
How It Works
Select a highlight mode and configure the corresponding settings:
Month Range: Pick a start month and an optional end month (or "Disabled" for a single month) and set the number of years back.
Weekday Range: Choose a start weekday and an optional end weekday (or "Disabled" for a single day) and set the number of weeks back.
Time Range: Specify a start and end time (24-hour format) and the number of weekdays back. The indicator then applies a semi-transparent background color to chart bars that meet your criteria, making it easy to spot relevant periods.
Use Cases
Seasonal Traders: Highlight specific months to analyze recurring market patterns.
Day Traders: Focus on active trading sessions (e.g., New York open) with precise time range highlighting.
Weekly Pattern Analysts: Isolate specific weekdays to study price behavior.
Global Traders: Adjust for any timezone to align with your market of interest.
Why Use Period Highlighter Pro?
This indicator simplifies time-based analysis by providing a clear visual overlay for your chosen periods. Whether you're studying historical trends or focusing on specific trading hours, Period Highlighter Pro offers the flexibility and precision to enhance your chart analysis.
Licensed under the Mozilla Public License 2.0.
TR37This indicator plots a 377-day Exponential Moving Average (EMA) based on the closing price, ideal for long-term trend analysis. The EMA emphasizes recent price movements while smoothing out short-term fluctuations. A label "TR37" with white text is displayed at the end of the line for clear identification.


Smooth Cloud + RSI Liquidity Spectrum + Zig Zag Volume ProfileSmooth Cloud + RSI Liquidity Spectrum + Zig Zag++ Volume Profile" Indicator
| Advanced Trend & Liquidity Analysis.
---
📌 Key Features & Enhancements (Zig Zag++)
This advanced indicator combines **trend-following moving averages, RSI momentum with liquidity factors, and an improved Zig Zag++ algorithm with volume profiling** for precise swing detection.
🔹 Zig Zag++ Upgrades:
✅ **Dynamic Reversal Detection** – Adapts to volatility using percentage-based pivots.
✅ **Volume-Weighted Swing Points** – Highlights high-liquidity turning points.
✅ **Multi-Timeframe Confirmation** – Uses historical pivots for stronger signals.
✅ **Volume Profile Clustering** – Reveals key support/resistance zones based on traded volume.
---
📊 Indicator Components Breakdown
1️⃣ Smooth Cloud (Trend Filter)
- **Fast MA (20-period) & Slow MA (50-period)** – Configurable as EMA, SMA, or WMA.
- **Cloud Coloring** – Green when fast MA > slow MA (bullish), red otherwise (bearish).
- **Purpose**: Acts as a trend filter—only take trades in the direction of the cloud.
2️⃣ RSI Liquidity Spectrum (Momentum + Volume)
- **RSI (14-period default)** – Standard momentum oscillator.
- **Liquidity-Adjusted Momentum** = `(RSI + ROC(RSI,3)) * (Volume / SMA(Volume, RSI Length))`
- **Purpose**: Identifies overbought/oversold conditions with volume confirmation (high volume = stronger signal).
3️⃣ Zig Zag++ (Swing Detection & Volume Profiling)
📈 Zig Zag Logic:**
- **Percentage-Based Reversals** (default: 5%) – Only plots swings exceeding this threshold.
- **Pivot Tracking** – Stores price & bar index of each swing point in arrays.
- **Dynamic Line Drawing** – Connects swing points with yellow trendlines.
📊 Volume Profile at Swings:
- **Lookback Period** (200 bars default) – Analyzes volume distribution between Zig Zag turns.
- **10-Price Bin Clustering** – Splits the price range into 10 levels and calculates traded volume at each.
- **Transparency Scaling** – Higher volume zones appear darker (stronger support/resistance).
---
🎯 Step-by-Step Trading Strategies
📈 Strategy 1: Trend-Following with RSI Liquidity Confirmation**
1. **Enter Long** when:
- Smooth Cloud is **green** (fast MA > slow MA).
- RSI Liquidity Momentum crosses above **30** (bullish momentum + volume).
- Price pulls back to the **Volume Profile high-volume zone** (demand area).
2. **Enter Short** when:
- Smooth Cloud is **red** (fast MA < slow MA).
- RSI Liquidity Momentum crosses below **70** (bearish momentum + volume).
- Price rallies into the **Volume Profile high-volume zone** (supply area).
3. **Exit** when:
- Zig Zag++ detects a new reversal (5% move against position).
- RSI Liquidity Momentum crosses back mid-level (50).
---
📉 Strategy 2: Swing Trading with Zig Zag++ Pivots**
1. **Buy at Swing Lows** when:
- Zig Zag++ prints a **higher low** (bullish structure).
- Volume Profile shows **strong absorption** (high volume at the low).
- RSI Liquidity Momentum is rising from oversold (<30).
2. **Sell at Swing Highs** when:
- Zig Zag++ prints a **lower high** (bearish structure).
- Volume Profile shows **distribution** (high volume at the top).
- RSI Liquidity Momentum is falling from overbought (>70).
3. **Stop Loss**:
- Below the recent Zig Zag low (for longs).
- Above the recent Zig Zag high (for shorts).
---
📌 Additional Enhancements (Pro Tips)**
- **Combine with Higher Timeframe (HTF) Cloud** – Use a 4H/1D cloud to filter trades.
- **Divergence Detection** – Hidden bullish/bearish divergences between Zig Zag & RSI Liquidity.
- **Volume Spike Confirmation** – Only trade if volume exceeds SMA(volume, 20) at reversal points.
---
🚀 Conclusion
This **all-in-one indicator** provides:
✔ **Trend direction** (Smooth Cloud)
✔ **Momentum + Liquidity strength** (RSI Spectrum)
✔ **Precise swing points** (Zig Zag++)
✔ **Volume-based S/R zones** (Profile Clustering)
Best used on **15M-4H timeframes** for swing/day trading. Adjust parameters based on asset volatility.

Manadi Buy/Sell Strategy EMA + MACD + RSI + AlertsIt is a strategy / indicator of buy and sell special crypto for 15 min to 1 h time frame.
used with RSI, Macd, and Ema cros 9/21

Moving Average Convergence Divergence (with Fade Alert) • Adds a new alertcondition() called “MACD Histogram Fading”.
• This alert triggers whenever the histogram bar is shrinking, regardless of direction.
• You can now set your alert on TradingView using that condition.
AMOGH smc bo/bd - Delta Bot IntegrationAMOGH SMC BO/BD – Delta Bot Integration ek advanced Pine Script indicator hai jo CHoCH ke baad breakout/breakdown (BO/BD) entries detect karta hai. Ye structure flip, SL, aur smart alerts ke sath auto-trading bots ke liye optimized hai. Entry precision aur exit logic strategy-grade hai.

BSC XTrender Signal Engine📈 BSC XTrender Signal Engine
The BSC XTrender Signal Engine is a precision-built momentum and trend confirmation tool that generates high-probability long/short alerts based on three key components:
🔹 BSC XTrender Engine – A dual-timeframe oscillator that visualizes both short- and long-term trend pressure in a unified color-coded ribbon.
🔹 EMA Trend Filter – Confirms price structure alignment using fast and slow exponential moving averages.
🔹 MACD Directional Bias – Validates momentum direction by checking for histogram agreement with price.
🚨 Trade Signals:
Long Trigger: BSC XTrender turns green, price above EMAs, MACD rising
Short Trigger: BSC XTrender turns red, price below EMAs, MACD falling
All conditions must align for a confirmed signal.
🧠 Designed for:
Futures, crypto, and equities traders who want clear entry signals backed by multi-layered logic. Perfect for both intraday scalping and swing trading strategies.

AI - Williams Alligator Strategy (ATR Stop-Loss) AlertsAI - Williams Alligator Strategy (ATR Stop-Loss) with Alerts

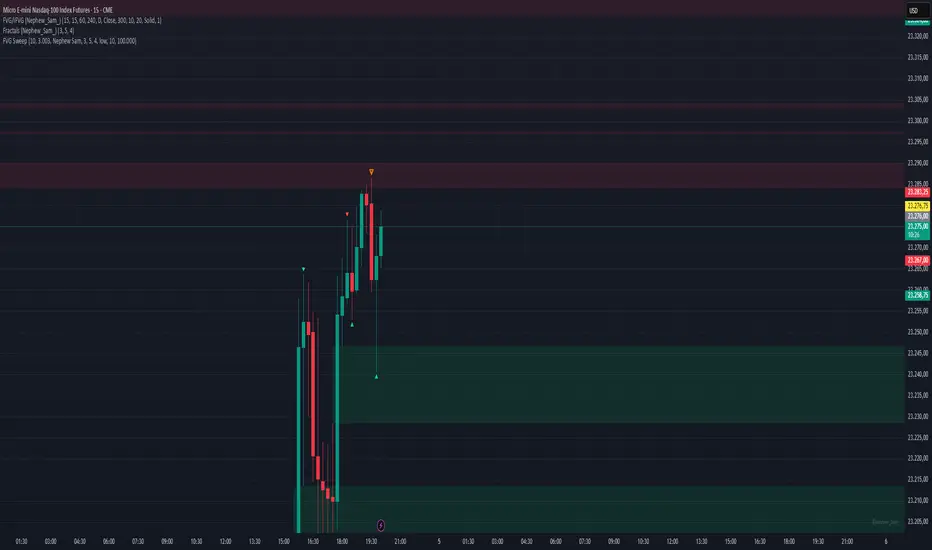
Multi-Timeframe SFP + SMTImportant: Please Read First
This indicator is not a "one size fits all" solution. It is a professional and complex tool that requires you to learn how to use it, in addition to backtesting different settings to discover what works best for your specific trading style and the assets you trade. The default settings provided are my personal preferences for trading higher-timeframe setups, but you are encouraged to experiment and find your own optimal configuration.
Please note that while this initial version is solid, it may still contain small errors or bugs. I will be actively working on improving the indicator over time. Also, be aware that the script is not written for maximum efficiency and may be resource-intensive, but this should not pose a problem for most users.
The source code for this indicator is open. If you truly want to understand precisely how all the logic works, you can copy and paste the code into an AI assistant like Gemini or ChatGPT and ask it to explain any part of the script to you.
Author's Preferred Settings (Guideline)
As a starting point, here are the settings I personally use for my trading:
SFP Timeframe: 4-Hour (Strength: 5-5)
Max Lookback: 35 Bars
Raid Expiration: 1 Bar
SFP Lines Limit: 1
SMT Timeframe 1: 30-Minute (Strength: 2-2) with 3-Minute LTF Detection.
SMT Timeframe 2: 15-Minute (Strength: 3-3) with 3-Minute LTF Detection.
SMT Timeframe 3: 1-Hour (Strength: 1-1) with 3-Minute LTF Detection.
SMT Timeframe 4: 15-Minute (Strength: 1-1) with 3-Minute LTF Detection.
Multi-Timeframe SMT: An Overview
This indicator is a powerful tool designed to identify high-probability trading setups by combining two key institutional concepts: Swing Failure Patterns (SFP) on a higher timeframe and Smart Money Technique (SMT) divergences on a lower timeframe. A key feature is the ability to configure and run up to four independent SMT analyses simultaneously, allowing you to monitor for divergences across multiple timeframes (e.g., 15m, 1H, 4H) from a single indicator.
Its primary purpose is to generate automated signals through TradingView's alert system. By setting up alerts, the script runs server-side, monitoring the market for you. When a setup presents itself, it will send a push notification to your device, allowing you to personally evaluate the trade without being tied to your screen.
The Strategy: HTF Liquidity Sweeps into LTF SMT
The core strategy is built on a classic institutional trading model:
Wait for a liquidity sweep on a significant high timeframe (e.g., 4-hour, Daily).
Once liquidity is taken, look for a confirmation of a shift in market structure on a lower timeframe.
This indicator uses an SMT divergence as that confirmation signal, indicating that smart money may be stepping in to reverse the price.
How It Works: The Two-Step Process
The indicator's logic follows a precise two-step process to generate a signal:
Step 1: The Swing Failure Pattern (SFP)
First, the indicator identifies a high-timeframe liquidity sweep. This is configured in the "Swing Failure Pattern (SFP) Timeframe" settings.
It looks for a candle that wicks above a previous high (or below a previous low) but then closes back within the range of that pivot. This action is known as a "raid" or a "swing failure," suggesting the move failed to find genuine momentum.
Step 2: The SMT Divergence
The moment a valid SFP is confirmed, the indicator's multiple SMT engines activate.
Each engine begins monitoring the specific SMT timeframe you have configured (e.g., "SMT Timeframe 1," "SMT Timeframe 2," etc.) for a Smart Money Technique (SMT) divergence.
An SMT divergence occurs when two closely correlated assets fail to move in sync. For example, after a raid on a high, Asset A makes a new high, but Asset B fails to do so. This disagreement suggests weakness and a potential reversal.
When the script finds this divergence, it plots the SMT line and triggers an alert.
The Power of Alerts
The true strength of this indicator lies in its alert capabilities. You can create alerts for both unconfirmed and confirmed SMTs.
Enable Alerts LTF Detection: These alerts trigger when an unconfirmed, potential SMT is spotted on the lower "LTF Detection" timeframe. While not yet confirmed, these early alerts can notify you of a potential move before it fully happens, allowing you to be ahead of the curve and find the best possible trade entries.
Enable Alerts Confirmed SMT: These alerts trigger only when a permanent, confirmed SMT line is plotted on your chosen SMT timeframe. These signals are more reliable but occur later than the early detection alerts.
Key Concepts Explained
What is Pivot Strength?
Pivot Strength determines how significant a high or low needs to be to qualify as a valid structural point. A setting of 5-5, for example, means that for a candle's high to be considered a valid pivot high, its high must be higher than the highs of the 5 candles to its left and the 5 candles to its right.
Higher Strength (e.g., 5-5, 8-8): Creates fewer, but more significant, pivots. This is ideal for identifying major structural highs and lows on higher timeframes.
Lower Strength (e.g., 2-2, 3-3): Creates more pivots, making it suitable for identifying the smaller shifts in momentum on lower timeframes.
Raid Expiration & Validity
An SFP signal is not valid forever. The "Raid Expiration" setting determines how many SFP timeframe bars can pass after a raid before that signal is considered "stale" and can no longer be used to validate an SMT. This ensures your SMT divergences are always in response to recent liquidity sweeps.
Why You Must Be on the Right Chart Timeframe to See SMT Lines
Pine Script™ has a fundamental rule: an indicator running on a chart can only "see" the bars of that chart's timeframe or higher.
When the SMT logic is set to the 15-minute timeframe, it calculates its pivots based on 15-minute data. To accurately plot lines connecting these pivots, you must be on a 15-minute chart or lower (e.g., 5-minute, 1-minute).
If you are on a higher timeframe chart, like the 1-hour, the 15-minute bars do not exist on that chart, so the indicator has no bars to draw the lines on.
This is precisely why the alert system is so powerful. You can set your alert to run on the 15-minute timeframe, and TradingView's servers will monitor that timeframe for you, sending a notification regardless of what chart you are currently viewing.

Confluence Indicator: Fib, MACD, SMA 50/200This is a scalping indicator best used on the 1hour and 15min charts

Multi Time Frame Supporting Candles (with EMA/VWAP)Overview
This script provides a clean and, most importantly, correctly-scaled Multi-Time-Frame (MTF) analysis panel. It displays the candles of a higher timeframe (e.g., 1-hour candles while you are on a 5-minute chart) in a separate pane below your main chart.
Crucially, it solves a common Pine Script scaling issue, allowing you to plot indicators like EMA and VWAP from the higher timeframe alongside the candles without distorting the display. This tool is essential for traders who practice Multi-Time-Frame Analysis, helping you stay aware of the larger trend context while executing trades on a lower timeframe.

Momentum Adaptive RSI
Description of the Momentum Adaptive RSI Indicator:
The provided Pine Script implements a custom RSI-based trading indicator designed to identify momentum and trend direction by calculating the Relative Strength Index (RSI) with flexible smoothing options and adaptive or fixed overbought/oversold thresholds. Similar in spirit to the Gaussian Volatility Adjusted Indicator, this script focuses on smoothing price momentum using various moving average types (e.g., SMA, EMA, ALMA) and incorporates dynamic thresholding to generate clear buy and sell signals, making it suitable for trend-following, momentum trading, or reversal strategies.
How It Works
RSI Calculation:
Computes the RSI based on the closing price with a user-defined period (default: 10).
Optionally applies smoothing to the RSI using a selected moving average type (e.g., SMA, EMA, DEMA, TEMA, WMA, VWMA, SMMA, HMA, LSMA, or ALMA) with a configurable length (default: 10) and, for ALMA, a sigma parameter (default: 15).
Users can toggle smoothing on/off (default: enabled) to use either the raw RSI or the smoothed version.
Threshold Settings:
Fixed Thresholds: Default overbought (60) and oversold (50) levels can be set manually.
Adaptive Thresholds: Optionally calculates dynamic thresholds using the percentile method (default: 10th/90th percentiles) over a user-defined period (default: 50). This adapts the overbought/oversold levels based on the historical distribution of RSI values, improving responsiveness to market conditions.
Users can toggle between fixed and adaptive thresholds (default: fixed).
Signal Generation:
Buy Signal: Triggered when the RSI (smoothed or raw) crosses above the overbought threshold.
Sell Signal: Triggered when the RSI crosses below the oversold threshold.
A state-tracking mechanism ensures persistent signal states for consistent visualization.
Visual Representation:
RSI Plot: Displays the RSI (smoothed or raw) with dynamic coloring: green above the overbought threshold, red below the oversold threshold, and gray otherwise.
Threshold Lines: Plots the overbought and oversold levels (fixed or adaptive) and a middle line at 50 for reference.
Background and Bar Coloring: Applies user-defined colors (default: green for buy, red for sell) to the chart background and price bars based on the signal state, enhancing visual clarity for trading decisions.

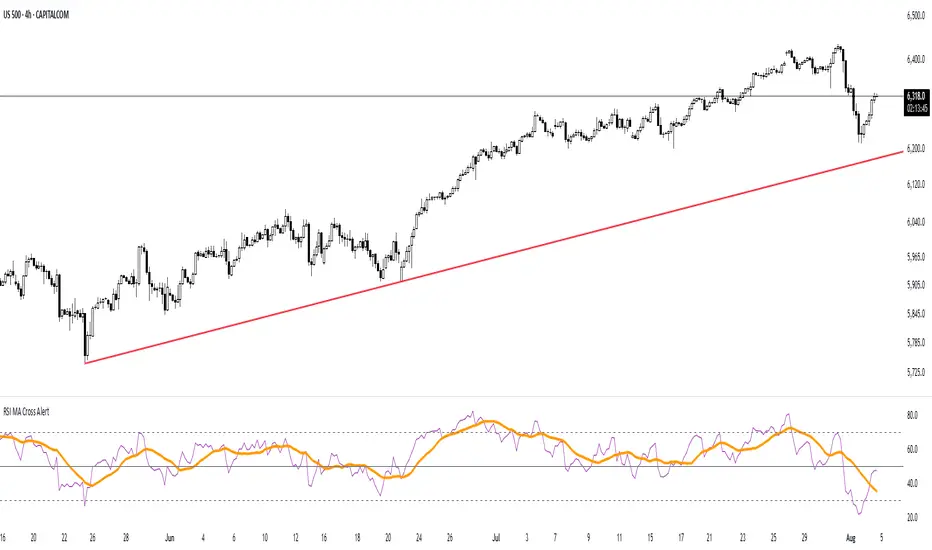
RSI MA Cross AlertAlerts when RSI-based Moving Average crosses above 50. Can be used on any symbol and timeframe. Displays RSI, RSI-MA, and levels 30/50/70.
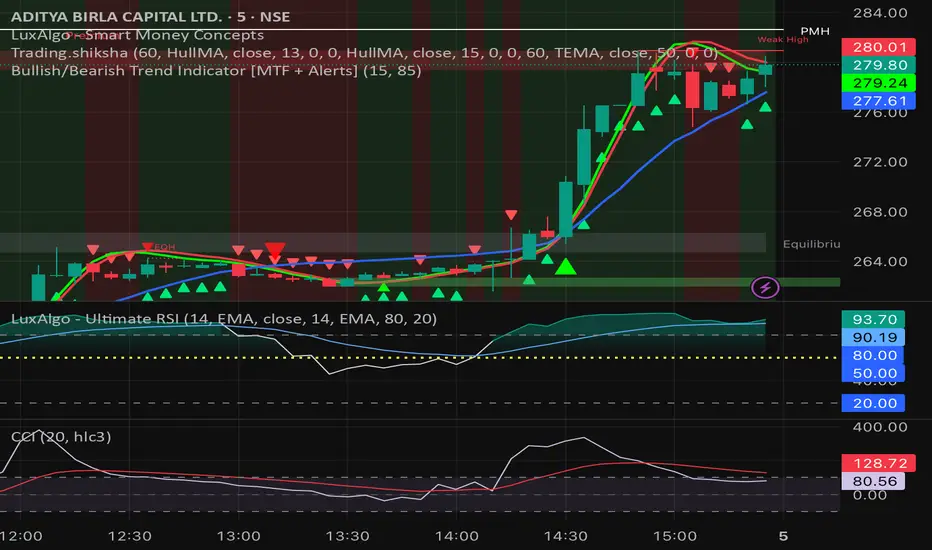
Bullish/Bearish Trend Indicator [MTF + Alerts] by Dow theory Summary of Logic:
✅ Bullish Trend:
Setup Bar: High > Previous High AND Low ≥ Previous Low
Confirmation Bar: High > Highest High of last 3 candles, Low ≥ Setup Bar Low
Trend Continues Until: Latest candle breaks 2nd last candle’s low → then trend becomes Bearish
🔻 Bearish Trend:
Setup Bar: Low < Previous Low AND High ≤ Previous High
Confirmation Bar: Low < Lowest Low of last 3 candles, High ≤ Setup Bar High
Trend Continues Until: Latest candle breaks 2nd last candle’s high → then trend becomes Bullish