Chart patterns
Volume Pressure Analysis - Live DataVolume Pressure Gauge and Volume Percentage Indicator – Pine Script Guide
This indicator provides a simplified, real-time visualization of both volume pressure (buy vs. sell activity) and today’s trading volume in comparison to historical averages. It is designed to help traders assess whether buyers or sellers dominate the current session and whether today’s volume is significant relative to recent behaviour.
________________________________________
Key Functional Segments
1. Inputs and Configuration
Users can configure the length of the Simple Moving Average (SMA) used to calculate average volume, set the position of the gauge table on the chart, and toggle the visibility of the volume pressure display. This allows flexibility in integrating the tool with various trading styles and chart layouts.
2. Volume Data Calculations
The indicator calculates three key volume metrics:
• volToday: The current day’s volume.
• volAvg: The average volume over the user-defined SMA period (default is 20 bars).
• volPct: The current volume as a percentage of the average.
This enables traders to quickly recognize whether current trading activity is above or below normal, which can be a precursor to potential trend strength or weakness.
3. Volume Pressure Calculation
The script estimates buying and selling pressure based on price movement and volume. It distributes volume into upward (buy) and downward (sell) segments and expresses them as percentages of the total volume. This gives an immediate sense of whether bulls or bears are more active in the current session.
4. Visual Representation (Progress Bars)
The indicator renders a simplified visual gauge using horizontal bar segments (pseudo-bars) to reflect the proportion of buy and sell pressure. The length of each bar correlates with the strength of pressure from buyers or sellers, helping users assess dominance without analyzing candlestick behavior in depth.
5. Table Display
A compact table is drawn on the chart showing:
• Buy pressure percentage and corresponding bar.
• Sell pressure percentage and corresponding bar.
• Volume percentage compared to the recent average.
This format makes it easy to evaluate volume dynamics at a glance, without cluttering the price chart or relying on separate overlays.
________________________________________
How Traders Benefit from This Indicator
• Momentum Shift Detection: Early signs of trend reversal can be observed when volume pressure flips direction.
• Breakout Validation: High volume combined with dominant pressure supports the credibility of breakout moves.
• False Move Avoidance: If price moves on low volume or mixed pressure, traders can avoid low-probability entries.
• Market Context Awareness: Users can assess whether a day is behaving normally in terms of participation or is unusually quiet or aggressive.
________________________________________
Basic Usage Guide
1. Add the script to your TradingView chart and set your preferred SMA length for volume comparison.
2. Customize the table’s position using the X and Y settings for clarity and alignment.
3. Interpret the outputs:
o A higher red bar indicates dominant sell pressure.
o A higher green bar indicates dominant buy pressure.
o Volume % above 100% suggests above-average activity, while values below 100% may imply low conviction.
4. Apply to trading decisions:
o High buy pressure and high volume may indicate a strong long opportunity.
o High sell pressure and high volume may support short setups.
o Low volume or conflicting signals may call for caution.
5. Combine with other tools such as trend indicators, support/resistance zones, or price action patterns for more reliable trade setups.
________________________________________
Practical Example
• Sell Pressure: 70% → Suggests strong seller control; potential for short setups.
• Buy Pressure: 30% → Weak buying interest; long trades may carry risk.
• Volume Percentage: 120% → Indicates a surge in participation; movement may have greater validity.
________________________________________
Tips for New Traders
• Use this indicator as a confirmation tool rather than a standalone strategy.
• Begin on higher timeframes (4-hour or daily) to develop familiarity.
• Compare multiple examples to identify reliable patterns over time.
• Always incorporate proper risk management, including stop losses.
________________________________________
Disclaimer from aiTrendview
This indicator is intended solely for educational and informational use. It does not constitute investment advice, trade signals, or financial recommendations. aiTrendview and its affiliates are not liable for any trading losses incurred through use of this tool. All trading involves risk. Past performance of any indicator does not guarantee future results. Users should conduct independent research and consult with a certified financial advisor before making any trading decisions.

Professional Technical Analysis DashboardProfessional Technical Analysis Dashboard – Complete Guide
This script is an advanced technical analysis dashboard built in Pine Script v5. It integrates 16 widely used technical indicators into a single, structured display designed for traders who need a consolidated view of market sentiment. The dashboard is divided into three key sections – Summary, Oscillators, and Moving Averages – enabling users to assess momentum, trends, and overall market bias in real-time.
________________________________________
Technical Foundation and Methodology
Summary Section – Combined Market Signal
The Summary section aggregates all 16 indicators (8 oscillators and 8 moving averages) to generate a combined score that reflects market sentiment. Each indicator contributes equally to the score. The combined signal ranges from -16 (strong sell) to +16 (strong buy), with thresholds defining zones such as Strong Buy, Buy, Neutral, Sell, and Strong Sell. This approach allows traders to quickly interpret overall market conditions without analyzing each indicator individually.
Oscillators Section – Momentum Analysis
This section tracks short-term momentum and overbought/oversold conditions using eight oscillators: RSI, Stochastic Oscillator, CCI, Williams %R, MACD, Momentum, Rate of Change (ROC), and Bollinger Bands. Each oscillator follows its conventional logic (e.g., RSI > 70 indicating overbought conditions) and is displayed alongside a visual indicator for quick assessment. This section is particularly effective for identifying potential reversals or timing short-term trades in range-bound markets.
Moving Averages Section – Trend Analysis
The trend analysis section uses five Simple Moving Averages (SMA 10, 20, 50, 100, 200) and three Exponential Moving Averages (EMA 10, 20, 50) to assess trend direction and strength across multiple timeframes. Price is compared to each moving average to determine a bullish, neutral, or bearish signal. For example, a price well above the 200-day SMA indicates a strong long-term uptrend.
________________________________________
How to Use the Dashboard
Setup:
1. Paste the script into TradingView’s Pine Editor.
2. Add it to your chart.
3. Choose a timeframe suited to your strategy (e.g., 5–15 minutes for scalping, 1 hour for day trading, daily for long-term analysis).
4. Configure visual preferences such as table size and color scheme from the settings menu.
Signal Interpretation:
• A "Strong Buy" in the Summary combined with bullish Oscillators and Moving Averages suggests a high-probability long setup.
• Conflicting signals (e.g., bullish Summary but bearish Oscillators) may warrant waiting for alignment before taking a position.
• Position sizing can be adjusted based on the intensity of the combined signals.
Trading Strategies:
• Confirmation Trading: Enter trades only when all three sections align in the same direction.
• Scalping: Use oscillators for overbought/oversold setups, combined with short-term moving averages for trend confirmation.
• Trend Following: Use the Moving Averages section to identify sustained directional bias and follow pullbacks signaled by oscillators.
________________________________________
Risk Management Guidelines
The dashboard is not a trading system but an analytical tool. Users can enhance their risk management by:
• Allocating capital based on signal strength (e.g., stronger signals justify slightly larger positions).
• Using stop losses tied to volatility or moving averages.
• Reducing position size during conflicting signals or low-confidence readings.
• Avoiding trades when signals are below 50% strength or in mixed zones.
________________________________________
Best Practices and Common Pitfalls
• Always wait for confirmation across sections before entering trades.
• Avoid over-leveraging based on a single signal.
• Use appropriate timeframes – intraday traders should rely on shorter timeframes, while swing traders may focus on hourly or daily charts.
• Keep a trading journal to monitor the effectiveness of signals and refine strategies over time.
________________________________________
Disclaimer from aiTrendview
This script is intended solely for educational and informational purposes. It does not provide investment advice, trading signals, or guaranteed outcomes. aiTrendview and its affiliates are not liable for any financial losses incurred while using this script. All trading involves risk, and past performance of any technical indicator does not guarantee future results. Users are strongly advised to conduct independent research or consult with a licensed financial advisor before making any trading decisions.

[PS]Breakout Strategy: Nifty/BN only at 15 min TimeframeIt only works on 15 min timeframe for nifty and Bank nifty.
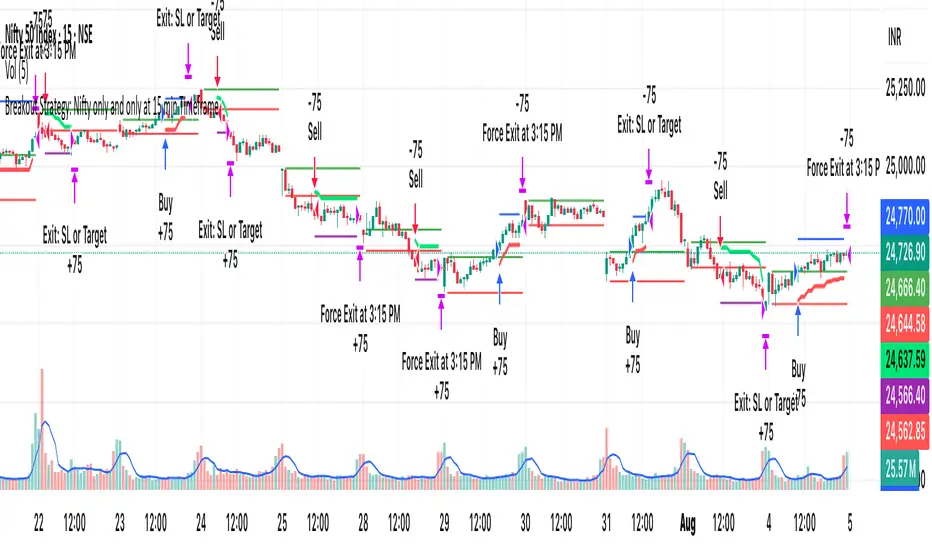
MOC Delta MOO Entry v21. Tracks the Daily Volume (9:30-4:00)
2. Measures the Delta of the MOC
3. Measures the percentage of Delta that was made during the MOC
4. If it is above/below 5/-5%, it begins looking for a trade.
5. When the 9:30 candle OPENS, it must be above the SMAs for a long, and it must be below the SMAs for a short.
6. If all conditions are met, it will enter a position on the CLOSE of the 9:30 candle (on the 5 minute, so enters at 9:35)

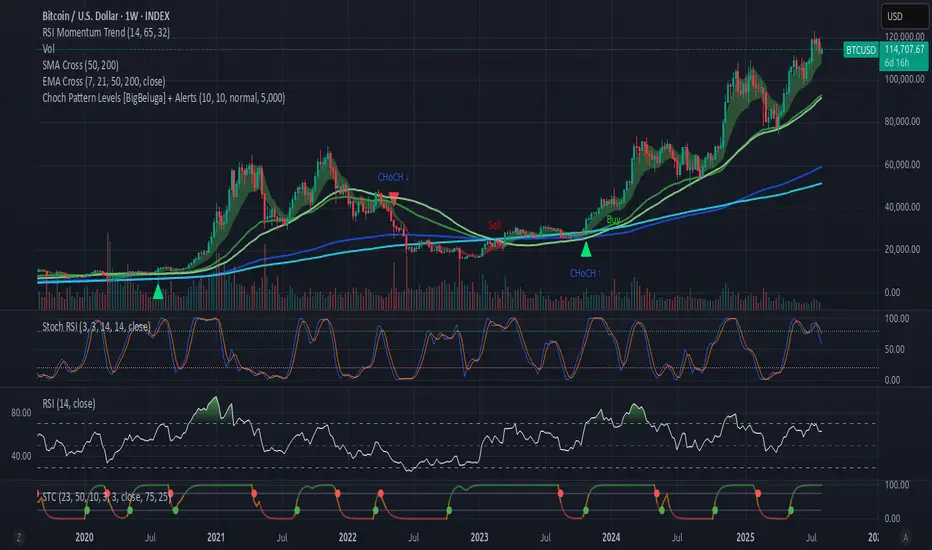
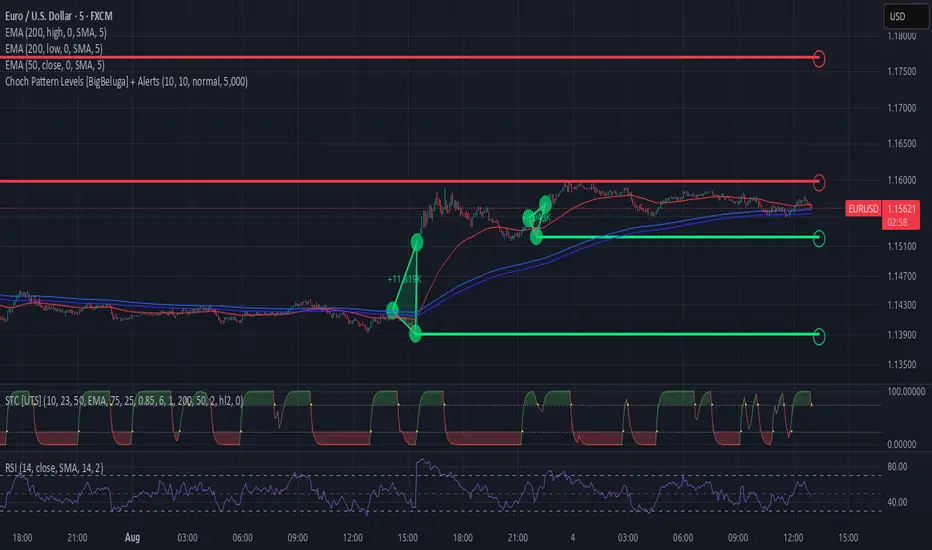
Choch Pattern Levels [BigBeluga] + AlertsThis version of Choch Pattern Levels includes built-in alert conditions for both ChoCh Up and ChoCh Down patterns. You can now set TradingView alerts directly when either pattern occurs, with optional visual markers (triangles) plotted on the chart.
Based on the original script by BigBeluga, licensed under CC BY-NC-SA 4.0. This is a modified version with alert conditions added.
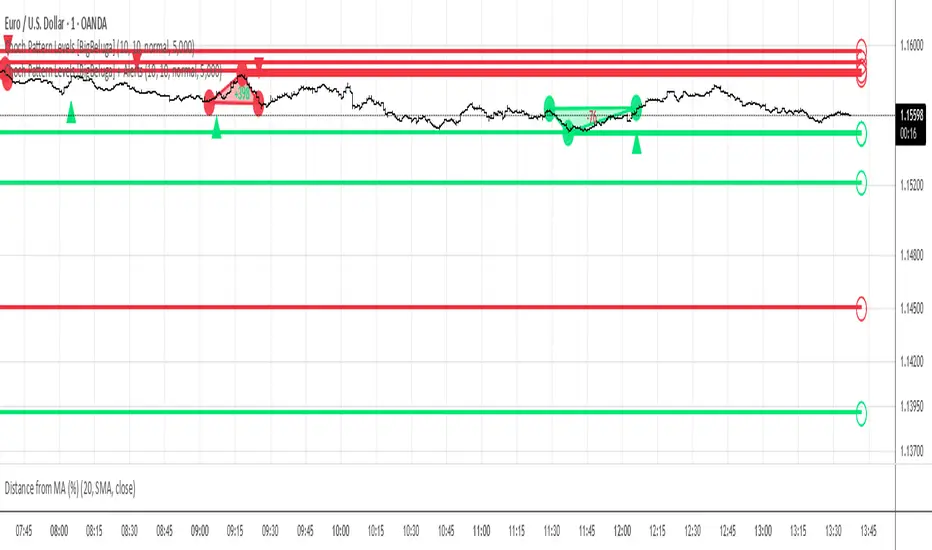
Choch Pattern Levels [BigBeluga] + AlertsChoch Pattern Levels highlights key structural breaks that can mark the start of new trends. By combining precise break detection with volume analytics and automatic cleanup, it provides actionable insights into the true intent behind price moves — giving traders a clean edge in spotting early reversals and key reaction zones. Added support for alarms.
Choch Pattern Levels [BigBeluga] + AlertsChoch Pattern Levels highlights key structural breaks that can mark the start of new trends. By combining precise break detection with volume analytics and automatic cleanup, it provides actionable insights into the true intent behind price moves — giving traders a clean edge in spotting early reversals and key reaction zones. Added alarms support.
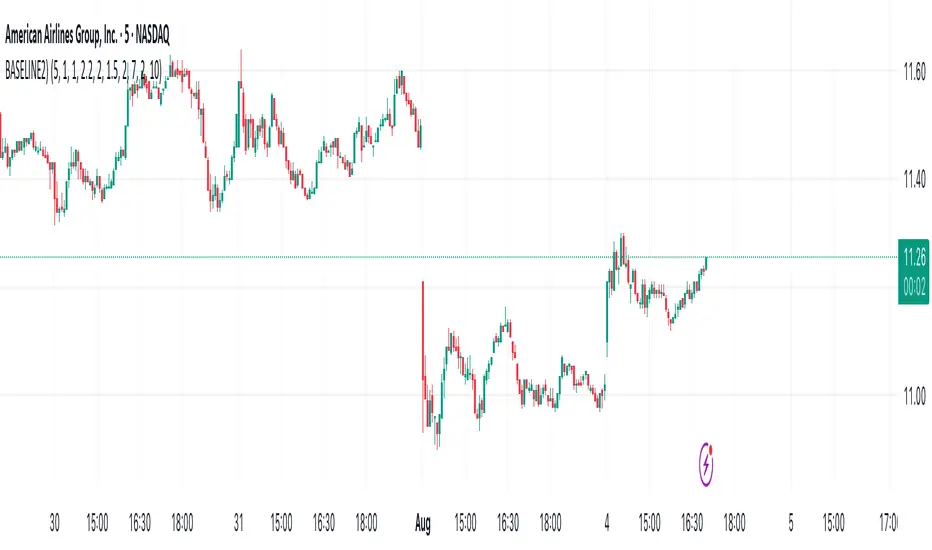
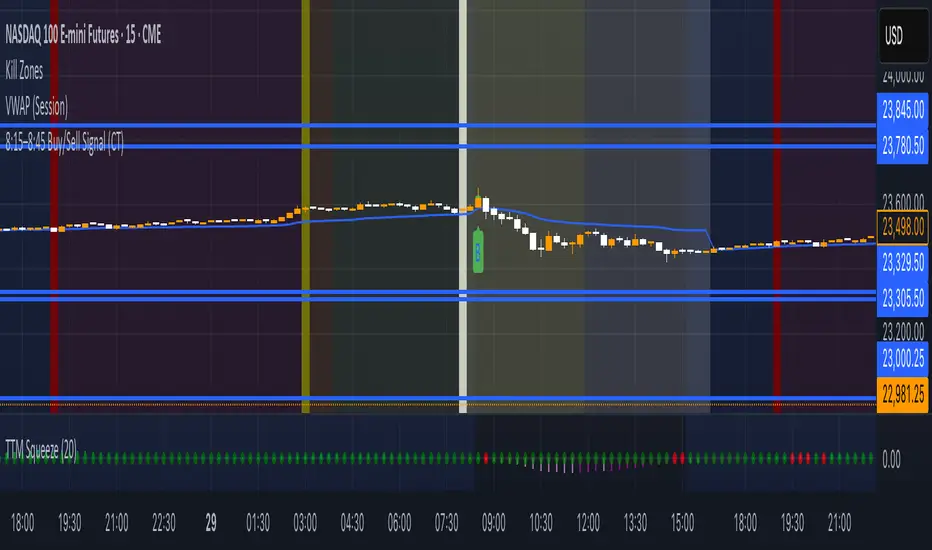
Simple VWAPPlots a simple Volume Weighted Average Price (VWAP) line with a thicker style for better visibility on the chart

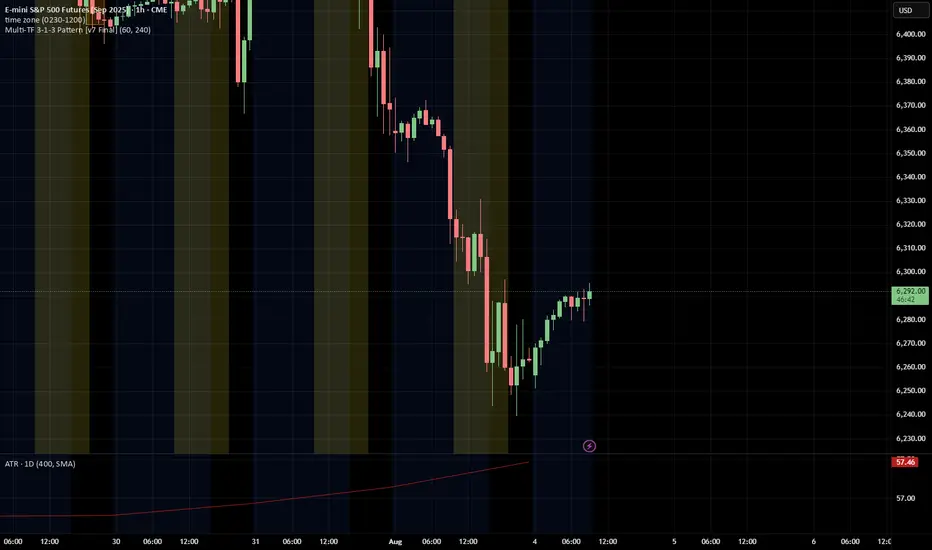
3-1-3 PatternThis Pine Script indicator analyzes and visualizes a specific candlestick pattern called the "3-1-3 Pattern" across multiple timeframes. Here's what it does:
Core Functionality
Pattern Detection: The script looks for a 7-bar candlestick pattern:
Bearish 3-1-3: 3 red candles + 1 green candle + 3 red candles
Bullish 3-1-3: 3 green candles + 1 red candle + 3 green candles
Visual Output
When a 3-1-3 pattern is detected, the script:
Creates a colored box around the middle bar (bar 3) of the pattern
Adds a small label showing the pattern type ("Bear 1H" or "Bull 4H", etc.)
Extends the box forward until the price breaks above the pattern's high or below its low
Pattern Management
The script actively manages the patterns by:
Tracking active patterns for each timeframe separately
Removing expired patterns when price breaks the pattern's high/low levels
Extending boxes to the current time to keep them visible
Practical Use
This indicator helps traders:
Spot reversal patterns across multiple timeframes simultaneously
See confluence when patterns align on different timeframes
Track pattern validity (boxes disappear when invalidated by price action)
Essentially, it's a multi-timeframe pattern recognition tool that automatically identifies and tracks these specific 7-bar reversal patterns on your chart.
Day Trading Strategy (With Risk Management)This is a day trading strategy based on fast and slow EMA crossovers combined with RSI filtering to enhance trade accuracy. Designed for intraday use, it generates buy signals when the fast EMA crosses above the slow EMA and sell signals when it crosses below, but only if the RSI confirms momentum is favorable to avoid false entries in choppy markets.
The strategy includes built-in risk management with configurable stop-loss and take-profit levels set at 1% by default, helping to limit losses and secure profits quickly within the trading day. Clear buy and sell signals are plotted on the chart, and alerts notify traders in real time when trading opportunities arise.
Ideal for short-term traders, this system provides a disciplined, mechanical approach to capturing intraday trends with momentum confirmation and essential risk controls. It is fully customizable to fit different day trading instruments, timeframes, and risk appetites.

ZKThe indicator checks the price entry into the 0.618-0.786 zone to the Fibonacci lines and gives a buy signal at the exit

15 Minute BangerThis strategy is for open market. 1:1 RR. It is based on market biased and will follow the trend of the market.
Benford's Law Actual [Tagstrading]Benford’s Law Chart — First Digit Analysis of Percentage Price Drops
This script visualizes the distribution of the leading digit in the percentage change of price drops, and compares it to the theoretical distribution expected by Benford’s Law.
It helps traders, analysts, and quants to detect anomalies, unnatural behavior, or price manipulation in any asset or timeframe.
How to Use
Add to any chart or symbol (stocks, crypto, FX, etc.) and select the timeframe you wish to analyze.
Set the “Number of Bars to Analyze” input (default: 500) to control the length of the historical window.
The chart will display, for the latest window:
A blue line: the actual leading-digit distribution for percentage price changes between bars.
A red line: the expected distribution per Benford’s Law.
Labels below and above: digit markers and the expected (theoretical) percentages.
Summary panel on the right: frequency counts and actual vs. theoretical % for each digit.
Interpretation:
If your actual (blue) curve or digit counts are significantly different from the red Benford’s Law curve, it could indicate unnatural price action, fraud, bot activity, or structural anomalies.
Why is this useful for TradingView?
Financial forensics: Benford’s Law is a classic tool for detecting data manipulation and fraud in accounting. On charts, it can reveal if price movements are statistically “natural.”
Transparency and confidence: Helps communities audit markets, brokers, or exchanges for irregularities.
Adaptable: Works on any market, any timeframe.
What makes this script unique?
Focuses on % price changes, not raw prices.
This provides a fair comparison across assets, symbols, and timeframes.
Measures only the direction and magnitude of drops/rises — more suitable for detecting manipulation in active markets.
Clear and customizable visualization:
The Benford line, actual data, and summary are all visible and readable in one glance.
Optimized for speed and clarity (runs efficiently on all major charts).
How is it different from stg44’s Benford’s Law script?
This script analyzes the leading digit of percentage price changes (i.e., how much the price drops or rises in %),
while the original by stg44 analyzes the leading digit of price itself.
Results are less sensitive to price scale and more comparable across volatile and non-volatile assets.
The summary panel clearly shows ( ) for actual and for Benford theoretical values.
Full code is commented and open for the community.
Credits and Inspiration
This script was inspired by “Benford’s Law” by stg44:
Thanks to the TradingView community for sharing powerful visual ideas.
—
By tags trading

SwingSignal RSI Overlay AdvancedSwingSignal RSI Overlay Advanced
By BFAS
This advanced indicator leverages the Relative Strength Index (RSI) to pinpoint critical market reversal points by highlighting key swing levels with intuitive visual markers.
Key Features:
Detects overbought and oversold levels with customizable RSI period and threshold settings.
Visually marks swing points:
Red star (HH) for Higher Highs.
Yellow star (LH) for Lower Highs.
Blue star (HL) for Higher Lows.
Green star (LL) for Lower Lows.
Connects swings with lines, aiding in the analysis of market structure.
Optimized for use on the main chart (overlay), tracking candles in real time.
This indicator provides robust visual support for traders aiming to identify price patterns related to RSI momentum, facilitating entry and exit decisions based on clear swing signals.

RSI Custom ADX VWAP Swing Signals Anmol Singh point.Anmol Singh
This indicator combines RSI, a custom ADX, VWAP, and Swing High/Low Break signals to identify potential buy and sell opportunities. It provides visual signals and alerts, helping traders spot trends and reversals more effectively on NASDAQ 1-minute charts.

caracalla ema long short signal📌 Indicator Name
caracalla ema long short signal
This script generates long and short trading signals using multiple technical indicators: EMAs, MACD, RSI, Stochastic, and volume.
🔧 Indicators Used
1. Exponential Moving Averages (EMA)
ema5, ema20, ema60, ema120 — used to determine overall trend direction.
2. Trend Confirmation (MA Alignment)
Bullish alignment: ema5 > ema20 > ema60 > ema120
Bearish alignment: ema5 < ema20 < ema60 < ema120
3. Crossover Signals
Golden Cross: ema5 crosses above ema20
Dead Cross: ema5 crosses below ema20
4. MACD
Standard parameters: 12, 26, 9
MACD Long: MACD line crosses above signal line
MACD Short: MACD line crosses below signal line
5. RSI & Stochastic
RSI(14): checks momentum
Stochastic (%K, %D)
Bullish: RSI > 50 and Stochastic %K crosses above %D
Bearish: RSI < 50 and Stochastic %K crosses below %D
6. Volume Filter
20-period simple average volume
Volume Up: Current volume > 120% of average
Volume Down: Current volume < 80% of average
✅ Signal Logic
📈 Long Signal (longSignal)
Triggered when 3 or more of the following are true:
EMA bullish alignment
Golden cross
MACD bullish crossover
RSI > 50 and Stochastic bullish crossover
High volume
📉 Short Signal (shortSignal)
Triggered when 3 or more of the following are true:
EMA bearish alignment
Dead cross
MACD bearish crossover
RSI < 50 and Stochastic bearish crossover
Low volume
📊 Visual Elements
Long Signal: Green “롱” label below the candle
Short Signal: Red “숏” label above the candle
EMA Lines:
EMA5 (Blue)
EMA20 (Orange)
EMA60 (Green)
EMA120 (Red)

Inside Bar With Alert - RajThis indicator helps you reduce your screen time by giving you consistent alerts on the formation of inside bar candle and it gives you bullish and bearish alerts on breakout of the mother candle. So if you believe in inside strategy this indicator will be helpful for you.

Adam Mancini ES Game Plan LevelsThis script plots Support & Resistance levels from Adam Mancini's newsletter.
You can copy and paste levels from Adam's Newsletter to Indicator settings.
You can also add custom text after the support level. For e.g 6550 : Your custom text

Inside Bar Breakout Alert - RajThis indicator is based on the inside bar strategy it help you to cut down your screen time by giving you constant alerts when a inside bar forms while also gives you alert on bullish and bearish break out of the mother candle.

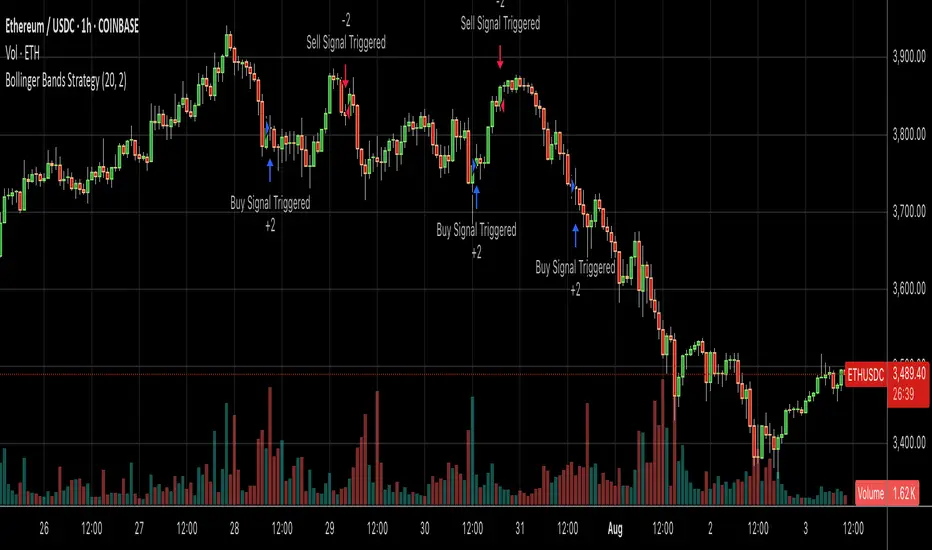
Bollinger Bands SMA 20_2 StrategyMean reversion strategy using Bollinger Bands (20-period SMA with 2.0 standard deviation bands).
Trade Triggers:
🟢 BUY SIGNAL:
When: Price crosses above the lower Bollinger Band
Logic: Price has hit oversold territory and is bouncing back
Action: Places a long position with stop at the lower band
🔴 SELL SIGNAL:
When: Price crosses below the upper Bollinger Band
Logic: Price has hit overbought territory and is pulling back
Action: Places a short position with stop at the upper band
Pradeep Vad - Quallamaggie Stock ScreenerBelow is a Pine Script that implements a custom stock screener based on your requirements. This script uses TradingView's Pine Script version 5 and allows you to screen stocks using the Pine Screener with the specified features and customization options.

Titan Wick Zone IndicatorThe Titan Wick Zone Indicator visually highlights the upper and lower wick regions of each candlestick on your chart, helping traders instantly identify areas where price was aggressively rejected (top wick) or absorbed (bottom wick). The indicator fills the area above the candle body to the wick high in red (sell zone), and the area below the candle body to the wick low in green (buy zone), both with adjustable opacity for clear visibility.
How to Use:
Spot Rejection and Absorption:
The red-filled upper wick zone marks where upward price moves were sharply rejected by sellers, often indicating supply, resistance, or “stop hunt” zones.
The green-filled lower wick zone marks where downward price moves were absorbed by buyers, pointing to potential demand, support, or accumulation zones.
Enhance Price Action Analysis:
Use these zones to avoid entering trades at price extremes, spot potential reversals, and find areas of confluence with support/resistance, Fibonacci levels, or order blocks.
Risk Management:
The indicator helps visualize where liquidity hunts or false breakouts may occur, so you can better place stop losses outside of volatile wick zones.
Ideal For:
Price action traders, scalpers, and swing traders seeking a visual edge in spotting supply/demand dynamics, liquidity zones, and wick-driven traps.
