Correlated ATR Bands | AdulariHow do I use it?
Never use this indicator as standalone trading signal, it should be used as confluence.
It is highly recommended to use this indicator on the 15m timeframe and above, try experimenting with the inverse feature and multipliers as well.
When the price is above the moving average this shows the bullish trend is strong.
When the price is below the moving average this shows the bearish trend is strong.
When the moving average is purple, the trend is bullish , when it is gray, the trend is bearish.
When price is above the upper band this may indicate a bearish reversal.
When price is below the lower band this may indicate a bullish reversal.
Features:
Purple line for bullish trend and gray line for bearish trend.
Custom formula combining an ATR and Hull MA to clearly indicate trend strength and direction.
Unique approach to moving averages and bands by taking the average of 2 types of MA's combined with custom ATR's, then multiplying these by correlation factors.
Bands to indicate possible trend reversals when price crosses them.
How does it work?
1 — ATR value is calculated, then the correlation between the source and ATR is calculated.
2 — Final value is calculated using the following formula:
correlation * atr + (1 - correlation) * nz(atr , atr)
3 — Moving average is calculated with the following formula:
ta.hma((1-(correlation/100*(1+weight/10)))*(ta.sma(source+value, smoothing)+ta.sma(source-value,smoothing))/2,flength)
4 — Bands calculation using multipliers.
Correlated

Overlay Mini Plot(s) of Correlated Asset(s)Overlay a small plot of a correlated asset of your choosing. Shrink/expand, Set vertical and horizontal position, plot multiple mini-plots via duplicate indicators with varied settings.
Plots the last X bars of any asset; including the live candle currently painting
Useful for low time frame trading when you want to see correlated asset price movement right alongside the price movement you're watching.
Useful for quick and simple comparisons; when you don't want the clutter of split screen or multi-pane view.
Useful for backtesting.
Price scale agnostic; just plots the shape of the recent price action, with several optional labels: Asset+timeframe | Live Price | Highest price over X bars | Lowest price over X bars.
Works fine with all the assets i've tested it on.
~~User inputs~~
-number of bars to paint.
-horizontal offset: plot to right X bars or to left X bars
-vertical offset: shift up or down, shrink or expand; by using 2 'spacer' inputs
-color/transparancy of candles and price labels.
-width (pixels) of candle bodies.
-choose to display price labels or not
-choose to display asset label or not
~~Tips~~
--Add several of these indicators; changing the vertical 'Shift/Shrink' settings on each to visually separate them.
--In the above chart or EurUsd, there are three indicators =>> three mini-plots overlaid: DXY, EurGbp and GbpUsd. Using the following settings for Space Above:Space Below: DXY- 0.1:4.5 | EurGbp- 1.8:1.8 | GbpUsd- 4.5:0.1
--the more you add, the more you'll have to vertically shrink the plots
© twingall

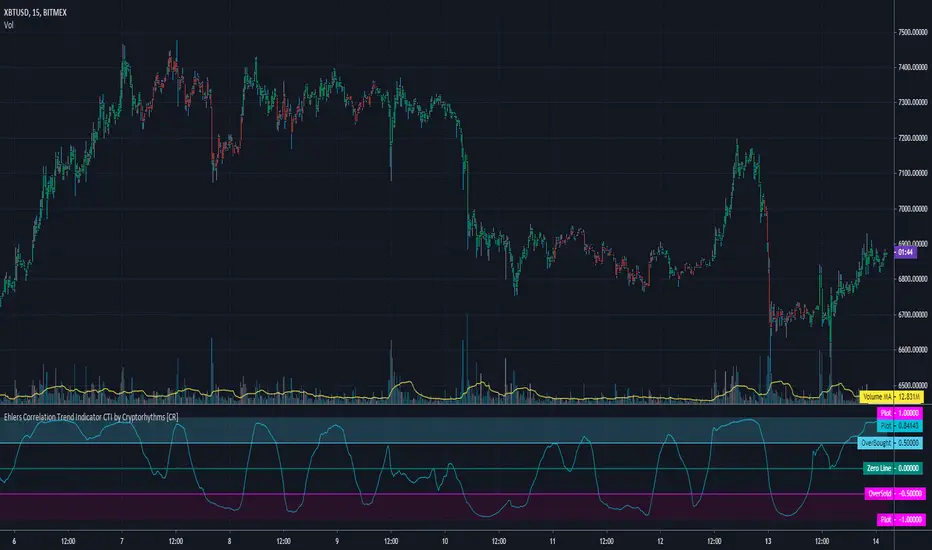
Ehlers Correlation Trend Indicator CTI by Cryptorhythms [CR]Ehlers Correlation Trend Indicator CTI by Cryptorhythms
📜Intro
In his article “Correlation As A Trend Indicator” in issue May 2020 of TASC, author John Ehlers introduces a new trend indicator that is based on the correlation between a security’s price history and the ideal trend: a straight line. He describes methods for using the indicator to not only identify the onset of new trends but to identify trend failures as well. He presents what looks like a simple and elegant idea for a trend-detection and mode-switching indicator.
📋Comments
Careful market selection may be the key to a correct application of the indicator. Even such barebone rules could shine with stocks like AAPL that tend to develop prolonged trends. But for others like CAT, which can keep oscillating in ranges for years, results will be much less impressive. They require a different approach. For example, you would want to buy when Correlation Trend falls significantly below zero and sell when it reaches positive values.
Therefore, it would be an interesting problem to research Correlation Trend’s ability to identify the switch to a cycle mode. That might help develop countertrend systems and
trade pullbacks. Another possible application might be to act as a system filter of change from trending mode to mean-reversion mode.
Extras
As usual when porting indicators to the library here on tradingview, I like to add some extra flare!
💠Customizable Overbought and Oversold Zones for Alert Creation
💠Bar coloration based on trade state for easy visual at a glance chart checking
💠Some basic example Entry and Exit conditions and a simple Trade State Engine to get you going creating your own strategy
Enjoy!
👍 We hope you enjoyed this indicator and find it useful! We post free crypto analysis, strategies and indicators regularly. This is our 81st script on Tradingview!
Function : Multiple Correlation
This script was written to calculate the correlation coefficient (Adjusted R-Squared) for one dependent and two independent variables.(3-way)
Pearson correlation method was used with exponential moving averages as the correlation calculation method.
Use your source ( i use "close" generally ) as the dependent variable.
Inspired by this article : www.real-statistics.com
The Adjusted R-Squared coefficient is used as output, but the R-Squared coefficient is also available in the code.
Adjusted R-Squared is often used for multiple correlations.
It also gives better results in large samples.
Here is the article about the difference of the two coefficients : www.investopedia.com
I wrote this function to increase the efficiency of my Dow Factor I used before.
When my research is over, I will apply the 3-factor correlation to my scripts.
I hope that I will achieve more efficient indicators and oscillators and even strategies.
In this command, I gave a few variable values and plotted them as an example.
I hope this function is useful in your work.
Finally, you can use periods as mutable variables.
The function is recovered from integer loads.
Best regards. Noldo

SpreadTrade - Distance (ps4 ver. 2)This script implements a rebrushed distance-based pair trading strategy. In this strategy, normally they trade the difference between the prices of two instruments. This difference is also called spread. Here, however we’ll trade the difference between two time frames of one instrument. And that's the main trick. Common procedure consists of the following steps:
1. Select two CORRELATED stocks. Here we'll use the same instrument in different TFs.
2. Generate the spread by calculating the difference between the prices/instruments. For distance based pair trading, we need to (rescale the data first and then) check the distance between them.
3. Define the logic to trade the spread and generate the trading signals. In this example we’ll calculate the rolling mean and rolling standard deviation of the spread. Whenever the spread goes above a rolling mean by one standard deviation, we’ll short the spread expecting the mean reversion behavior to hold true. And whenever the spread goes below its rolling mean by one standard deviation, we’ll go long on the spread.
Mind that the meaning of the orange and blue signals depends on whether tf variable is smaller or larger than the built-in timeframe.multiplier variable, i.e. tf of the chart.
For details see analyticsprofile.com
Donate: PayPal (paypal.me)
