ATR Stop-Loss with Fibonacci Take-Profit [jpkxyz]ATR Stop-Loss with Fibonacci Take-Profit Indicator
This comprehensive indicator combines Average True Range (ATR) volatility analysis with Fibonacci extensions to create dynamic stop-loss and take-profit levels. It's designed to help traders set precise risk management levels and profit targets based on market volatility and mathematical ratios.
Two Operating Modes
Default Mode (Rolling Levels)
In default mode, the indicator continuously plots evolving stop-loss and take-profit levels based on real-time price action. These levels update dynamically as new bars form, creating rolling horizontal lines across the chart. I use this mode primarily to plot the rolling ATR-Level which I use to trail my Stop-Loss into profit.
Characteristics:
Levels recalculate with each new bar
All selected Fibonacci levels display simultaneously
Uses plot() functions with trackprice=true for price tracking
Custom Anchor Mode (Fixed Levels)
This is the primary mode for precision trading. You select a specific timestamp (typically your entry bar), and the indicator locks all calculations to that exact moment, creating fixed horizontal lines that represent your actual trade levels.
Characteristics:
Entry line (blue) marks your anchor point
Stop-loss calculated using ATR from the anchor bar
Fibonacci levels projected from entry-to-stop distance
Lines terminate when price breaks through them
Includes comprehensive alert system
Core Calculation Logic
ATR Stop-Loss Calculation:
Stop Loss = Entry Price ± (ATR × Multiplier)
Long positions: SL = Entry - (ATR × Multiplier)
Short positions: SL = Entry + (ATR × Multiplier)
ATR uses your chosen smoothing method (RMA, SMA, EMA, or WMA)
Default multiplier is 1.5, adjustable to your risk tolerance
Fibonacci Take-Profit Projection:
The distance from entry to stop-loss becomes the base unit (1.0) for Fibonacci extensions:
TP Level = Entry + (Entry-to-SL Distance × Fibonacci Ratio)
Available Fibonacci Levels:
Conservative: 0.618, 1.0, 1.618
Extended: 2.618, 3.618, 4.618
Complete range: 0.0 to 4.764 (23 levels total)
Multi-Timeframe Functionality
One of the indicator's most powerful features is timeframe flexibility. You can analyze on one timeframe while using stop-loss and take-profit calculations from another.
Best Practices:
Identify your entry point on execution timeframe
Enable "Custom Anchor" mode
Set anchor timestamp to your entry bar
Select appropriate analysis timeframe
Choose relevant Fibonacci levels
Enable alerts for automated notifications
Example Scenario:
Analyse trend on 4-hour chart
Execute entry on 5-minute chart for precision
Set custom anchor to your 5-minute entry bar
Configure timeframe setting to "4h" for swing-level targets
Select appropriate Fibonacci Extension levels
Result: Precise entry with larger timeframe risk management
Visual Intelligence System
Line Behaviour in Custom Anchor Mode:
Active levels: Lines extend to the right edge
Hit levels: Lines terminate at the breaking bar
Entry line: Always visible in blue
Stop-loss: Red line, terminates when hit
Take-profits: Green lines (1.618 level in gold for emphasis)
Customisation Options:
Line width (1-4 pixels)
Show/hide individual Fibonacci levels
ATR length and smoothing method
ATR multiplier for stop-loss distance
D-ATR

FS JIMENEZ)FS JIMENEZ is a tactical breakout-retest strategy optimized for volatile price action and disciplined entries. It features:
• Swing structure validation
• Smart cooldown and price spacing logic
• SL compression after 3 bars
• Dynamic TP targeting based on candle strength and ATR
• Optional trailing SL via buffer multiplier
Built for traders seeking precision and controlled exposure across volati

Key Metrics Dashboard (Float, MCap, ATR) (ValueRay)This dashboard displays critical fundamental and volatility data, saving you from switching screens. It’s perfect for traders who need to quickly assess a stock's character, risk profile, and potential before making a move.
📊 Metrics Included
- Market Cap (MCap): Quickly gauge company size.
- Float: See tradable shares (color-coded for low-float stocks).
- Short %: Measure bearish sentiment and short-squeeze potential (color-coded).
- ATR % & ADR %: Understand true volatility to manage risk.
🚀 Key Features
- Fully Customizable: Toggle any metric on/off to create your ideal view.
- Flexible Layout: Choose your preferred on-chart position, size, and layout (horizontal or vertical).
- Lightweight & Clean: Get essential data without cluttering your chart.
If you find this indicator useful, please give it a Boost (🚀)!
Happy Trading

0.7x ATR (5m)5Minute ATR Length 14 times 0.7.
Great for scalping M1 Dow Jones counter trend and protrend.

ATR Buy, Target, Stop + OverlayATR Buy, Target, Stop + Overlay
This tool is to assist traders with precise trade planning using the Average True Range (ATR) as a volatility-based reference.
This script plots buy, target, and stop-loss levels on the chart based on a user-defined buy price and ATR-based multipliers, allowing for objective and adaptive trade management.
*NOTE* In order for the indicator to initiate plotted lines and table values a non-zero number must be entered into the settings.
What It Does:
Buy Price Input: Users enter a manual buy price (e.g., an executed or planned trade entry).
ATR-Based Target and Stop: The script calculates:
Target Price = Buy + (ATR × Target Multiplier)
Stop Price = Buy − (ATR × Stop Multiplier)
Customizable Timeframe: Optionally override the ATR timeframe (e.g., use daily ATR on a 1-hour chart).
Visual Overlay: Lines are drawn directly on the price chart for the Buy, Target, and Stop levels.
Interactive Table: A table is displayed with relevant levels and ATR info.
Customization Options:
Line Settings:
Adjust color, style (solid/dashed/dotted), and width for Buy, Target, and Stop lines.
Choose whether to extend lines rightward only or in both directions.
Table Settings:
Choose position (top/bottom, left/right).
Toggle individual rows for Buy, Target, Stop, ATR Timeframe, and ATR Value.
Customize text color and background transparency.
How to Use It for Trading:
Plan Your Trade: Enter your intended buy price when planning a trade.
Assess Risk/Reward: The script immediately visualizes the potential stop-loss and target level, helping assess R:R ratios.
Adapt to Volatility: Use ATR-based levels to scale stop and target dynamically depending on current market volatility.
Higher Timeframe ATR: Select a different timeframe for the ATR calculation to smooth noise on lower timeframe charts.
On-the-Chart Reference: Visually track trade zones directly on the price chart—ideal for live trading or strategy backtesting.
Ideal For:
Swing traders and intraday traders
Risk management and trade planning
Traders using ATR-based exits or scaling
Visualizing asymmetric risk/reward setups
How I Use This:
After entering a trade, adding an entry price will plot desired ATR target and stop level for visualization.
Adjusting ATR multiplier values assists in evaluating and planning trades.
Visualization assists in comparing ATR multiples to recent support and resistance levels.

Normalized Volume & True RangeThis indicator solves a fundamental challenge that traders face when trying to analyze volume and volatility together on their charts. Traditionally, volume and price volatility exist on completely different scales, making direct comparison nearly impossible. Volume might range from thousands to millions of shares, while volatility percentages typically stay within single digits. This indicator brings both measurements onto a unified scale from 0 to 100 percent, allowing you to see their relationship clearly for the first time.
The core innovation lies in the normalization process, which automatically calculates appropriate scaling factors for both volume and volatility based on their historical statistical properties. Rather than using arbitrary fixed scales that might work for one stock but fail for another, this system adapts to each instrument's unique characteristics. The indicator establishes baseline averages for both measurements and then uses statistical analysis to determine reasonable maximum values, ensuring that extreme outliers don't distort the overall picture.
You can choose from three different volatility calculation methods depending on your analytical preferences. The "Body" option measures the distance between opening and closing prices, focusing on the actual trading range that matters most for price action. The "High/Low" method captures the full daily range including wicks and shadows, giving you a complete picture of intraday volatility. The "Close/Close" approach compares consecutive closing prices, which can be particularly useful for identifying gaps and overnight price movements.
The indicator displays volume as colored columns that match your candlestick colors, making it intuitive to see whether high volume occurred during up moves or down moves. Volatility appears as a gray histogram, providing a clean background reference that doesn't interfere with volume interpretation. Both measurements are clipped at 100 percent, which represents their calculated maximum normal values, so any readings near this level indicate unusually high activity in either volume or volatility.
The baseline reference line shows you what "normal" volume looks like for the current instrument, helping you quickly identify when trading activity is above or below average. Optional moving averages for both volume and volatility are available if you prefer smoothed trend analysis over raw daily values. The entire system updates in real-time as new data arrives, continuously refining its statistical calculations to maintain accuracy as market conditions evolve.
This two-in-one indicator provides a straightforward way to examine how price movements relate to trading volume by presenting both measurements on the same normalized scale, making it easier to spot patterns and relationships that might otherwise remain hidden when analyzing these metrics separately.

ATR RopeATR Rope is inspired by DonovanWall's "Range Filter". It implements a similar concept of filtering out smaller market movements and adjusting only for larger moves. In addition, this indicator goes one step deeper by producing actionable zones to determine market state. (Trend vs. Consolidation)
> Background
When reading up on the Range Filter indicator, it reminded me exactly of a Rope stabilization drawing tool in a program I use frequently. Rope stabilization essentially attaches a fixed length "rope" to your cursor and an anchor point (Brush). As you move your cursor, you are pulling the brush behind it. The cursor (of course) will not pull the brush until the rope is fully extended, this behavior filters out jittery movements and is used to produce smoother drawing curves.
If compared visually side-by-side, you will notice that this indicator bears striking resemblance to its inspiration.
> Goal
Other than simply distinguishing price movements between meaningful and noise, this indicator strives to create a rigid structure to frame market movements and lack-there-of, such as when to anticipate trend, and when to suspect consolidation.
Since the indicator works based on an ATR range, the resulting ATR Channel does well to get reactions from price at its extremes. Naturally, when consolidating, price will remain within the channel, neither pushing the channel significantly up or down. Likewise, when trending, price will continue to push the channel in a single direction.
With the goal of keeping it quick and simple, this indicator does not do any smoothing of data feeds, and is simply based on the deviation of price from the central rope. Adjusting the rope when price extends past the threshold created by +/- ATR from the rope.
> Features & Behaviors
- ATR Rope
ATR Rope is displayed as a 3 color single line.
This can be considered the center line, or the directional line, whichever you'd prefer.
The main point of the Rope display is to indicate direction, however it also is factually the center of the current working range.
- ATR Rope Color
When the rope's value moves up, it changes to green (uptrend), when down, red (downtrend).
When the source crosses the rope, it turns blue (flat).
With these simple rules, we've formed a structure to view market movements.
- Consolidation Zones
Consolidation Zones generate from "Flat" areas, and extend into subsequent trend areas. Consolidation is simply areas where price has crossed the Rope and remains inside the range. Over these periods, the upper and lower values are accumulated and averaged together to form the "Consolidation Zone" values. These zones are draw live, so values are averaged as the flat areas progress and don't repaint, so all values seen historically are as they would appear live.
- ATR Channel
ATR Channel displays the upper and lower bounds of the working range.
When the source moves beyond this range, the rope is adjusted based on the distance from the source to the channel. This range can be extremely useful to view, but by default it is hidden.
> Application
This indicator is not created to provide signals, or serve as a "complete" system.
(People who didn't read this far will still comment for signals. :) )
This is created to be used alongside manual interpretation and intuition. This indicator is not meant to constrain any users into a box, and I would actually encourage an open mind and idea generation, as the application of this indicator can take various forms.
> Examples
As you would probably already know, price movement can be fast impulses, and movement can be slow bleeds. In the screenshot below, we are using movements from and to consolidation zones to classify weak trend and strong trend. As you can see, there are also areas of consolidation which get broken out of and confirmed for the larger moves.
Author's Note: In each of these examples, I have outlined the start and end of each session. These examples come from 1 Min Future charts, and have specifically been framed with day trading in mind.
"Breakout Retest" or "Support/Resistance Flips" or "Structure Retests" are all generally the same thing, with different traders referring to them by different names, all of which can be seen throughout these examples.
In the next example, we have a day which started with an early reversal leading into long, slow, trend. Notice how each area throughout the trend essentially moves slightly higher, then consolidates while holding support of the previous zone. This day had a few sharp movements, however there was a large amount of neutrality throughout this day with continuous higher lows.
In contrast to the previous example, next up, we have a very choppy day. Throughout which we see a significant amount of retests before fast directional movements. We also see a few examples of places where previous zones remained relevant into the future. While the zones only display into the resulting trend area, they do not become immediately meaningless once they stop drawing.
> Abstract
In the screenshot below, I have stacked 2 of these indicators, using the high as the source for one and the low as the source for the other. I've hidden lines of the high and low channels to create a 4 lined channel based on the wicks of price.
This is not necessary to use the indicator, but should help provide an idea of creative ways the simple indicator could be used to produce more complicated analysis.
If you've made it this far, I would hope it's clear to you how this indicator could provide value to your trading.
Thank you to DonovonWall for the inspiration.
Enjoy!

BK AK-Scope🔭 Introducing BK AK-Scope — Target Locked. Signal Acquired. 🔭
After building five precision weapons for traders, I’m proud to unveil the sixth.
BK AK-Scope — the eye of the arsenal.
This is not just an indicator. It’s an intelligence system for volatility, signal clarity, and rate-of-change dynamics — forged for elite vision in any market terrain.
🧠 Why “Scope”? And Why “AK”?
Every shooter knows: you can’t hit what you can’t see.
The Scope brings range, clarity, and target distinction. It filters motion from noise. Purpose from panic.
“AK” continues to honor the man who trained my sight — my mentor, A.K.
His discipline taught me to wait for alignment. To move with reason, not emotion.
His vision lives in every code line here.
🔬 What Is BK AK-Scope?
A Triple-Tier TSI Correlation Engine, fused with adaptive opacity logic, a volatility scoring system, and real-time signal clarity. It’s momentum dissected — by speed, depth, and rate of change.
Built to serve traders who:
Need visual hierarchy between fast, mid, and slow TSI responses.
Want adaptive fills that pulse with volatility — not static zones.
Require a volatility scoring overlay that reads the battlefield in real time.
⚙️ Core Systems: How BK AK-Scope Works
✅ Fast/Mid/Slow TSI →
Three layers of correlation: like scopes with zoom levels.
You track micro moves, mid swings, and macro flow simultaneously.
✅ Rate-of-Change Adaptive Opacity →
Momentum fills fade or flash based on speed — giving you movement density at a glance.
Bull vs. Bear zones adapt to strength. You feel the market’s pulse.
✅ Volatility Score Intelligence →
Custom algorithm measuring:
Range expansion
Rate-of-change differentials
ATR dynamics
Standard deviation pressure
All combined into a score from 0–100 with live icons:
🔥 = Extreme Heat (70+)
🧊 = Cold Zone (<30)
⚠️ = ROC Warning
• = Neutral drift
✅ Auto-Detect Volatility Modes →
Scalp = <15min
Swing = intraday/hourly
Macro = daily/weekly
Or override manually with total control.
🎯 How To Use BK AK-Scope
🔹 Trend Continuation → When all three TSI layers align in direction + volatility score climbs, ride with the trend.
🔹 Early Reversals → Opposing TSI + rapid opacity change + volatility shift = sniper reversal zone.
🔹 Consolidation Filter → Neutral fills + score < 30 = stay out, wait for signal surge.
🔹 Signal Confluence → Pair with:
• Gann fans or angles
• Fib time/price clusters
• Elliott Wave structure
• Harmonics or divergence
To isolate entry perfection.
🛡️ Why This Indicator Changes the Game
It's not just momentum. It’s TSI with depth hierarchy.
It’s not just color. It’s real-time strength visualization.
It’s not just volatility. It’s rate-weighted market intelligence.
This is market optics for the advanced trader — built for vision, clarity, and discipline.
🙏 Final Thoughts
🔹 In honor of A.K., my mentor. The man who taught me to see what others miss.
🔹 Inspired by the power of vision — because execution without clarity is chaos.
🔹 Powered by faith — because Gd alone gives sight beyond the visible.
“He gives sight to the blind and wisdom to the humble.” — Psalms 146
Every tool I build is a prayer in code — that it helps someone trade with clarity, integrity, and precision.
⚡ Zoom In. Focus Deep. Trade Clean.
BK AK-Scope — Lock on the target. See what others don’t.
🔫 Clarity is power. 🔫
Gd bless. 🙏
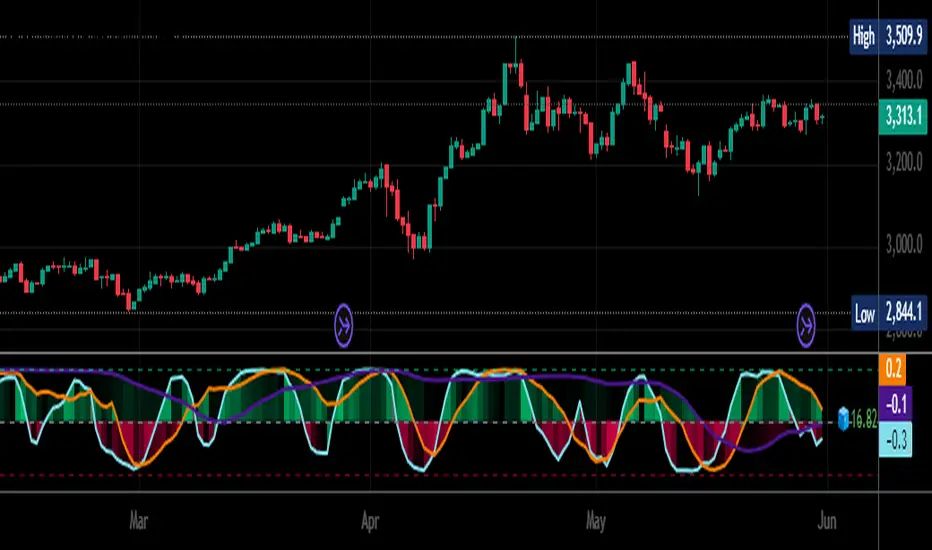
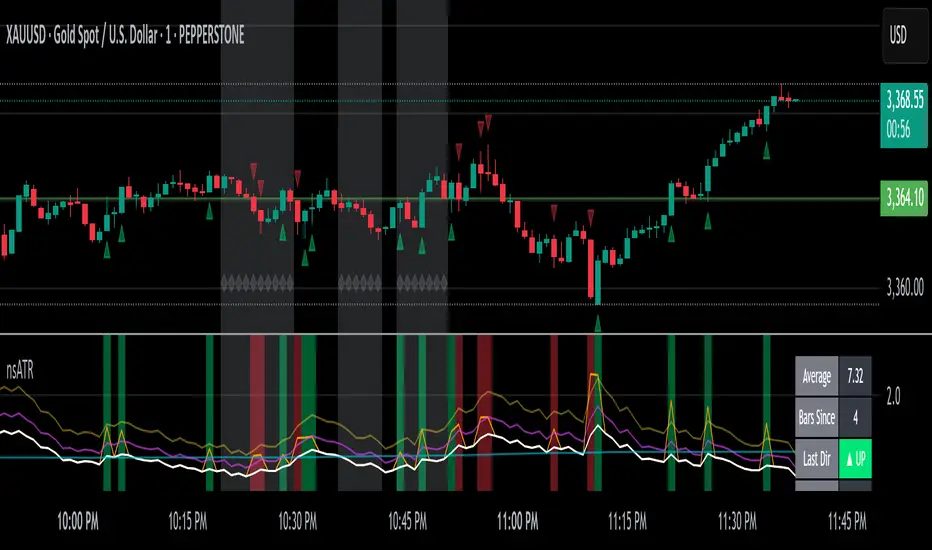
Not-So-Average True Range (nsATR)Not-So-Average True Range (nsATR)
*By Sherlock_MacGyver*
---
Long Story Short
The nsATR is a complete overhaul of traditional ATR analysis. It was designed to solve the fundamental issues with standard ATR, such as lag, lack of contextual awareness, and equal treatment of all volatility events.
Key innovations include:
* A smarter ATR that reacts dynamically when price movement exceeds normal expectations.
* Envelope zones that distinguish between moderate and extreme volatility conditions.
* A long-term ATR baseline that adds historical context to current readings.
* A compression detection system that flags when the market is coiled and ready to break out.
This indicator is designed for traders who want to see volatility the way it actually behaves — contextually, asymmetrically, and with predictive power.
---
What Is This Thing?
Standard ATR (Average True Range) has limitations:
* It smooths too slowly (using Wilder's RMA), which delays detection of meaningful moves.
* It lacks context — no way to know if current volatility is high or low relative to history.
* It treats all volatility equally, regardless of scale or significance.
nsATR** was built from scratch to overcome these weaknesses by applying:
* Amplification of large True Range spikes.
* Visual envelope zones for detecting volatility regimes.
* A long-term context line to anchor current readings.
* Multi-factor compression analysis to anticipate breakouts.
---
Core Features
1. Breach Detection with Amplification
When True Range exceeds a user-defined threshold (e.g., ATR × 1.2), it is amplified using a power function to reflect nonlinear volatility. This amplified value is then smoothed and cascades into future ATR values, affecting the indicator beyond a single bar.
2. Direction Tagging
Volatility spikes are tagged as upward or downward based on basic price momentum (close vs previous close). This provides visual context for how volatility is behaving in real-time.
3. Envelope Zones
Two adaptive envelopes highlight the current volatility regime:
* Stage 1: Moderate volatility (default: ATR × 1.5)
* Stage 2: Extreme volatility (default: ATR × 2.0)
Breaching these zones signals meaningful expansion in volatility.
4. Long-Term Context Baseline
A 200-period simple moving average of the classic ATR establishes whether current readings are above or below long-term volatility expectations.
5. Multi-Signal Compression Detection
Flags potential breakout conditions when:
* ATR is below its long-term baseline
* Price Bollinger Bands are compressed
* RSI Bollinger Bands are also compressed
All three signals must align to plot a "Volatility Confluence Dot" — an early warning of potential expansion.
---
Chart Outputs
In the Indicator Pane:
* Breach Amplified ATR (Orange line)
* Classic ATR baseline (White line)
* Long-Term context baseline (Cyan line)
* Stage 1 and Stage 2 Envelopes (Purple and Yellow lines)
On the Price Chart:
* Triangles for breach direction (green/red)
* Diamonds for compression zones
* Optional background coloring for visual clarity
---
Alerts
Built-in alert conditions:
1. ATR breach detected
2. Stage 1 envelope breached
3. Stage 2 envelope breached
4. Compression zone detected
---
Customization
All components are modular. Traders can adjust:
* Display toggles for each visual layer
* Colors and line widths
* Breach threshold and amplification power
* Envelope sensitivity
* Compression sensitivity and lookback windows
Some options are disabled by default to reduce clutter but can be turned on for more aggressive signal detection.
---
Real-Time Behavior (Non-Repainting Clarification)
The indicator updates in real time on the current bar as new data comes in. This is expected behavior for live trading tools. Once a bar closes, values do not change. In other words, the indicator *does not repaint history* — but the current bar can update dynamically until it closes.
---
Use Cases
* Day traders: Use compression zones to anticipate volatility surges.
* Swing traders: Use envelope breaches for regime awareness.
* System developers: Replace standard ATR in your logic for better responsiveness.
* Risk managers: Use directional volatility signals to better model exposure.
---
About the Developer
Sherlock_MacGyver develops original trading systems that question default assumptions and solve real trader problems.
MACD + RSI + EMA + BB + ATR Day Trading StrategyEntry Conditions and Signals
The strategy implements a multi-layered filtering approach to entry conditions, requiring alignment across technical indicators, timeframes, and market conditions .
Long Entry Requirements
Trend Filter: Fast EMA (9) must be above Slow EMA (21), price must be above Fast EMA, and higher timeframe must confirm uptrend
MACD Signal: MACD line crosses above signal line, indicating increasing bullish momentum
RSI Condition: RSI below 70 (not overbought) but above 40 (showing momentum)
Volume & Volatility: Current volume exceeds 1.2x 20-period average and ATR shows sufficient market movement
Time Filter: Trading occurs during optimal hours (9:30-11:30 AM ET) when market volatility is typically highest
Exit Strategies
The strategy employs multiple exit mechanisms to adapt to changing market conditions and protect profits :
Stop Loss Management
Initial Stop: Placed at 2.0x ATR from entry price, adapting to current market volatility
Trailing Stop: 1.5x ATR trailing stop that moves up (for longs) or down (for shorts) as price moves favorably
Time-Based Exits: All positions closed by end of trading day (4:00 PM ET) to avoid overnight risk
Best Practices for Implementation
Settings
Chart Setup: 5-minute timeframe for execution with 15-minute chart for trend confirmation
Session Times: Focus on 9:30-11:30 AM ET trading for highest volatility and opportunity

SOXL Trend Surge v3.0.2 – Profit-Only RunnerSOXL Trend Surge v3.0.2 – Profit-Only Runner
This is a trend-following strategy built for leveraged ETFs like SOXL, designed to ride high-momentum waves with minimal interference. Unlike most short-term scalping scripts, this model allows trades to develop over multiple days to even several months, capitalizing on the full power of extended directional moves — all without using a stop-loss.
🔍 How It Works
Entry Logic:
Price is above the 200 EMA (long-term trend confirmation)
Supertrend is bullish (momentum confirmation)
ATR is rising (volatility expansion)
Volume is above its 20-bar average (liquidity filter)
Price is outside a small buffer zone from the 200 EMA (to avoid whipsaws)
Trades are restricted to market hours only (9 AM to 2 PM EST)
Cooldown of 15 bars after each exit to prevent overtrading
Exit Strategy:
Takes partial profit at +2× ATR if held for at least 2 bars
Rides the remaining position with a trailing stop at 1.5× ATR
No hard stop-loss — giving space for volatile pullbacks
⚙️ Strategy Settings
Initial Capital: $500
Risk per Trade: 100% of equity (fully allocated per entry)
Commission: 0.1%
Slippage: 1 tick
Recalculate after order is filled
Fill orders on bar close
Timeframe Optimized For: 45-minute chart
These parameters simulate an aggressive, high-volatility trading model meant for forward-testing compounding potential under realistic trading costs.
✅ What Makes This Unique
No stop-loss = fewer premature exits
Partial profit-taking helps lock in early wins
Trailing logic gives room to ride large multi-week moves
Uses strict filters (volume, ATR, EMA bias) to enter only during high-probability windows
Ideal for leveraged ETF swing or position traders looking to hold longer than the typical intraday or 2–3 day strategies
⚠️ Important Note
This is a high-risk, high-reward strategy meant for educational and testing purposes. Without a stop-loss, trades can experience deep drawdowns that may take weeks or even months to recover. Always test thoroughly and adjust position sizing to suit your risk tolerance. Past results do not guarantee future returns. Backtest range: May 8, 2020 – May 23, 2025

True Range eXpansion🕯️ TRX — True Range eXpansion
Clean Candle Bodies · Volatility Bands · Adaptive Range Envelope System
Not your grandfather’s candles. Not your brokerage’s bands.
----------------------------------------------------
TRX begins with a simple concept: visualize the true range of every candle, without the noise of flickering wicks.
From there, it grows into a fully adaptive price visualization framework.
What started as a candle-only visualizer evolved into a modular, user-controlled price engine.
From wickless candle clarity to dynamic volatility envelopes, TRX adapts to you.
There are plenty of band and channel indicators out there — Bollinger, Keltner, Donchian, Envelope, the whole crew.
But none of them are built on the true candle range, adaptive ATR shaping, and full user control like TRX.
This isn’t just another indicator — it’s a new framework.
Most bands and channels are based on close price and statistical deviation — useful, but limited.
TRX uses the full true range of each candle as its foundation, then applies customizable smoothing and directional ATR scaling to form a dynamic, volatility-reactive envelope.
The result? Bands that breathe with the market — not lag behind it.
----------------------------------------------------
🔧 Core Features:
🕯️ True Range Candles — Each candle is plotted from low to high, body-only, colored by open/close.
📈 Adjustable High/Low Moving Averages — Select your smoothing style: SMA, EMA, WMA, RMA, or HMA.
🌬️ ATR-Based Expansion — Bands dynamically breathe based on market volatility.
🔀 Per-Band Multipliers — Fine-tune expansion individually for the upper and lower bands.
⚖️ Basis Line — Optional centerline between bands for structure tracking and equilibrium zones.
🎛️ Full Visual Control — Width, transparency, color, on/off toggles for each element.
----------------------------------------------------
🧠 Default Use Case:
With the included default settings, TRX behaves like an evolved Bollinger Band system — based on True Range candle structure, not just close price and standard deviation.
----------------------------------------------------
🔄 How to Zero Out the Bands (for Minimalist Use):
Want just candles? A clean MA? Single band? You got it.
➤ Use TRX like a clean moving average:
• Set ATR Multiplier to 0
• Set both Band ATR Adjustments to 0
• Leave the Basis Line ON or OFF — your call
➤ Show only candles (no bands at all):
• Turn off "Show High/Low MAs"
• Turn off Basis Line
➤ Single-line ceiling or floor tracking:
• Set one band’s Transparency to 100
• Use the remaining band as a price envelope or support/resistance guide
----------------------------------------------------
🧬 Notes:
TRX can be made:
• Spiky or silky (via smoothing & ATR)
• Wide or tight (via multipliers)
• Subtle or aggressive (via color/transparency)
• Clean as a compass or dirty as a chaos meter
Built by accident. Tuned with intention.
Released to the world as one of the most adaptable and expressive visual overlays ever made.
Created by Sherlock_MacGyver

Range Progress TrackerRANGE PROGRESS TRACKER(RPT)
PURPOSE
This indicator helps traders visually and statistically understand how much of the typical price range (measured by ATR) has already been covered in the current period (Daily, Weekly, or Monthly). It includes key features to assist in trend exhaustion analysis, reversal spotting, and smart alerting.
CORE LOGIC
The indicator calculates the current range of the selected time frame (e.g., Daily), which is:
Current Range = High - Low
This is then compared to the ATR (Average True Range) of the same time frame, which represents the average price movement range over a defined period (default is 14).
The comparison is expressed as a percentage, calculated with this formula:
Range % = (Current Range / ATR) × 100
This percentage shows how much of the “average expected move” has already occurred.
WHY IT MATTERS
When the current range approaches or exceeds 100% of ATR, it means the price has already moved as much as it typically does in a full session.
This indicates a lower probability of continuing the trend with a new high or low, especially when the price is already near the session's high or low.
This setup can signal:
A possible consolidation phase
A reversal in trend
The market entering a corrective phase
SMART ALERTS
The indicator can alert you when:
A new high is made after the range percentage exceeds your set threshold.
A new low is made after the range percentage exceeds your set threshold.
You can adjust the Range % Alert Threshold in the settings to tailor it to your trading style.

Realtime ATR-Based Stop Loss Numerical OverlayRealtime ATR-Based Stop Loss Numerical Overlay
A simple, effective tool for dynamic risk management based on ATR (Average True Range) without adding cluttered and distracting lines all over your chart.
📌 Description
This script plots a real-time stop loss level using the Average True Range (ATR) on your chart, helping you set consistent, volatility-based stops. It supports both:
✅ Current chart timeframe
✅ Custom fixed timeframe inputs (1m, 5m, 15m, 1h, etc.)
The stop level is calculated as:
Stop = ATR × Multiplier
and updates in real-time. An overlay table displays on the bottom-right of your chart with the calculated stop value in a clean, simple way.
⚙️ Settings
ATR Timeframe Source:
Choose between using the current chart's timeframe or a fixed one (e.g. 5, 15, 60, D, etc).
ATR Length:
Period used to calculate the ATR (default is 14).
Stop Loss Multiplier:
Multiplies the ATR value to define your stop (e.g., 1.5 × ATR).
Wait for Timeframe Closes:
If enabled, the ATR value waits for the selected timeframe’s candle to close before updating. If unselected, it will update in real time.
🛠️ How to Use
Add this script to your chart from your indicators list.
Configure your desired timeframe, ATR length, and multiplier in the settings panel.
Use the value shown in the table overlay as your suggested stop loss distance from entry.
Adjust your position sizing accordingly to fit your risk tolerance.
This tool is especially useful for traders looking for adaptive risk management that evolves with market volatility — whether scalping intraday or swing trading.
💡 Pro Tip
The ATR stop can also be used to dynamically trail your stop behind price movement.

Momentum Long + Short Strategy (BTC 3H)Momentum Long + Short Strategy (BTC 3H)
🔍 How It Works, Step by Step
Detect the Trend (📈/📉)
Calculate two moving averages (100-period and 500-period), either EMA or SMA.
For longs, we require MA100 > MA500 (uptrend).
For shorts, we block entries if MA100 exceeds MA500 by more than a set percentage (to avoid fading a powerful uptrend).
Apply Momentum Filters (⚡️)
RSI Filter: Measures recent strength—only allow longs when RSI crosses above its smoothed average, and shorts when RSI dips below the oversold threshold.
ADX Filter: Gauges trend strength—ensures we only enter when a meaningful trend exists (optional).
ATR Filter: Confirms volatility—avoids choppy, low-volatility conditions by requiring ATR to exceed its smoothed value (optional).
Confirm Entry Conditions (✅)
Long Entry:
Price is above both MAs
Trend alignment & optional filters pass ✅
Short Entry:
Price is below both MAs and below the lower Bollinger Band
RSI is sufficiently oversold
Trend-blocker & ATR filter pass ✅
Position Sizing & Risk (💰)
Each trade uses 100 % of account equity by default.
One pyramid addition allowed, so you can scale in if the move continues.
Commission and slippage assumptions built in for realistic backtests.
Stops & Exits (🛑)
Long Stop-Loss: e.g. 3 % below entry.
Long Auto-Exit: If price falls back under the 500-period MA.
Short Stop-Loss: e.g. 3 % above entry.
Short Take-Profit: e.g. 4 % below entry.
🎨 Why It’s Powerful & Customizable
Modular Filters: Turn on/off RSI, ADX, ATR filters to suit different market regimes.
Adjustable Thresholds: Fine-tune stop-loss %, take-profit %, RSI lengths, MA gaps and more.
Multi-Timeframe Potential: Although coded for 3 h BTC, you can adapt it to stocks, forex or other cryptos—just recalibrate!
Backtest Fine-Tuned: Default settings were optimized via backtesting on historical BTC data—but they’re not guarantees of future performance.
⚠️ Warning & Disclaimer
This strategy is for educational purposes only and designed for a toy fund. Crypto markets are highly volatile—you can lose 100 % of your capital. It is not a predictive “holy grail” but a rules-based framework using past data. The parameters have been fine-tuned on historical data and are not valid for future trades without fresh calibration. Always practice with paper-trading first, use proper risk management, and do your own research before risking real money. 🚨🔒
Good luck exploring and experimenting! 🚀📊

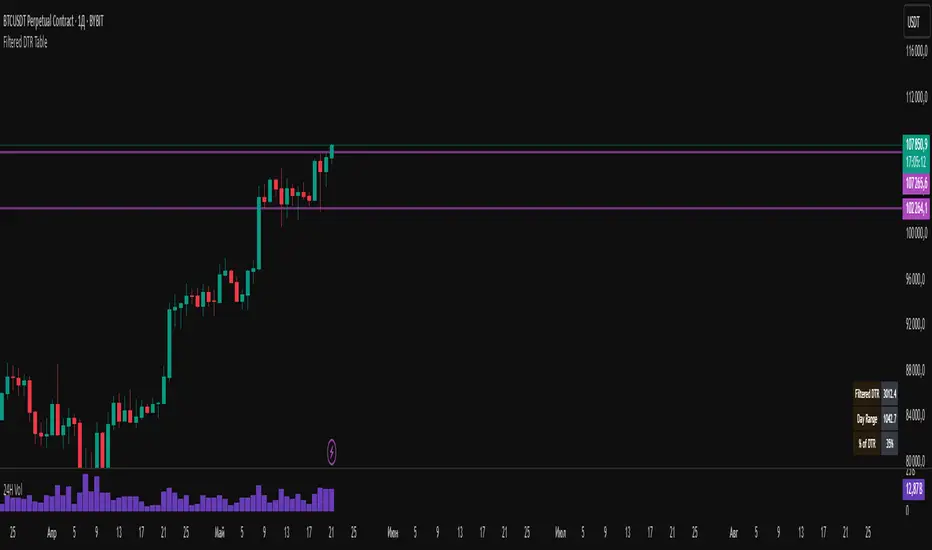
Filtered DTR Table📊 Filtered Daily True Range (DTR) Indicator
This indicator calculates and displays a filtered version of the Daily True Range (DTR) over the last 14 trading days, using high and low prices of each day.
It filters out extreme values by excluding any daily range that is:
Less than 0.5× the average range
Greater than 2× the average range
The indicator shows a table in the bottom-right corner of the main chart, containing:
Filtered ATR – The average of valid (filtered) daily ranges over the past 14 days, based on the high-low difference.
Current Day's Range – The high-low range of the current trading day.
% of ATR – How much of the filtered ATR has been covered by today's range, expressed as a whole number percentage.
Filt ADR🟠 Script Name: Filtered Average Daily Range (Filt ADR)
This script calculates a filtered version of the Average Daily Range (ADR) based on the last 14 daily candles. It's designed to reduce the influence of unusually high or low daily ranges (outliers) by applying a filter before calculating the average.
🔧 How It Works — Step by Step
1. Calculate Daily Ranges (High - Low)
It retrieves the daily price ranges (difference between daily high and low) for the last 14 days using request.security() with the "D" (daily) timeframe.
pinescript
Копировать
Редактировать
high - low // today's daily range
high - low // yesterday's daily range
...
These values are stored into individual variables dr0 to dr13.
2. Build an Array of Daily Ranges
An array named ranges is used to store the 14 daily ranges, but only if they are not na (missing data). This avoids errors during processing.
3. Calculate the Initial (Unfiltered) Average Range
The script sums all values in the ranges array and calculates their average:
pinescript
Копировать
Редактировать
avg_all = total sum of ranges / number of valid entries
4. Filter Out Outliers
Now it filters the values in ranges:
Only keeps the ranges that are between 0.5×avg_all and 2×avg_all.
This is to remove abnormally small or large daily ranges that could distort the average.
The filtered values are added to a second array called filtered.
5. Calculate the Filtered ADR
Finally, it calculates the average of the filtered daily ranges:
pinescript
Копировать
Редактировать
avg_filt = sum of filtered ranges / number of filtered values
This is the Filtered ADR.
6. Plot the Result
The result (avg_filt) is plotted as an orange line on the chart. It updates on each bar (depending on the current timeframe you're viewing) but the underlying data is based on the last 14 daily candles.
pinescript
Копировать
Редактировать
plot(avg_filt, title="Filtered ADR", color=color.orange, linewidth=2)
✅ Use Case
This script is useful for traders who use the Average Daily Range (ADR) to:
Estimate expected price movement during a day
Set volatility-based stop-loss or take-profit levels
Identify days with unusually high or low volatility
By filtering out extreme values, it provides a more stable and reliable estimate of daily volatility.

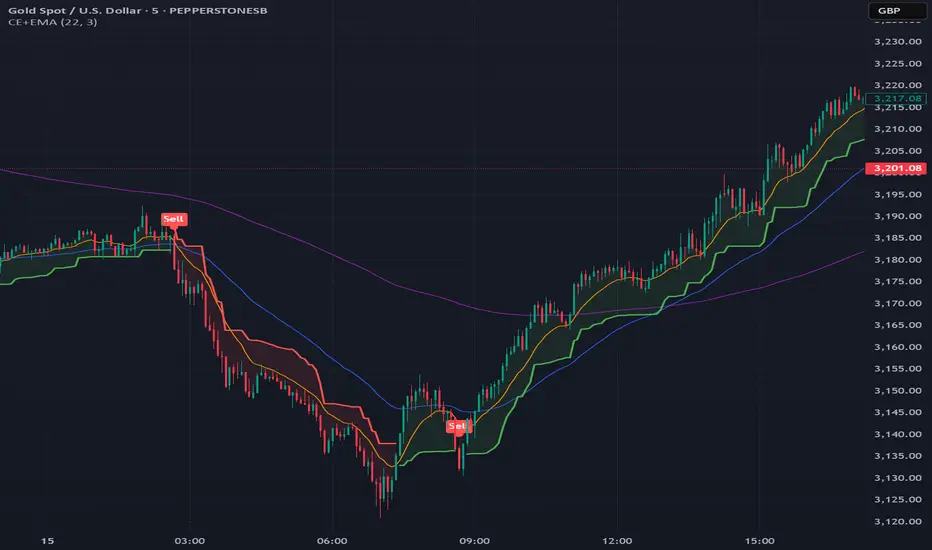
Chandelier Exit + EMA Filtered SignalsThis script is a powerful upgrade to the original Chandelier Exit by Alex Orekhov (everget), combining trend-following logic with higher-quality trade filtering.
✅ Key Features:
Chandelier Exit logic with ATR-based stop levels
Buy/Sell signals only when trend is confirmed:
Buy: Price must be above EMA 13, 50, and 200
Sell: Price must be below EMA 13, 50, and 200
Candle highlighting: Green for Buy, Red for Sell
Signal labels for visual clarity
Toggle to show/hide EMAs
Built-in alerts for:
Buy signal
Sell signal
Trend direction change
🛠️ Inputs:
ATR Period and Multiplier
Toggle: Use Close Price for High/Low Calculation
Toggle: Show/Hide Labels and State Highlight
Toggle: Show/Hide EMA 13, 50, 200
Toggle: Await confirmed bar for alerts
🔔 Alerts Included:
Chandelier Exit Buy
Chandelier Exit Sell
Direction Change (long to short or vice versa)
💡 How to Use:
Use on trending assets (e.g., Gold, Indices, Crypto).
Combine with support/resistance or session filters for optimal results.
Enable alerts to be notified on trade setups.
📢 Credits:
Based on the original Chandelier Exit script by everget.
Enhancements by AP Capital for filtered signals and better visual feedback.
ADR, ATR & VOL OverlayThis is a combined version of 2 of my other indicators:
ADR / ATR Overlay
VOL / AVG Overlay
This indicator will display the following as an overlay on your chart:
ADR
% of ADR
ADR % of Price
ATR
% of ATR
ATR % of Price
Custom Session Volume
Average For Selected Session
Volume Percentage Comparison
Description:
ADR : Average Day Range
% of ADR : Percentage that the current price move has covered its average.
ADR % of Price : The percentage move implied by the average range.
ATR : Average True Range
% of ATR : Percentage that the current price move has covered its average.
ATR % of Price : The percentage move implied by the average true range.
Custom Session Volume : User chosen time frame to monitor volume
Average For Selected Session : Average for the custom session volume
Volume Percentage Comparison : Current session compared to the average (calculated at session close)
Options:
ADR/ATR:
Time Frame
Length
Smoothing
Volume:
Set Custom Time Frame For Calculations
Set Custom Time Frame For Average Comparison
Set Custom Time Zone
Table:
Enable / Disable Each Value
Change Text Color
Change Background Color
Change Table location
Add/Remove extra row for placement
ADR / ATR Example:
The ADR and ATR can be used to provide information about average price moves to help set targets, stop losses, entries and exits based on the potential average moves.
Example: If the "% of ADR" is reading 100%, then 100% of the asset's average price range has been covered, suggesting that an additional move beyond the range has a lower probability.
Example: "ADR % of Price" provides potential price movement in percentage which can be used to asses R/R for asset.
Example: ADR (D) reading is 100% at market close but ATR (D) is at 70% at close. This suggests that there is a potential (coverage) move of 30% in Pre/Post market as suggested by averages.
Custom Volume Session Example:
Set indicator to 30 period average. Set custom time frame to 9:30am to 10:30am Eastern/New York.
When the time frame for the calculation is closed, the indicator will provide a comparison of the current days volume compared to the average of 30 previous days for that same time frame and display it as a percentage in the table.
In this example you could compare how the first hour of the trading day compares to the previous 30 day's average, aiding in evaluating the potential volume for the remainder of the day.
Notes:
Times must be entered in 24 hour format. (1pm = 13:00 etc.)
Volume indicator is for Intra-day time frames, not > Day.
How I use these values:
I use these calculations to determine if a ticker symbol has the necessary range to achieve target gains, to determine if the price oscillation is within "normal" ranges to determine if the trading day will be choppy, and to determine placement of stops and targets within average ranges in combination with support, resistance and retracement levels.

Impulse Zones | Flux Charts💎 GENERAL OVERVIEW
Introducing our new Impulse Zones indicator, a powerful tool designed to identify significant price movements accompanied by strong volume, highlighting potential areas of support and resistance. These Impulse Zones can offer valuable insights into market momentum and potential reversal or continuation points. For more information about the process, please check the "HOW DOES IT WORK ?" section.
Impulse Zones Features :
Dynamic Zone Creation : Automatically identifies and plots potential supply and demand zones based on significant price impulses and volume spikes.
Customizable Settings : Allows you to adjust the sensitivity of zone detection based on your trading style and market conditions.
Retests and Breakouts : Clearly marks instances where price retests or breaks through established Impulse Zones, providing potential entry or exit signals.
Alerts : You can set alerts for Bullish & Bearish Impulse Zone detection and their retests.
🚩 UNIQUENESS
Our Impulse Zones indicator stands out by combining both price action (impulsive moves) and volume confirmation to define significant zones. Unlike simple support and resistance indicators, it emphasizes the strength behind price movements, potentially filtering out less significant levels. The inclusion of retest and breakout visuals directly on the chart provides immediate context for potential trading opportunities. The user can also set up alerts for freshly detected Impulse Zones & the retests of them.
📌 HOW DOES IT WORK ?
The indicator identifies bars where the price range (high - low) is significantly larger than the average true range (ATR), indicating a strong price movement. The Size Sensitivity input allows you to control how large this impulse needs to be relative to the ATR.
Simultaneously, it checks if the volume on the impulse bar is significantly higher than the average volume. The Volume Sensitivity input governs this threshold.
When both the price impulse and volume confirmation criteria are met, an Impulse Zone is created in the corresponding direction. The high and low of the impulse bar define the initial boundaries of the zone. Zones are extended forward in time to remain relevant. The indicator manages the number of active zones to maintain chart clarity and can remove zones that haven't been touched for a specified period. The indicator monitors price action within and around established zones.
A retest is identified when the price touches a zone and then moves away. A break occurs when the price closes beyond the invalidation point of a zone. Keep in mind that if "Show Historic Zones" setting is disabled, you will not see break labels as their zones will be removed from the chart.
The detection of Impulse Zones are immediate signs of significant buying or selling pressure entering the market. These zones represent areas where a strong imbalance between buyers and sellers has led to a rapid price movement accompanied by high volume. Bullish Impulse Zones act as a possible future support zone, and Bearish Impulse Zones act as a possible future resistance zone. Retests of the zones suggest a strong potential movement in the corresponding direction.
⚙️ SETTINGS
1. General Configuration
Show Historic Zones: If enabled, invalidated or expired Impulse Zones will remain visible on the chart.
2. Impulse Zones
Invalidation Method: Determines which part of the candle (Wick or Close) is used to invalidate a zone break.
Size Sensitivity: Controls the required size of the impulse bar relative to the ATR for a zone to be detected. Higher values may identify fewer, larger zones. Lower values may detect more, smaller zones.
Volume Sensitivity: Controls the required volume of the impulse bar relative to the average volume for a zone to be detected. Higher values require more significant volume.
Labels: Toggles the display of "IZ" labels on the identified zones.
Retests: Enables the visual highlighting of retests on the zones.
Breaks: Enables the visual highlighting of zone breaks.

ATR Volatility giua64ATR Volatility giua64 – Smart Signal + VIX Filter
📘 Script Explanation (in English)
Title: ATR Volatility giua64 – Smart Signal + VIX Filter
This script analyzes market volatility using the Average True Range (ATR) and compares it to its moving average to determine whether volatility is HIGH, MEDIUM, or LOW.
It includes:
✅ Custom or preset configurations for different asset classes (Forex, Indices, Gold, etc.).
✅ An optional external volatility index input (like the VIX) to refine directional bias.
✅ A directional signal (LONG, SHORT, FLAT) based on ATR strength, direction, and external volatility conditions.
✅ A clean visual table showing key values such as ATR, ATR average, ATR %, VIX level, current range, extended range, and final signal.
This tool is ideal for traders looking to:
Monitor the intensity of price movements
Filter trading strategies based on volatility conditions
Identify momentum acceleration or exhaustion
⚙️ Settings Guide
Here’s a breakdown of the user inputs:
🔹 ATR Settings
Setting Description
ATR Length Number of periods for ATR calculation (default: 14)
ATR Smoothing Type of moving average used (RMA, SMA, EMA, WMA)
ATR Average Length Period for the ATR moving average baseline
🔹 Asset Class Preset
Choose between:
Manual – Define your own point multiplier and thresholds
Forex (Pips) – Auto-set for FX markets (high precision)
Indices (0.1 Points) – For index instruments like DAX or S&P
Gold (USD) – Preset suitable for XAU/USD
If Manual is selected, configure:
Setting Description
Points Multiplier Multiplies raw price ranges into useful units (e.g., 10 for Gold)
Low Volatility Threshold Threshold to define "LOW" volatility
High Volatility Threshold Threshold to define "HIGH" volatility
🔹 Extended Range and VIX
Setting Description
Timeframe for Extended High/Low Used to compare larger price ranges (e.g., Daily or Weekly)
External Volatility Index (VIX) Symbol for a volatility index like "VIX" or "EUVI"
Low VIX Threshold Below this level, VIX is considered "low" (default: 20)
High VIX Threshold Above this level, VIX is considered "high" (default: 30)
🔹 Table Display
Setting Description
Table Position Where the visual table appears on the chart (e.g., bottom_center, top_left)
Show ATR Line on Chart Whether to display the ATR line directly on the chart
✅ Signal Logic Summary
The script determines the final signal based on:
ATR being above or below its average
ATR rising or falling
ATR percentage being significant (>2%)
VIX being high or low
Conditions Signal
ATR rising + high volatility + low VIX LONG
ATR falling + high volatility + high VIX SHORT
ATR flat or low volatility or low %ATR FLAT

Daily Price RangeThe indicator is designed to analyze an instrument’s volatility based on daily extremes (High-Low) and to compare the current day’s range with the typical (median) range over a selected period. This helps traders assess how much of the "usual" daily movement has already occurred and how much may still be possible during the trading day.

ADR & ATR OverlayADR & ATR Overlay
This indicator will display the following as an overlay on your chart:
ADR
% of ADR
ADR % of Price
ATR
% of ATR
ATR % of Price
Description:
ADR : Average Day Range
% of ADR : Percentage that the current price move has covered its average.
ADR % of Price : The percentage move implied by the average range.
ATR : Average True Range
% of ATR : Percentage that the current price move has covered its average.
ATR % of Price : The percentage move implied by the average true range.
Options:
Time Frame
Length
Smoothing
Enable or Disable each value
Text Color
Background Color
How to use this indicator:
The ADR and ATR can be used to provide information about average price moves to help set targets, stop losses, entries and exits based on the potential average moves.
Example: If the "% of ADR" is reading 100%, then 100% of the asset's average price range has been covered, suggesting that an additional move beyond the range has a lower probability.
Example: "ADR % of Price" provides potential price movement in percentage which can be used to asses R/R for asset.
Example: ADR (D) reading is 100% at market close but ATR (D) is at 70% at close. This suggests that there is a potential move of 30% in Pre/Post market as suggested by averages.
Notes:
These indicators are available as oscillators to place under your chart through trading view but this indicator will place them on the chart in numerical only format.
Please feel free to modify this script if you like but please acknowledge me, I am only a hobby coder so this takes some time & effort.
