Intraday Fibs RetracementFibonacci (Fibs) levels are often used by traders as a way to find support and resistance, based on the Fibonacci sequence. These levels are widely used in technical analysis to identify potential reversal points in the price of an asset.
Fibs retracement draws lines at these Fibs level between a significant high and low point on a price chart.
What it shows:
This indicator will automatically draw Fibs Retracement Levels on your chart without any manual work.
It is designed to be used for day trading, especially in scenarios where a ticker gaps up/down large compared to the prior day close. (i.e. scenario where the difference of day's open and prior day close is large)
The drawing will happen on each trading day the moment trading hours open, and will NOT draw during pre-market and post-market.
User can see the line of each Fibs level, labelled with the Fib percentage and price value for the corresponding levels.
User will specify a start and end point of Fibs and based on the choice the indicator will automatically compute the other user defined Fibs levels and display on the chart.
How to use it:
The Fib levels drawn can be a potential support and resistance zone. Therefore in scenario where you already have a position and are approaching one of these levels it could be a point to close out some or all the position as you are approaching a resistance. On the other hand when price do approach these levels you could enter a position for a reversal trade. These are few ways to use the indicator but there are other ways that can be used, which can be found out by researching "Fibonacci (Fibs) Retracement".
In the example on the chart you can see a price bounce from the 0.7886 Fibs level on this particular day, where the price gapped up and was coming down after market hours opened.
Key settings:
1. Fibs Retracement Start and end Point: User selects where the Fibs levels should be drawn.
Available Options are:
Start Points:
Market Open
Market Open High (Dependent on the time frame you are on)
Pre-market High
Day's High
End Points:
Previous Day Close
Previous Day Low
Previous Day High
Pre-market Low (Current Day)
Day's Low
2. Custom Fib Levels: User can manually enter the Fib levels they want to see. (Max 9)
Default values are: 0,0.236,0.382,0.5,0.618,0.786,1,1.618,2.618.
3. Display settings: User can specify the line colour, thickness and style.
4. Label Setting: User can choose to turn on/off the labels for the each Fibs Level. Label will show the fib percentage and the corresponding price. User can also choose the location of the labels, defined by an offset from the current candle.
----------------------------------------------------------------------
If anything is not clear please let me know!
Daytrade

Ultimate Volatility Scanner by NHBprod - Requested by Client!Hey Everyone!
I created another script to add to my growing library of strategies and indicators that I use for automated crypto and stock trading! This strategy is for BITCOIN but can be used on any stock or crypto. This was requested by a client so I thought I should create it and hopefully build off of it and build variants!
This script gets and compares the 14-day volatility using the ATR percentage for a list of cryptocurrencies and stocks. Cryptocurrencies are preloaded into the script, and the script will show you the TOP 5 coins in terms of volatility, and then compares it to the Bitcoin volatility as a reference. It updates these values once per day using daily timeframe data from TradingView. The coins are then sorted in descending order by their volatility.
If you don't want to use the preloaded set of coins, you have the option of inputting your own coins AND/OR stocks!
Let me know your thoughts.

JJ Open High and Open Low FinderThis script identifies candles where the open price matches the high price (Open High) and where the open price matches the low price (Open Low). It highlights these candles with labels directly on the chart, making it easy for traders to spot these conditions in real-time.
Features :
- Red "OH" label below candles for Open High.
- Green "OL" label above candles for Open Low.
Use this tool to enhance your trading insights.
** Disclaimer **: This script is for educational purposes only and should not be considered financial advice.

Daily PlayDaily Play Indicator
The Daily Play Indicator is a clean and versatile tool designed to help traders organize and execute their daily trading plan directly on their charts. This indicator simplifies your workflow by visually displaying key inputs like market trend, directional bias, and key levels, making it easier to focus on your trading strategy.
Features
Dropdown Selection for Trend and Bias:
• Set the overall market trend (Bullish, Bearish, or Neutral) and your directional bias (Long, Short, or Neutral) using intuitive dropdown menus. No more manual typing or guesswork!
Key Levels:
Quickly input and display the Previous Day High and Previous Day Low. These levels are essential for many trading strategies, such as breakouts.
Real-Time News Notes:
Add a quick note about impactful news or market events (e.g., “Fed meeting today” or “Earnings season”) to keep contextual awareness while trading.
Simple On-Chart Display:
The indicator creates a “table-like” structure on the chart, aligning your inputs in an easy-to-read format. The data is positioned dynamically so it doesn’t obstruct the price action.
Customisable Visual Style:
Simple labels with clear text to ensure that your chart remains neat and tidy.
----
Use Case
The Daily Play Indicator is ideal for:
• Day traders and scalpers who rely on precise planning and real-time execution.
• Swing traders looking to mark critical levels and develop a trade plan before the session begins.
• Anyone who needs a structured way to stay focused and disciplined during volatile market conditions.
By integrating this tool into your workflow, you can easily align your daily preparation with live market action.
----
How to Use
Open the indicator settings to configure your inputs:
• Trend: Use the dropdown to choose between Bullish, Bearish, or Neutral.
• Bias: Select Long, Short, or Neutral to align your personal bias with the market.
• Previous Day Levels: Enter the High and Low of the previous trading session for key reference points.
• News: Add a short description of any relevant market-moving events.

ToxicJ3ster - Day Trading SignalsThis Pine Script™ indicator, "ToxicJ3ster - Signals for Day Trading," is designed to assist traders in identifying key trading signals for day trading. It employs a combination of Moving Averages, RSI, Volume, ATR, ADX, Bollinger Bands, and VWAP to generate buy and sell signals. The script also incorporates multiple timeframe analysis to enhance signal accuracy. It is optimized for use on the 5-minute chart.
Purpose:
This script uniquely combines various technical indicators to create a comprehensive and reliable day trading strategy. Each indicator serves a specific purpose, and their integration is designed to provide multiple layers of confirmation for trading signals, reducing false signals and increasing trading accuracy.
1. Moving Averages: These are used to identify the overall trend direction. By calculating short and long period Moving Averages, the script can detect bullish and bearish crossovers, which are key signals for entering and exiting trades.
2. RSI Filtering: The Relative Strength Index (RSI) helps filter signals by ensuring trades are only taken in favorable market conditions. It detects overbought and oversold levels and trends within the RSI to confirm market momentum.
3. Volume and ATR Conditions: Volume and ATR multipliers are used to identify significant market activity. The script checks for volume spikes and volatility to confirm the strength of trends and avoid false signals.
4. ADX Filtering: The ADX is used to confirm the strength of a trend. By filtering out weak trends, the script focuses on strong and reliable signals, enhancing the accuracy of trade entries and exits.
5. Bollinger Bands: Bollinger Bands provide additional context for the trend and help identify potential reversal points. The script uses Bollinger Bands to avoid false signals and ensure trades are taken in trending markets.
6. Higher Timeframe Analysis: This feature ensures that signals align with broader market trends by using higher timeframe Moving Averages for trend confirmation. It adds a layer of robustness to the signals generated on the 5-minute chart.
7. VWAP Integration: VWAP is used for intraday trading signals. By calculating the VWAP and generating buy and sell signals based on its crossover with the price, the script provides additional confirmation for trade entries.
8. MACD Analysis: The MACD line, signal line, and histogram are calculated to generate additional buy/sell signals. The MACD is used to detect changes in the strength, direction, momentum, and duration of a trend.
9. Alert System: Custom alerts are integrated to notify traders of potential trading opportunities based on the signals generated by the script.
How It Works:
- Trend Detection: The script calculates short and long period Moving Averages and identifies bullish and bearish crossovers to determine the trend direction.
- Signal Filtering: RSI, Volume, ATR, and ADX are used to filter and confirm signals, ensuring trades are taken in strong and favorable market conditions.
- Multiple Timeframe Analysis: The script uses higher timeframe Moving Averages to confirm trends, aligning signals with broader market movements.
- Additional Confirmations: VWAP, MACD, and Bollinger Bands provide multiple layers of confirmation for buy and sell signals, enhancing the reliability of the trading strategy.
Usage:
- Customize the input parameters to suit your trading strategy and preferences.
- Monitor the generated signals and alerts to make informed trading decisions.
- This script is made to work best on the 5-minute chart.
Disclaimer:
This indicator is not perfect and can generate false signals. It is up to the trader to determine how they would like to proceed with their trades. Always conduct thorough research and consider seeking advice from a financial professional before making trading decisions. Use this script at your own risk.

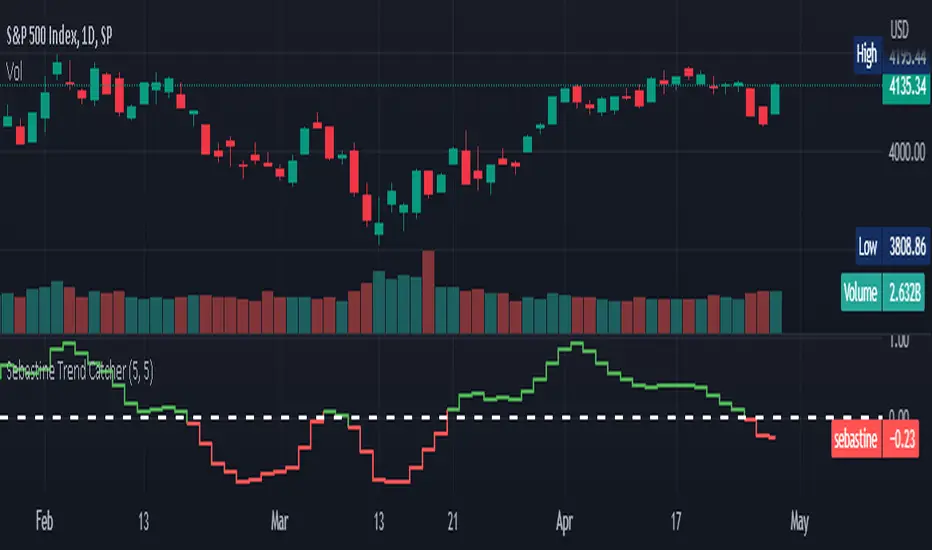
Sebastine Trend CatcherSebastine Trend Catcher captures trends in any time frame in a very simple fashion. Green line crossing up above the signal zero line is uptrend. Red line crossing down the signal zero line is downtrend. The indicator line is presented by default as a step line, which gives an idea on how the trend moves inside the bigger trend. But it should be specifically understood that a trend starts only when the indicator crosses the signal zero line. The ups and downs in the indicator step line until crossing signal zero line is only small corrections and bounces inside a trend. Sebastine trend catcher captures trends smoothing prices in 2 steps. The indicator banks profusely on the idea of jackvmk’s Heiken Ashi Candles. The indicator presented in a centred oscillator fashion in a bottom panel helps understand the main trend and its different shades inside the trend in a clearly discernible manner with sharp entry signals when crossing zero line. The indicator could be used from Daytrading to Investment Trading. As usual this indicator too could produce overshoots and error signals and be better used with other indicators. The settings can be varied and experimented for any given scrip, timeframe or stock exchange.
kaptanFantastik[Take Profit and Stop Loss Finder]Hello all,
It's ATR based active take profit & stop loss finder.
You can set multipliers for taking profit and stop losing and you can change the price source for the calculation. Also, you can change the ATR level.
Defaults are my best settings. 2.2x for taking profit and 1.5x for stop losing. Open price is the source. Also, I think 5 ATR is the best for day and swing trade.
Levels are determined according to the open prices (This is because we can enter the position after our other indicators give the signal following the close price. Yet, you can change it). Since it's active and based on my calculation with ATR values, percentages for the taking profits and stop losing may change. Because of this, you need to note the take profit and stop lose prices after your entry price level is determined by the other indicators for the best success rates.
It can be used in any time frame with the other indicators to determine the best entry points. For example, 3 EMA levels with 5,8 and 13 is good option for the entry. You can enter the position when 5 crosses up 8 and both are above the 13. You can also use custom more advanced buy/sell indicators with this one for entry points.
It can be used with any asset from cryptocurrency to the stocks, from forex to gold etc.
Hint: You can set your levels lower than the take profit prices to maximize the success rate.
Note: Market should be open for the positions.
Example trade on the 5-minute timeline.
The below chart has both my custom indicator and the 3 EMAs mentioned above.
Trade 1: Entry price: 19191, Take Profit: 19276. Profit 0.44%
Trade 2: Entry price: 19189, Take Profit: 193009. Profit 0.625%
Türkçe bilen kullanıcılar için açıklama
Herkese merhabalar,
ATR tabanlı aktif kar al ve zararı durdur bulucu.
Kar almak ve zararı kesmek için çarpanlar belirleyebilir ve hesaplama için fiyat kaynağı değiştirebilirsiniz. Ayrıca, ATR seviyesini de değiştirebilirsiniz.
Varsayılanlar benim en iyi ayarlarım. Kar almak için 2,2 kat ve zararı durdurmak için 1,5 kat. Açılış, fiyat kaynağıdır. Ayrıca, 5 ATR'nin günlük ve kısa vade (swing trade) için en iyisi olduğunu düşünüyorum.
Seviyeler açılış fiyatına göre belirlenir (Çünkü diğer göstergelerimiz kapanış fiyatının ardından sinyal verdikten sonra pozisyona girebiliyoruz. Yine de bunu değiştirebilirsiniz). Aktif olduğu için ve ATR değerleri ile yaptığım hesaplamaya göre kar alma ve zarar kes yüzdeleri değişebilir. Bu nedenle, en iyi başarı oranları için; giriş fiyat seviyeniz diğer göstergeler tarafından belirlendikten sonra kar al ve zararı durdur fiyatlarını not etmeniz gerekir.
En iyi giriş noktalarını belirlemek için diğer göstergelerle herhangi bir zaman diliminde kullanılabilir. Örneğin, 5,8 ve 13 ile 3 EMA seviyesi giriş için iyi bir seçenektir. 5, 8'i geçtiğinde ve her ikisi de 13'ün üzerinde olduğunda pozisyona girebilirsiniz. Giriş noktaları için bununla birlikte daha gelişmiş özel al/sat göstergelerini de kullanabilirsiniz.
Kripto paradan hisse senetlerine, forexten altına vb. her türlü varlıkla kullanılabilir.
İpucu: Başarı oranını en üst düzeye çıkarmak için seviyelerinizi kar alma fiyatlarından daha düşük ayarlayabilirsiniz.
Not: Pozisyonlar için piyasa açık olmalıdır.
5 dakikalık zaman çizilgesinde örnek işlem.
Yukarıdaki örnek grafikte hem özel indikatörüm hem de yukrıda belirtilen 3 EMA var.
İşlem 1: Giriş fiyatı: 19191, Kazanç Al: 19276. Kar %0.44
İşlem 2: Giriş fiyatı: 19189, Kazanç Al: 193009. Kar %0.625


FCPO IntradayThis script is specially developed for the reference of Crude Palm Oil Futures ( CPO ) market traders.
Before using this script, traders need to know a few important things, namely:
1. Use of this script is limited to the Crude Palm Oil Futures ( CPO ) market only;
2. The appropriate time-frame for the purpose of using this script is 30 minutes.
Procedures for using indicators.
1. The line on the trading day will only be known after the first candle is completed, i.e. at 10:59:59 am;
2. Then, key in order.
Entry.
The recommended max Entry is once Long and once Short only on the same day.
Long.
1. Traders can only make a purchase when the market price hits the green line;
2. If traders hold a long position, traders can make a sale to close the long position when the price hits the blue line.
Short.
1. Traders can only make a sale when the market price hits the red line;
2. If traders hold a short position, traders can make a purchase to close the short position when the price hits the orange line.

Retail Bomber MK1Handydandy tool to wait for the whales to wake up and start trading.
Each Zone has a schedule (call it market session) and pumps and dumps can be seen on specific times.
And for each zone you can either Highlight the background of just the start time, the whole session, or color the bars instead of changing the background.
Each zone is already set for a specific market open (session open): ASIA, UK, SYDNEY, NY + other 2 extra zones.
All of this is customisable 🙂
To set the time configuration, it goes like this:
1230:1330:1234567
1230:1330 is the period of time you want to study
1234567 are the days of the week, where 1=Sunday...And you fall on 7=Saturday
Example: If we want to study the same ranges from Monday to Friday only, it goes like: 1230 1330:23456
Colors can be editable
Labels for each session can be changed too.
Still testing it.

4H Crypto RoycerThis indicator includes simple moving averages (21,50,200) and exponential moving averages (10,144) and has the ability to show this data on the chart with the approval of the user.
The indicator, which controls the intersections with the formulas it contains, can display the Golden Cross and Death Cross warnings to the user on the chart.
It draws a band on the chart with the support area calculations and in these band calculations; blends simple moving and exponential moving averages and smooths them by 1.5%.
It is used as a signal trigger in band overruns by replacing the lower and upper bands by calculation.
While one of our signal triggers is this band, our other variable is 50 simple moving averages.
Inspired by Kıvanç Özbilgiç's Supertrend indicator, the formula was updated using MA50 and 15% Stop-Loss instead of using atr multiplier.
Our chart has been tested in crypto currencies on 4 hour candles, so "4H" has been added to the beginning of the name.
We recommend using the indicator, buy / sell signals and the support band on the 4-hour charts.

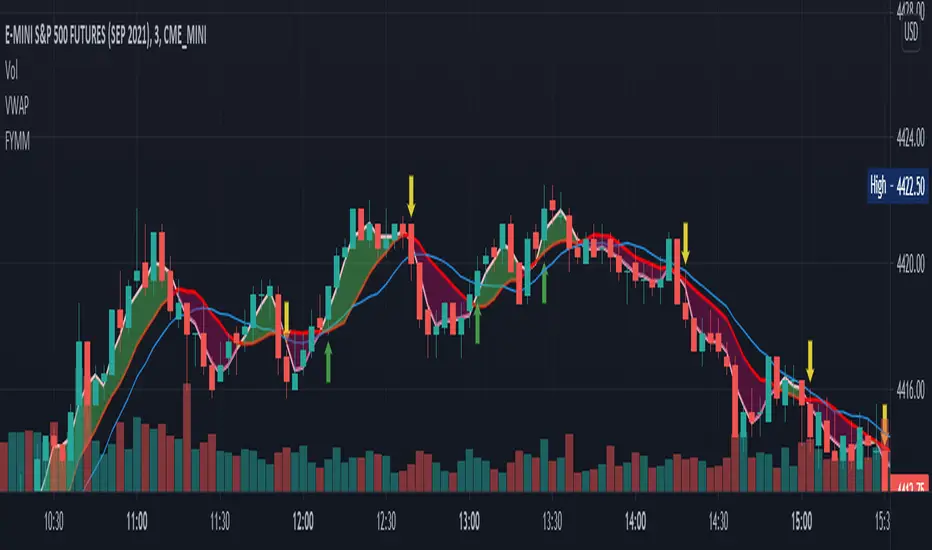
F_ You Money MakerThe FYMM is a combination of custom stochastics and an SMA cloud. The idea is when the bullish stochastic crosses over the bearish stochastic and a cross occurs on the cloud it will alert you. The indicator is slightly leading so you'll need to be careful and use near technical levels such as support and resistance or trend lines. Up arrow means enter a long down arrow means enter a short. Again, use this around technicals.
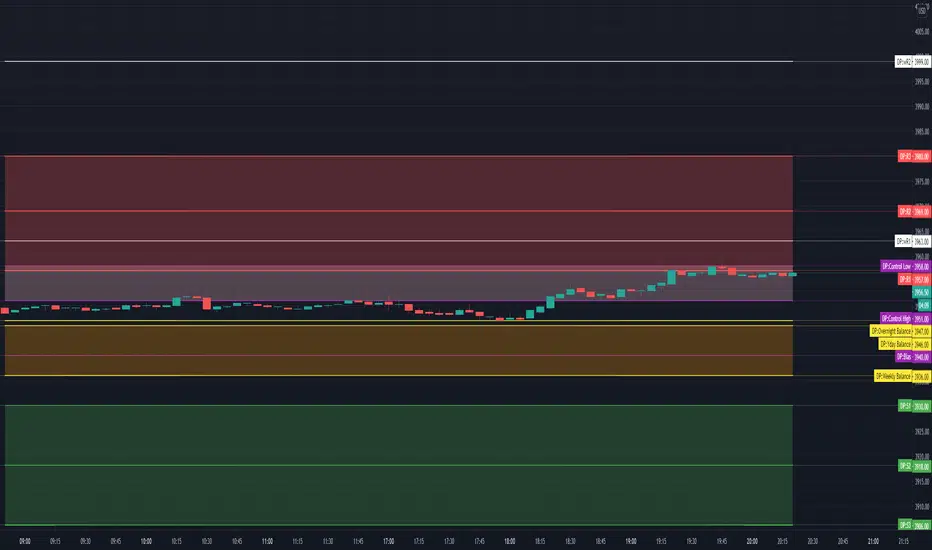
TV Day Plan Template 1This is a template for daytraders, swing traders, supply and demand traders, and even swing traders. As traders we are always scanning charts for levels and zones. This template makes it easy and convenient to find, change, and chart levels. As a daytrader, I will use this daily. I always have daily and weekly targets in mind. This will ensure I don't lose track of the bigger picture while trading the smaller moves. Levels in this chart are not auto calculated. They are manually input. This script is a quick and convenient way to chart multiple levels without having to go through each drawing, change the settings, and then redraw the level. Currently this will only save levels for one ticker. A workaround is to use multiple instances and then hide the ones not in use. Another way is to use the second part to this script, Day Plan Levels Template 2. If only using one instance, you can save the levels as default. This will save them. However, if saving levels as default while using multiple instances of this indicator, the other levels will erase. The way that I use this that I have daily levels for #ES in one instance and then daily levels for #NQ in another instance.
This script is very customizable
Options include
On/Off Toggles
Light/Heavy Versions - Light versions does not plot. Heavy version will plot and show levels in info bar and price axis
Balance Levels
Control Levels
3 Support and 3 Resistance levels for daily and weekly
2 Support and 2 Resistance Clouds
Balance and Control Clouds
"0" value disables and hides levels
Ehler Fisher applied on distance EMAThis is an improved version of Fisher, which use as a source the distance from EMA , compared to the initial source which was on the close of a candle.
It can be used in any market, any time frame .
For conditions we have multiple conditions for the logic, in this case initially if our fisher is above 0 is a long direction ,if its belowe 0 its a short direction.
Also we can improve this condition even further, in this case if we cross up our previous line its a buy signal, and if we cross down its a sell signal.
For best usage combine the cross together with the position of fisher respecting the 0.
If you have any other questions, let me know with a private message.

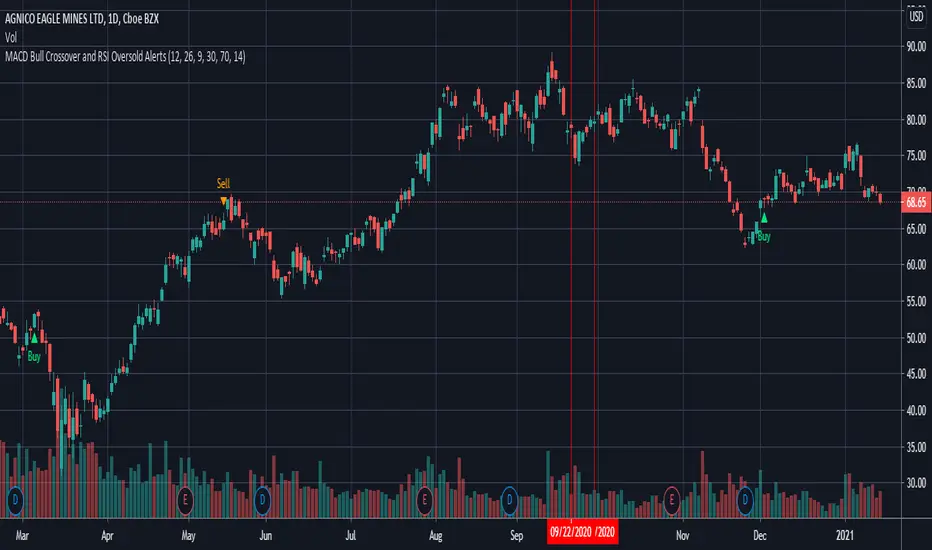
MACD Bull Crossover and RSI Oversold - AlertsHello everyone, these are the alerts for my previous "MACD Bull Crossover and RSI Oversold" Long Strategy. This version currently does not support stoploss and takeprofit alerts but the next update will.
CRYPTO Trend Direction Multiple EMA'sToday I bring an indicator specialized in crypto markets.
Its made of multiples EMA : very fast, fast, normal, slow, very slow
The logic behind its simple :
For long : we check that the EMA are in ascending order like EMA 5 > EMA 10 > EMA 20 .... and at the same time that last close of candle is above all of them.
For short : we check that the EMA are in descending order like EMA 5 < EMA 10 < EMA 20 .... and at the same time last close of candle is below all of them.
It can be used with all time frames.
Enjoy it !

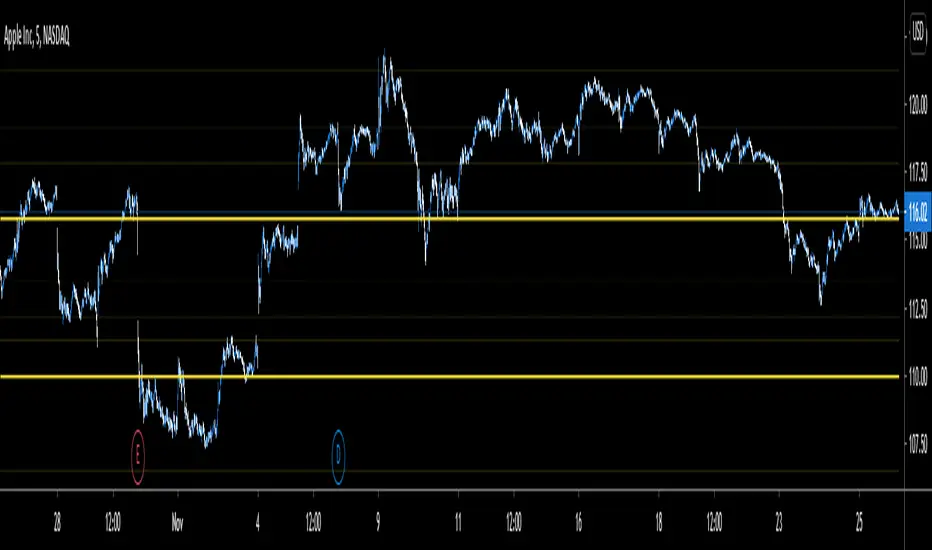
Yearly Levels for Day TradersThe above is the five minutes chart for $aapl
The script is useful in identifying price levels for the short term trading. The inputs are based on Fibonacci ratios but on yearly basis.
You will need to enter the pair ratio for where the stock is between ( I will show you).
Those pairs are as follows:
R1/R2
(0/0.23)
(.23/.38)
(.38/.61)
(.61/1)
(1/1.61)
(1.61/2.61)
(2.61/4.23)
(4.23/6.859)
(6.85/11.08)
(11.08/17.94)
(17.94/29.05)
(29.05/46.95)
(46.95/75.99)
(75.99/122.99)
I personally added the indicator multiple times to a template and put in all the pairs so I do not have to enter the pair each time.
The script does not tell you which level is a bottom or a top. Your experience matters.
If you are interested please PM me the username:
Day ATR H/L + Yesterday H/L + Today H/L - divinechartistNow you can monitor Yesterday's high and low on a small time frame, You no need to switch time frame every time.
Also, you can monitor support and resistance base on Day's ATR (Default Value is 14)
and also we used EMA of 21 for small-time trand identify.
This indicator helps you to find the best trade near to support and resistance. Using this indicator you can enter in trand with small STOPLOSS and for a BIG PROFIT.
EX :
If your current price is below 21EMA and also broke yesterday's low, so its probability to go more down.
Same, If the price is above 21EMA and the price broke yesterday's high so probability it's going more UP.
Also, you can book profit and set STOPLOSS base on ATR value.
if the price above or near TOP-ATR it's mean it's not the best price to buy, You can book a profit at this price or try to find short sell trade.
Same as if price below BOTTOM-ATR it's mean it's not the best price to sell, You can book a profit at this price or try to find buy trade.

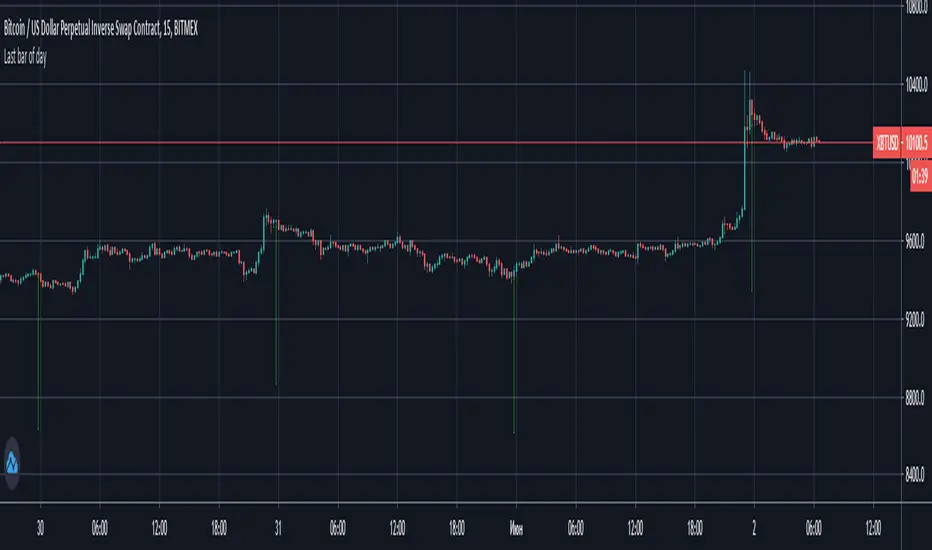
S&P Intraday IndicatorS&P Intraday Indicator can be used to trade S&P 500 futures for day trade. Once you add this indicator on your chart, it will overlay on your chart. You can see green up arrow and red down arrows.
To start using: Add ES1! (E-MINI S&P500 Futures current) on chart, Make sure chart is 5 min chart, and then add indicator to chart. Note: This indicator only works for S&P 500 index .
You can take long position when arrow changes from "red down" to "green up"
You can take short position when arrow changes from "green up" to "red down"
You can also take new position in-between trend when there is a pull back of 2 or more candlesticks .
For Options trading you can buy SPY Calls for long and SPY Puts for short positions. Bets way to use this indicator is using ES1! contract.
You can send a private message on TradingView to gain access.
or Use the link below to obtain access to this indicator

MULTIPLE EMA TENDENCEExponential Moving Averages configured using the Phicube methodology.
Short Term Averages: 17 and 34
Medium Term Averages: 72 and 144
Long Term Averages: 305 and 610
Very Long Term Averages: 1292, 2584 and 4090
Consider the following SETUPs:
17, 72, 305 and 1292
or
34, 144, 610 and 2584
* Moving Averages Numerically Upward: Upward Trend
* Moving Averages Aligned Numerically to Below: Downtrend
* Average Price: Consolidation
GRAPHIC SCALP SETUP 1 MINUTE
Price Above 34 Period Exponential Moving Average = PURCHASE
Price Below 34 Period Exponential Moving Average = SALE
(Evaluate the Price Action of the 15 and 4 minute graphical times, for Daytrade, before starting operations)
------
Medias Móveis Exponenciais configuradas a partir da metodologia Phicube.
Médias Curto Prazo: 17 e 34
Médias Medio Prazo: 72 e 144
Médias Longo Prazo: 305 e 610
Médias Longuíssimo Prazo: 1292, 2584 e 4090.
Considere os seguintes SETUPs:
17, 72, 305 e 1292
ou
34, 144, 610 e 2584
*Médias Móveis Alinhadas Numericamente para cima: Tendência de Alta
*Médias Móveis Alinhadas Numericamente par abaixo: Tendência de Baixa
*Preço entre Médias: Consolidação
SETUP SCALP GRAFICO 1 MINUTO
Preço Acima da Média Móvel Exponencial de 34 periodos = COMPRA
Preço Abaixo da Média Móvel Exponencial de 34 periodos = VENDA
(Avalie o Price Action dos tempos graficos de 15 e 4 minutos, para Daytrade, antes de inciar as operações)

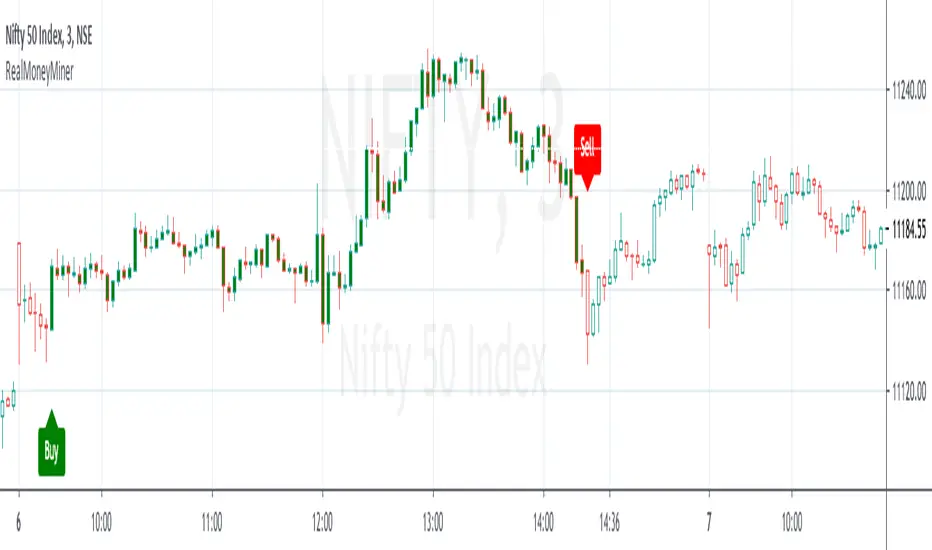
RealMoneyMinerThis Indicator will give you buy and sell signal based on average true range
This Indicator is modified version of Real Money Miner, which will give you fewer signals but with good accuracy.
Buy and Sell only as per your Risk Appetite.
Stoploss is also inbuilt.
Thanks,
rareme
1 Minute Scalper
How to use:
Green background: Long
With green background wait for white bars to appear, once white bars appear wait for green bars and enter long on break of high or close of green bar. The stop out of trade should be a candle that closes below the pivot: it should be apparent. (Can enter long after white bars if it has a long tail Stop below the tail).
Red background: Short
With red background wait for black bars to appear, once black bars appear wait for red bars and enter short on break of low or close of red bar. The stop out of trade should be a candle that closes above the pivot. (Can enter short after black bars if it has a long tail).
best of luck

How to detect last bar of day Simple way how to detect last bar of day and close all positions
UPD: day end can be different for yours because stocks market use another timezone