COVID-19 Case ComparisonDuring this global pandemic, there is limited information available on the COVID-19 disease itself. However one thing we do have is data; and we get more of this every day.
Use this indicator to track the live number of new cases each day, along with the current mortality, recovery, and transmission rates.
Easily switch data output between multiple countries.
If you don't see your country available, please comment below and I will gladly add it.
Depthhouse

Relative Volume RVOL AlertsRelative Volume or RVOL is an indicator used to help determine the amount of volume change over a given period of time.
It is often used to help traders determine how in-play a ticker is.
General rule of thumb is the higher the RVOL, the more in play a stock is.
I myself like to use it as a substitute of the volume indicator itself.
Basic Calculation:
Relative Volume = Current Volume / Average Volume
Crossover Signals:
Any time there is a volume spike which causes a crossover of the user set 'Smoothed Moving Average' or 'Threshold' a green/red dot will appear at the top. The color of the dot is dependent on closing of the candle. Therefore it does not necessarily mean price will continue in that direction since volume spikes often happen in peaks or valleys.
Threshold:
The level at which custom alerts and signal can be set. The higher the value, the more volume required to trigger.
Built in Alerts:
You can set custom alerts for the crossovers of the adjustable threshold, or the average RVOL band.

Volume Flow v3DepthHouse Volume Flow indicator is used to help determine trend direction strictly based on Negative and Positive volume data.
How to Read:
- Moving Average crossovers are used to help determine a possible trend change or retracement.
- The area cloud on the bottom is calculated by the difference of the moving averages. This could be used to help determine the trending volume strength.
- Bright colored volume bars are large volume spikes calculated by the x factor in the options.
Other changes:
- DepthHouse is going open source with numerous of its indicators. This is only one of many!
- Volume is now displayed without being altered for calculations.

Volume Extension [DepthHouse]DepthHouse Volume Extension uses average calculations to determine the dynamic range which the volume travels through. Any spike above the line represents an over extension in average volume.
The colored bars are then calculated in a similar way, which measures a combination of both price and volume action to determine bull & bear exhaustion levels, and possible entry/exit points for big players.
This indicator is 100% free , so if you benefit from using it, please consider supporting me by checking out the several other indicators available on my page :)

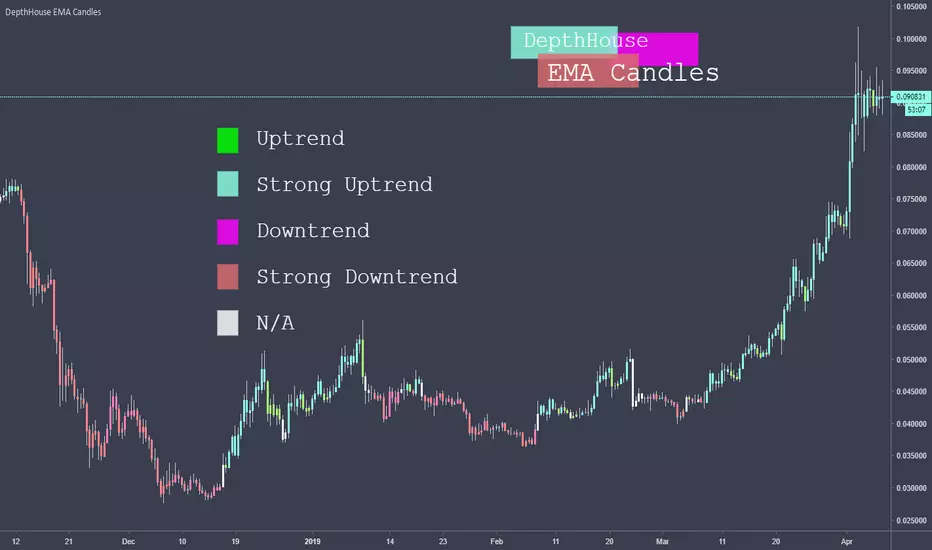
DepthHouse Exponential CandlesThis EMA Candles indicator use the price movement between two user selected Exponential Moving Averages to help determine the current trend.
As of release, there are 5 possible bar color outputs, all of which are shown in the legend above.
The Five Electable Color Outputs:
Uptrend; Strong Uptrend; Downtrend; Strong Downtrend; n/a
I hope you all enjoy!
Please leave your suggestions in the comments below!