MTF VWAP & StDev BandsMulti Timeframe Volume Weighted Average Price with Standard Deviation Bands
I used the script "Koalafied VWAP D/W/M/Q/Y" by Koalafied_3 and made some changes, such as adding more standard deviation bands.
The script can display the daily, weekly, monthly, quarterly and yearly VWAP.
Standard deviation bands values can be changed (default values are 0.618, 1, 1.618, 2, 2.618, 3).
Also the previous standard deviation bands can be displayed.
Deviation

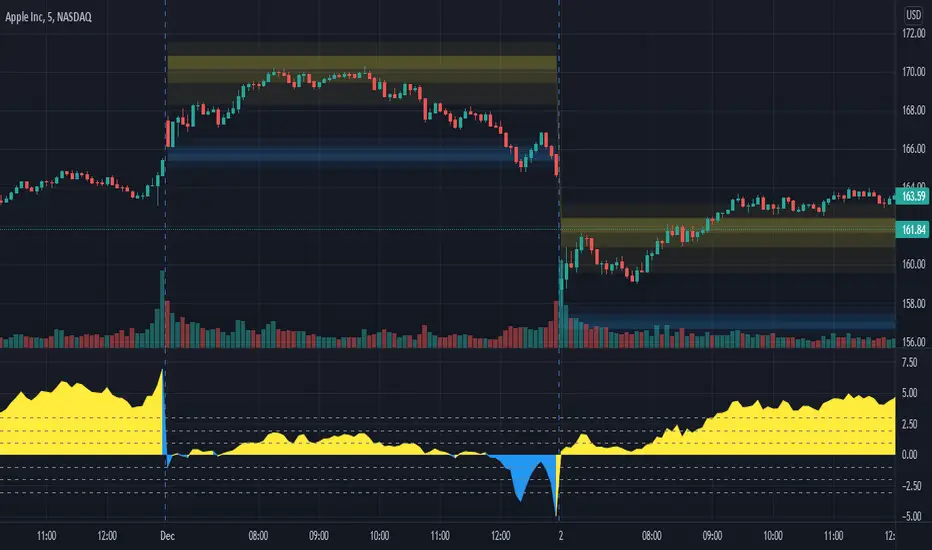
[Sidders]Std. Deviation from Mean/MA (Z-score)This indicator visualizes in a straight forward way the distance price is away from the mean in absolute standard deviations (Z-score) over a certain lookback period (can be configured). Additionally I've included a moving average of the distance, the MA type can be configured in the settings.
Personally using this indicator for some of my algo mean reversion strategies. Price reaching the extreme treshold (can be configured in settings, standard is 3) could be seen as a point where price will revert to the mean.
I've included alerts for when price crosses into extreme areas, as well as alerts for when crosses back into 'normal' territory again. Both are also plotted on the indicator through background coloring/shapes.
Since I've learned so much from other developers I've decided to open source the code. Let me know if you have any ideas on how to improve, I'll see if I can implement them.
Enjoy!

Sequence Distribution Reporta basic tool to retrieve statistics of the distribution of price range sequences.

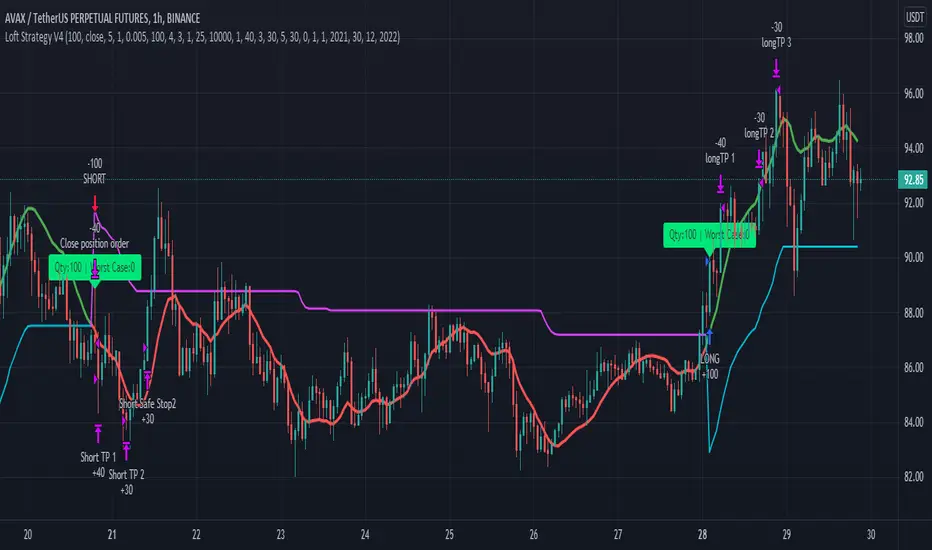
Loft Strategy V4This strategy is an advanced version of the Loft Strategy V1, I shared earlier. (Loft Strategy V1 consists of a kalman filter (by alexgrover ) and a "stop and reverse" line which is following and the kalman filter. If the price goes in the same direction as the position side, the "stop and reverse" line approaches the kalman filter as set on the "Approach Decrease Step" parameter.)
In addition to the previous version, it includes a martingale like deviation and multiple take-profit.
Here it is some parameters definitions of the strategy:
Kalman Filter: The higher this parameter, the faster and more aggressive the filter. Otherwise the filter goes very smoothly
Beginning Approach: First approximation as a percentage of stop-n-reverse line
Final Approach: Minimum approximation of stop-n-reverse line
Approach Decrease Step: If the price moves in the same direction as the strategy, the approach percentage is reduced by this parameter. Otherwise nothing do
Base Order Quantity: Initial capital of position
Max Safe Order Attempt: This parameter determines the maximum number of times the strategy will raise the bet after losing in a row.
Safe Order Deviation: if the last trade is loss, multiply the bet by this parameter (aka. martingale factor)
Profit Deviation: if last trade in loss, multiply the take-profit points
Max Order Quantity: Maximum capital allowed for a position
TP1, TP2, TP3 : Take profit spots in percentage
QT1, QT2, QT3: Amount of take-profit spots
Stop Loss: Maximum stop loss allowed for a trade
Long Entry, Short Entry: Only long side, only short side or both side
Safe Stop After TP2: If the price reaches the TP2 point, move the stop-loss point to the entry price.
Safe Stop After TP1: If the price reaches TP1, move the stop-loss point to the stop-n-reverse line.
Weighted Standard Deviation BandsLinearly weighted standard deviations over linearly weighted mean.
The rationale of the study can be deduced from my latest publications where I go deeper into explaining the benefits of linear weighting, but in short, I can remind that by using linear weighting we are able to increase the information gain by communicating the sequential nature of time series to the calculations via linear weighting.
Note, that multiplier parameters can take both negative and positive values resulting in ability to have, for example, 1st and 6th weighted standard deviations higher than the weighted mean.
Despite the modification of the classic standard deviation formula, I assume that mathematical qualities of standard deviation will hold due to the fact we can alternately weight the window itself, and then apply the classic standard deviation over the weighted window. In both cases, the results will be the same.
Aight that was too formal, but your short strangles should be happy
Here is it, for you

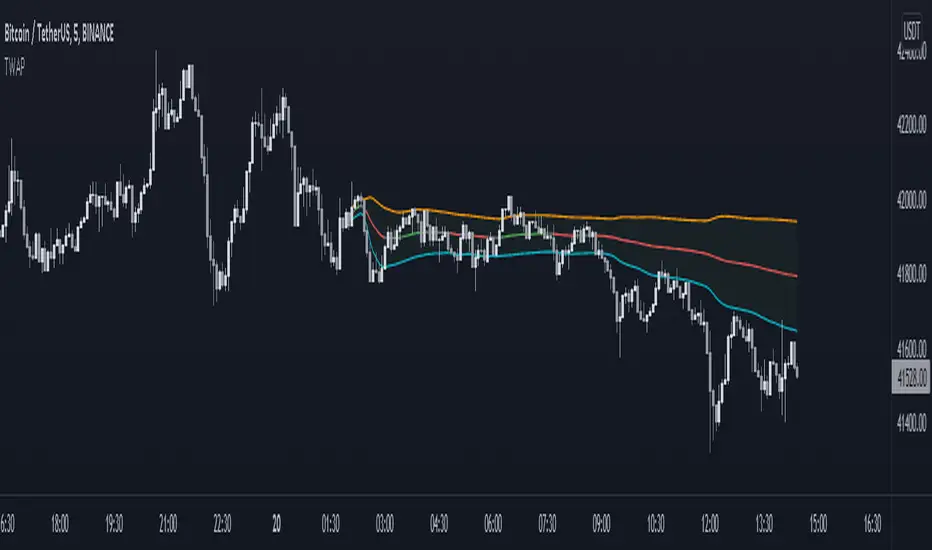
Anchored TWAP with StDev Bands [MrShadow]TWAP with:
- Anchoring: Custom, Day, Week, Month, Quarter, Year (custom anchoring can be selected by dragging a vertical line through the chart)
- Standard Devation Bands
- Auto-coloring depending on the trend
Ergodic Mean Deviation Indicator [CC]The Ergodic Mean Deviation Indicator was created by William Blau and this is a hidden gem that takes the difference between the current price and it's exponential moving average and then double smooths the result to create this indicator. This double smoothing of course creates a lag that allows it to give off a sustained buy signal during a bullish trend and vice versa. This is a very fun indicator to experiment with and surprised that no one on here gives William Blau much attention so I will go ahead and publish the rest of his scripts eventually. I have included strong buy and sell signals in addition to normal ones so strong signals are darker in color and normal signals are lighter in color. Buy when the line turns green and sell when it turns red.
Let me know if there are any other indicators or scripts you would like to see me publish!

Time-of-Day DeviationCreates a 'Time-of-Day' Deviation cone starting from the first bar of the session based upon data from previous days.

DailyDeviationLibrary "DailyDeviation"
Helps in determining the relative deviation from the open of the day compared to the high or low values.
hlcDeltaArrays(daysPrior, maxDeviation, spec, res) Retuns a set of arrays representing the daily deviation of price for a given number of days.
Parameters:
daysPrior : Number of days back to get the close from.
maxDeviation : Maximum deviation before a value is considered an outlier. A value of 0 will not filter results.
spec : session.regular (default), session.extended or other time spec.
res : The resolution (default = '1440').
Returns: Where OH = Open vs High, OL = Open vs Low, and OC = Open vs Close
fromOpen(daysPrior, maxDeviation, comparison, spec, res) Retuns a value representing the deviation from the open (to the high or low) of the current day given number of days to measure from.
Parameters:
daysPrior : Number of days back to get the close from.
maxDeviation : Maximum deviation before a value is considered an outlier. A value of 0 will not filter results.
comparison : The value use in comparison to the current open for the day.
spec : session.regular (default), session.extended or other time spec.
res : The resolution (default = '1440').
[cache_that_pass] 1m 15m Function - Weighted Standard DeviationTradingview Community,
As I progress through my journey, I have come to the realization that it is time to give back. This script isn't a life changer, but it has the building blocks for a motivated individual to optimize the parameters and have a production script ready to go.
Credit for the indicator is due to @rumpypumpydumpy
I adapted this indicator to a strategy for crypto markets. 15 minute time frame has worked best for me.
It is a standard deviation script that has 3 important user configured parameters. These 3 things are what the end user should tweak for optimum returns. They are....
1) Lookback Length - I have had luck with it set to 20, but any value from 1-1000 it will accept.
2) stopPer - Stop Loss percentage of each trade
3) takePer - Take Profit percentage of each trade
2 and 3 above are where you will see significant changes in returns by altering them and trying different percentages. An experienced pinescript programmer can take this and build on it even more. If you do, I ask that you please share the script with the community in an open-source fashion.
It also already accounts for the commission percentage of 0.075% that Binance.US uses for people who pay fees with BNB.
How it works...
It calculates a weighted standard deviation of the price for the lookback period set (so 20 candles is default). It recalculates each time a new candle is printed. It trades when price lows crossunder the bottom of that deviation channel, and sells when price highs crossover the top of that deviation channel. It works best in mid to long term sideways channels / Wyckoff accumulation periods.

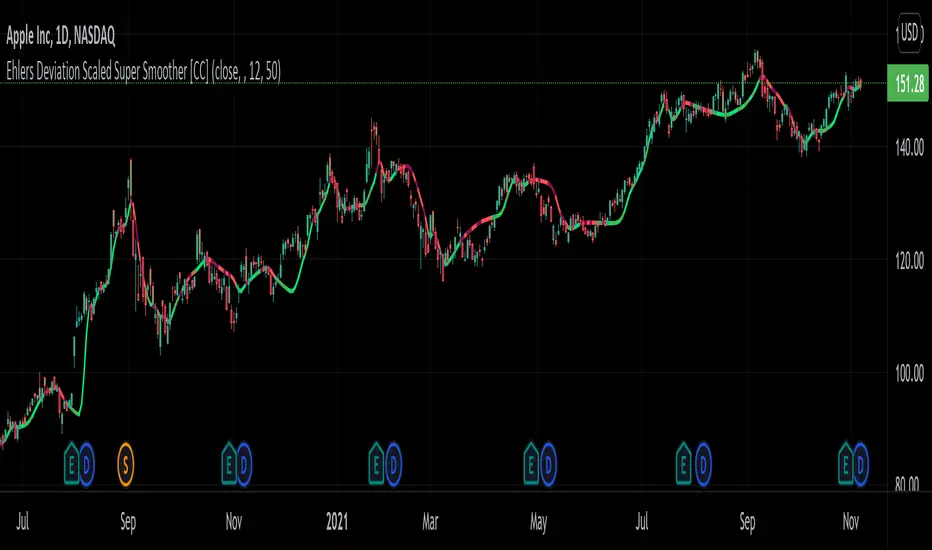
Ehlers Deviation Scaled Super Smoother [CC]The Deviation Scaled Super Smoother was created by John Ehlers and this is an excellent moving average that changes direction very quickly and can keep up with the current underlying trend. This indicator works by applying a Hann Windowed Moving Average to the stock's momentum and scaling that by the Root Mean Square and then using that value in the input for a Super Smoother . I have included strong buy and sell signals in addition to normal ones so lighter colors are normal signals and darker colors are strong ones. Buy when the line turns green and sell when it turns red.
Let me know if there are any other scripts you would like to see me publish!
WhaleCrew Crypto ArbitrageVisualizes the price difference (deviation) off BTC/ETH across multiple exchanges (Spot and/or Perpetuals)
Spot prices are represented by circles, while perpetual prices are shown as crosses.
Spot:
Binance
FTX
Bitfinex
Coinbase
Perpetuals:
Binance
FTX
Bybit
BitMEX

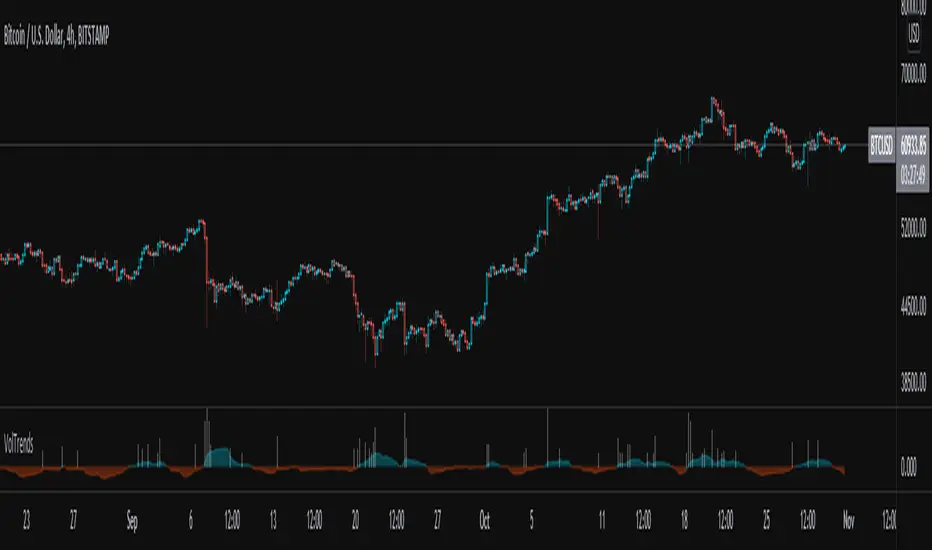
Volume TrendsThis script provides clear volume trends on any time frame. You set a long term volume trend moving average (ex 100 periods). A shorter term MA of your choice (10 in this example) will oscillate above and below based on the standard deviations of its current value relative to the long term #.
Similarly, large volume bars are plotted in terms of st dev above the long term MA.
Very useful in spotting capitulation bottoms and/or blow-off tops.
Standard deviation of the exponential moving average
This indicator emphasizes price movements when it moves away from or closer to the chosen moving average, within the envelope of its standard deviation. It serves as a complement to other indicators or can be used within a strategy by itself.

Tradingview ToolkitA new trader's biggest barrier to entry is lack of understanding where they are in terms of time and price and with tradingview free they are often limited to just 1 or 2 extra indicators as many new traders slap on RSI and MACD as 2/3 free ones. While these indicators are fine for trend analysis, its important to know where the price is in relation to time. Thus, this all-in-one script is meant to have a lot of customizable utility to save on indicator spots and act as a hotspot for many common needs.
-2 Sets of VWAP line w/ standard deviation bands with customizable timeframes.
-1 more customizable timeframe VWAP line (no std dev bands) to use as a long time frame reference
-Ability to plot previous VWAP close prices over current timeframe on all VWAP lines w/ basic color changing if price closes above/below
-2 Sets of Bollinger Bands with customizable source length and MA type
-3 customizable moving averages with custom timeframe/resolutions
-Inside candle barcolor repainter to easily notice if a candle was inside the range of the previous candle (price contraction)
Not meant to have everything on at once, but simply a place to enable and disable different things and save spots for more important things

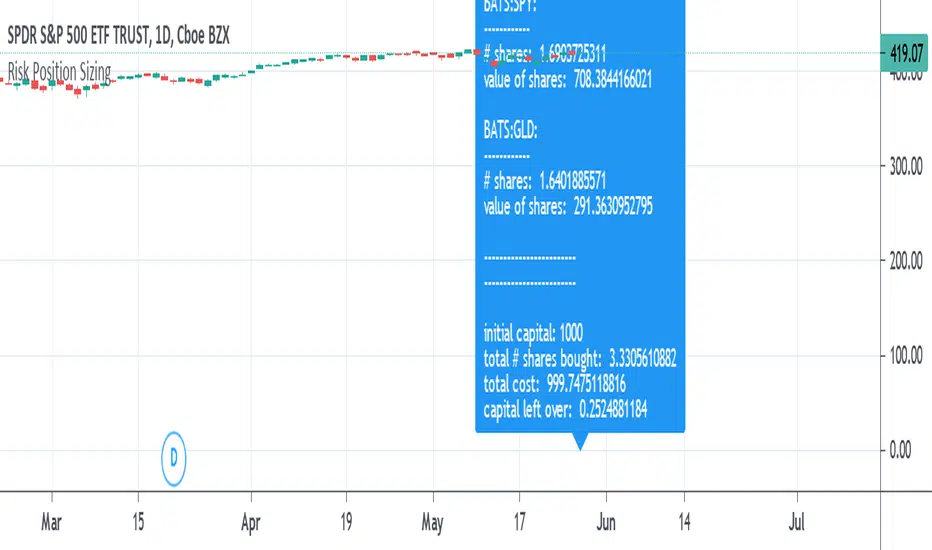
Risk Position Sizing tool using Coefficient of VariationA way to manage portfolio risk using relative standard deviation, also known as coefficient of variation. This tool tells you how much of each stock in shares and in value to buy adjusted for their volatility risk for a given starting account capital. A problem many people have is how to diversify an account and adjusting it for the risk involved in each equity. Many would put in an equal amount of capital value into each share but is it really equal if some equities have more risk than others? A solution is to adjust the portfolio by giving less weight to those that are more volatile or risky. It's done by using a starting percent of the account, preferably a small percent of it, and buying up shares with that same amount for each equity. Each equity will also be divided by the COV to risk adjust the portfolio by giving less weight to the more volatile stocks. This is done until as much of the initial capital in the account as possible is spent.
COV is how far away the price is from the mean or average. The further the price is from the mean the more risk or volatility there is. It uses standard deviation in its calculation. The problem with SD and ATR is that they are not relative to the past or to other equities to compare to. An application where COV can be used is risk portfolio management formulas. This does not take into account correlation or other equation parts in some portfolio management formulas but only the risk or volatility, the default volatility length is mostly arbitrary, and the lower risk stocks may end up being the slowest in performance.
The text label will show how many shares will be bought and how much value each equity will have. At the end it will show the initial capital that was started off with, the total shares bought, the total value of all the shares, and the amount of capital left over. If the sources are not blank then they will be used, to blank them you will need to reset the settings to default otherwise they might still be read. If you want to add more than the given 10 equity spaces to the portfolio then you will need to add in the code manually and add it to the chart. The denominator is perhaps the important part in these types of risk position sizing tools, you can change to other things such as risk-reward ratio instead of volatility or change the volatility type, etc.
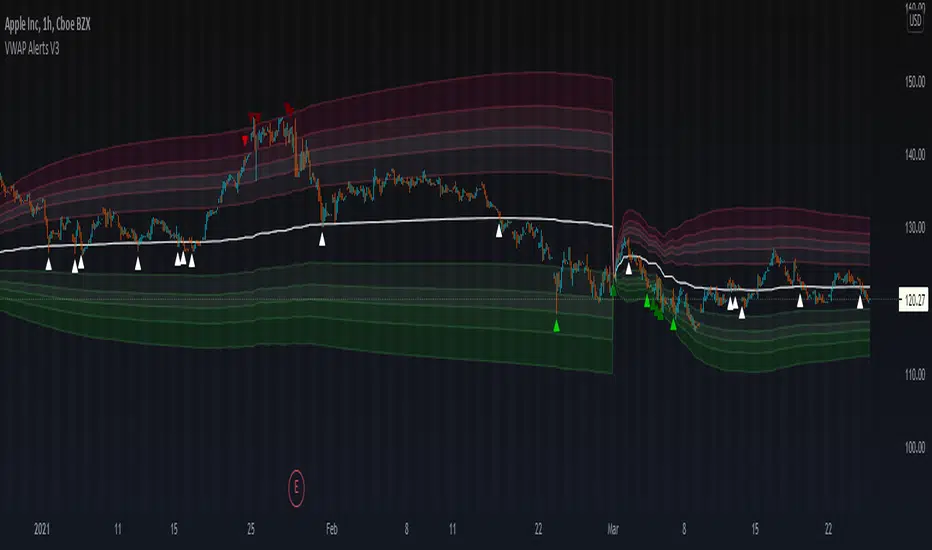
VWAP Alerts V3VWAP Alerts signal over bought/over sold conditions, relative to volume weighted average price, while deviation bands plot an extremely accurate point of mean reversion.
VWAP Alerts V3 includes multiple timeframe selection, along with multiplier input for deviation band setting
Alerts can be set for each individual band, for extreme oversold/overbought conditions, use "Vwap Low Deviation 4" and "Vwap High Deviation 4".
Alerts can also be set for VWAP bounces, by simply setting "VWAP Alert"
Exponential Deviation Bands Width [ChuckBanger]This indicator is a compliment to Exponential Deviation Bands . It is the difference between the upper and the lower bands divided by the middle band. It is an easy way to visualize consolidation before price movements or periods of higher volatility.
How it works
During a period of high volatility, the distance between the two bands will widen and Exponential Deviation Bands width will increase. And the opposite occurs during a period of low volatility, the distance between the two bands will contract and Exponential Deviation Bands width will decrease. Meaning there is a tendency for bands to alternate between expansion and contraction.
When the bands are relatively far apart, that is often is a sign that the current trend is ending. When the distance between the two bands is relatively narrow that often is a sign that the market is about to initiate a bigger move in either direction.

VWAP + Fibo Dev Extensions StrategyBased on my VWAP + Fibo deviations indicator, I tested some strategies to see if the indicator can be profitable; and I got it !
This strategy uses:
H1 timeframe
Weekly VWAP
+1.618 / +2.618 / -1.618 / -2.618 Deviations Extensions to create 2 bands
The value of the deviation
First, the 2 bands are plotted : +1.618/+2.618 painted in red and -1.618/-2.618 painted in lime.
Then, we wait for the deviation value to reach at least 150 (see thumbnail) to avoid littles moves when the gaps between bands are too short.
Entry long position :
first candle must crossunder the -1.618 level and low have to stay over the -2.618
low of the second one must stay in the lime band
enter the third one if the deviation value is over limit (150)
Exit long position :
TP : when a high crossover VWAP
SL : when a low crossunder -2.618
Entry short position :
first candle must crossover the +1.618 level and high have to stay under the +2.618
high of the second one must stay in the red band
enter the third one if the deviation value is over limit (150)
Exit short position :
TP : when a low crossunder VWAP
SL : when a high crossover +2.618
Notes :
this strategy uses pyramiding (5), be careful and calculate your risk management
the comission value is set to 0.08% to include slippages when entering a trade because of market orders
This strategy is not an advice to invest, make your own decisions.


Volume Weighted DeviationsVolume !weighted!
deviations.
Important: I don't really know how people generally compute deviations from VWAP/VWMA, but smth tells me generally it's just a Av Dev/St Dev based on mean, not on appropriate basis, like volume weighted mean in our case. This version is mathematically correct, it first calculates weighted mean, than utilizes this weighted in mean in AvDev & StDef functions modified to take into account weights.

Spread by//Every spread & central tendency measure in 1 script with comfortable visualization, including scrips's status line.
Spread measures:
- Standard deviation (for most cases);
- Average deviation (if there are extreme values);
- GstDev - Geometric Standard Deviation (exclusively for Geometric Mean);
- HstDev - Harmonic Deviation (exclusively for Harmonic Mean).
These modified functions will calculate everything right, they will take source, length, AND basis of your choice, unlike the ones from TW.
Central tendency measures:
- Mean (if everything's cool & equal);
- Median (values clustering towards low/high part of the rolling window);
- Trimean (3/more distinguishable clusters of data);
- Midhinhe (2 distinguishable clusters of data);
- Geometric Mean ( |low.. ... ... .. .... ... . . . . . . . . . . . .high| this kinda data); <- Exp law
- Harmonic Mean { |low. . . . . . . . . . . . . . .. . . .high| kinda data). <- Reciprocal law
Listen:
1) Don't hesitate using Standard Deviation with non-mean, like "Midhinge Standard Devition", despite what ol' stats gurus gonna say, it works when it's appropriate;
2) Don't check log space while using Geometric Mean & Geometric Standard Deviation, these 2 implement log stuff by design, I mean unless u wanna make it double xd
3) You can use this script, modify it how you want, ask me questions whatever, just make money using it;
4) Use Midrange & Midpoints in tandem when data follows ~addition law (like this . . . . . . . . . . . . . . . . . . . . .). <- just addition law
Look at the data, choose spread measure first, then choose central tendency measure, not vice versa.
!!!
Ain't gonna place ® sign on standard deviations like one B guy did in 1980s lmao, but if your wanna use Harmonic Deviations in science/write about/cite it/whatever, pls give me a lil credit at least, I've never seen it anywhere and unfortunately had to develop it by myself. it's useful when your data develops by reciprocals law (opposite to exponential).
Peace TW

VAMA Volume Adjusted Moving Average BandsThis indicator is standard deviation bands using a live analysis adaptation of Richard Arms' Volume Adjusted Moving Average as their basis. VAMA utilizes a period length that is based on volume increments rather than time.
• SampleN - N volume bars used as sample to calculate average volume , 0 equals all bars.
• VAMA Source - Price used for volume weighted calculations.
• VAMA Length - Specified number of volume ratio buckets to be reached.
• VAMA VI Fct - Size of volume ratio buckets.
• VAMA Strict - Must meet desired volume requirements, even if number of bars has to exceed VAMA Length to do it.
• STDV Factor - Standard Deviation multiplier.
• STDV Length - Standard Deviation period.
• Brightness - Color opaqueness for the band fills.
Please see previous published example here for more details on VAMA's usage and inability to redraw the past on time based charts.
NOTICE: This is an example script and not meant to be used as an actual strategy. By using this script or any portion thereof, you acknowledge that you have read and understood that this is for research purposes only and I am not responsible for any financial losses you may incur by using this script!
