Directional Movement Index (DMI)

[Delphi][CryptoNews Plus] RSI + DMI ADXRSI + DMI ADX
Inner Version 1.0 07/02/2019
Developer: iDelphi
07/02/2019 Added RSI
07/02/2019 Added ADX

Strength & Directional Movement [CP]This my version of the ADX & DI indicator, fixed the code, ported to Pine Script v3 and loaded up with filters for your smoothing pleasure.
I have some info below on how to read this indicator, be sure to take a look!
Wilder’s DMI (ADX) consists of three indicators that measure a trend’s strength and direction.
Three lines compose the Direction Movement Index (DMI): ADX (black line), DI+ (green line) and DI- (red line).
The Average Directional Index (ADX) line shows the strength of the trend. The higher the ADX value, the stronger the trend.
According to Wilder, a trend is present when the ADX is above 25. DMI values range between zero and 100.
The Positive Directional Indicator (+DI) and Negative Directional Indicator (-DI) show the current price direction.
When the DI+ is above DI-, current price momentum is up.
When the DI- is above DI+, current price momentum is down.
DI Crossovers:
Traders could enter a long position when the DI+ line crosses above the DI- line and set a stop-loss order under the current day’s low.
When the DI- line crosses above the DI+ line, traders could place a short position with a stop above the high of the current day.
Irrespective of whether the trader takes a long or short position, the ADX should be over 25 when the crossover occurs to confirm the trend’s strength.
When the ADX is below 20, traders should use trading strategies that exploit range bound conditions
DI Contractions and Expansions:
The DI+ and DI- line move away from each other when price volatility increases and converge toward each other when volatility decreases.
Short-term traders could enter trades when the two lines move apart to take advantage of increasing volatility.
Swing traders might accumulate into a position when the lines contact in anticipation of a breakout.
The +DI generally moves in sync with price, which means the +DI rises when price rises, and it falls when price falls.
It is important to note that the -DI behaves in the opposite manner and moves counter-directional to price.
The -DI rises when price falls, and it falls when the price rises. This takes a little getting used to.
Just remember that the strength of a price move up or down is always recorded by a peak in the respective DMI line.
Reading directional signals is easy. When the +DI is dominant and rising, price direction is up.
When the -DI is dominant and rising, price direction is down. But the strength of price must also be considered.
DI strength ranges from a low of 0 to a high of 100. The higher the DI value, the stronger the prices swing.
DI values over 25 mean price is directionally strong. DI values under 25 mean price is directionally weak.

ADX Suavizado + DMI com Periodo RDNAdicione rafdourado para maiores informações de uso ou dicas para aprimoramento

DMIBBDirectional movement indicator for assessing price direction and strength. DMI tells you when to be long or short, differentiatING between strong &weak trends. DMI works on all time frames and applicable to any asset.
DMI is a moving average of range expansion over an input period. The positive directional movement indicator (+DMI) measures how strongly price moves upward; the negative directional movement indicator (-DMI) measures how strongly price moves downward. The two lines reflect the respective strength of the bulls versus the bears. Which DMI lines is on top is the dominant DMI. The dominant DMI is stronger and more likely to predict the direction of price. For the buyers and sellers to change dominance, the lines must cross over.
Added feature is Bollinger Bands to moderate signals.
ADX Crossover + BarColor v0.1Цвет бара показывает текущий тренд. Красный - падающий, зеленый - растущий. Желтый знак показывает начало или усиление тренда, флаг - завершение тренда, начало консолидации или следующего тренда

MultiTime_ADX&DM_V1Wilders Directional Movement Index & ADX
With three different lines that you can change
With two Signals that you can turn on and off
When you change the lines, the signals also change
You can activate alerts depending on the signals
The displayed time frame is changeable

modified DMI with MTF and alertsThis is special indicator based on DMI , I add to time length MTF that is not repainting
you can change the MTF using int2 function
the alerts are based on crossing the 0 (up or down)
I hope you like it
with no MTF

Directional Index OscillatorDirectional Index Oscillator (DIOSC) is +DI and -DI diferrence oscillator.
You can use this indicator 2 different way.
1. Cross over and cross under with DIOSC and its MA.
2. Price and indicator divergences.
BUY Signal: If DIOSC is red (and relatively big at negative side) and cross over the MA line. Or DIOSC have a positive divergence with price lows.
SELL Signal: If DIOSC is green (and relatively big at positive side) and cross under the MA line. Or DIOSC have a negative divergence with price highs.


DMI ADX TREND 2.0 (edit by GeertVD)Edit of the popular script by @TraderR0BERT
New features:
- horizontal colored areas, indication weak/medium/strong trend
- vertical bars, signaling trend/momentum changes
- DI+ vs DI- contraction/expansion histogram (to measure the DI volatility)


stoch rsi dmi plusSo in this indicator I put the improved DMI together with stoch rsi
the area in light blue are buy zone by the improved DMI
the area in light red are potential sell zone by the improved DMI
the green columns are stoch rsi crossing up
the red columns are stoch rsi crossing down

improved DmiThis is a new indicator that make the normal DMI better
insread of the ADX I put a volume indicator that have been transformed to be on regular scripts
with this it much more easy to spot the true buy and sell points by the DMI
have fun


[RS]Volume Rsidmi This indicator has the following:
1. volume rsi based on Ricardo Santos great work
2.DMI
3.fib candle
the buy points are based on volume break of rsi (not rsi) filter by DMI and the candle fib based on fibo points
sell point the same just in reverse
this indicator give you volume based on rsi to gether with other stuff so the buy points seems to be more accurate and it not repainting.
I hope you will like it

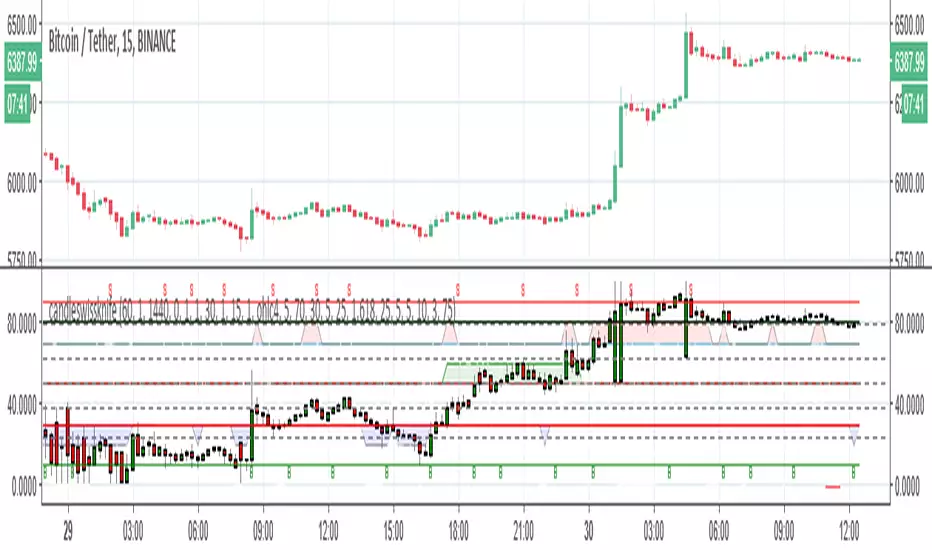
candleswissknifethere are two system to buy and sell in this indicator
system 1 is based on long ema and short ema with heiken candle and macd filter (green=buy and red=sell) line bellow the candles)
system 2 is based on fib candle and fast rsi and fast adx crossing (blue=buy line and gray=sell line bellow candle)
B and S are points of stoch rsi crossing
inside there are points of divergence based on ATR and rsi
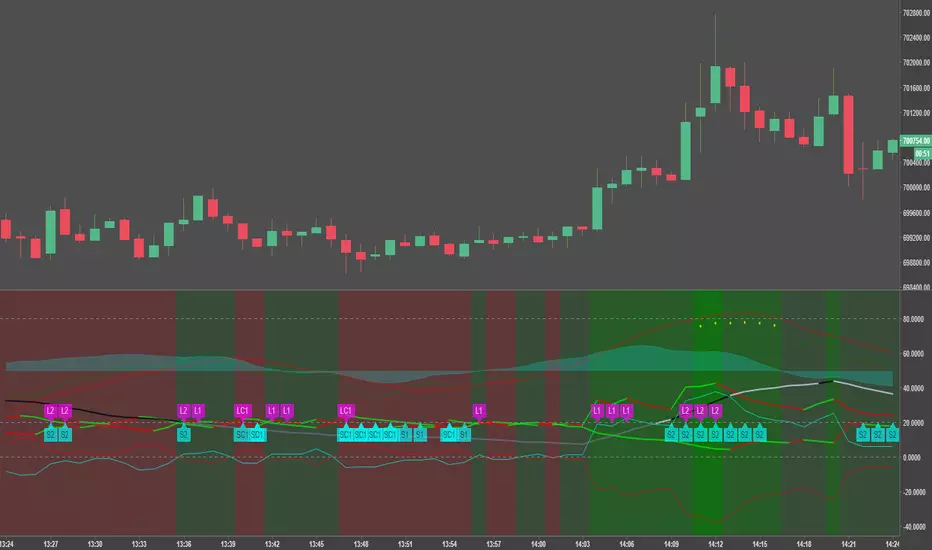
swissknife system all in oneSO how this system work
1. B and S top and button are stoch cross points
2.the area highlighted in blue and red are zone where RSI DMI and ATR are in agreement
3. The candles are based on fibonaci so if the candle are below 10 is low fib and if above 90 its high fib
so how to find best buy points
1. search for B points the fall in blue area =RSI low and D- high
2.sell points =s that fall in red area =high rsi + D+ high
3. the candle based on fib so it easy to see if the points potential buy and sell fall in high or low fib
4. potential buy and sell points can also be found on base of cross of D- and D+ adding adx make it easy
in this version no alert but in next version I try to put something on it :)

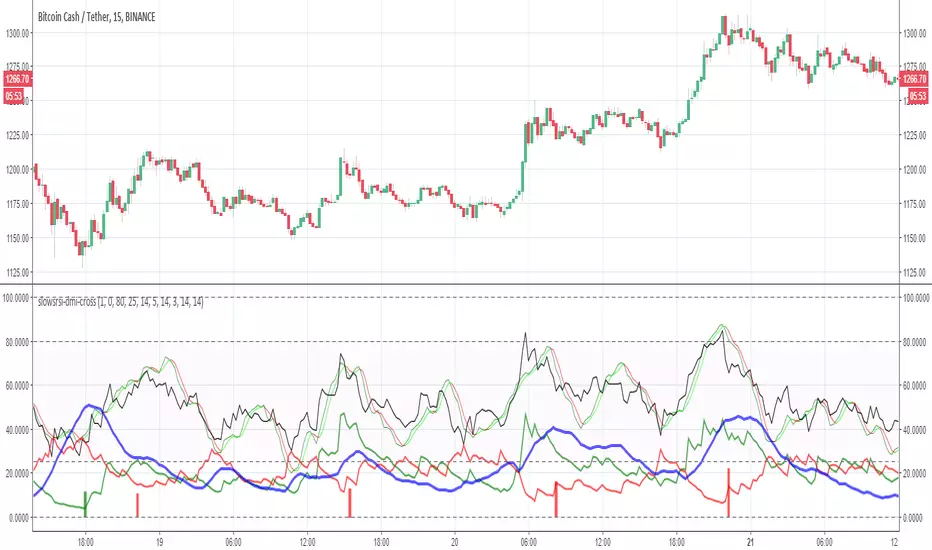
slowsrsi-dmi-crossThis model is based on buy and sell points according to rsi +DMI and the cross up of slow stoch