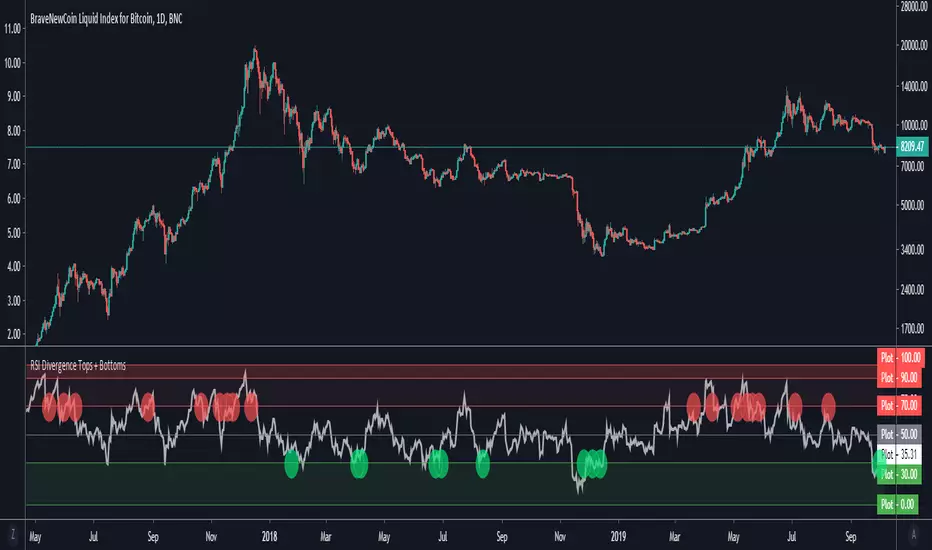
RSI Divergence Tops + BottomsRSI Indicator which plots local peaks and troughs in divergence.
Divergence is specified as:
- A higher price, with reduced RSI --> Potential Sell Point
- A lower price, with higher RSI --> Potential Buy Point
RSI Divergence should be used in combination with other indicators. This indicator identifies local tops and bottoms, with potential for macro trend shifts.
Read more about trading RSI Divergence on Investopedia here: www.investopedia.com
Divergence
InfoPanel Divergence IndicatorThis panel spots divergences of some well knonw indicators. It may be usefull because you have all indicators in one panel only.
Also, you can check on chart which indicator gives better results of each pair on stock or index or crypto.
TO DO: to add custom indicators.
thanks to: RicardoSantos for his script of panel coding
Tradingview scripts
Other members of TV community (I cannot remember the source and inspiration of all snipets)
Please use comment section for any feedback.

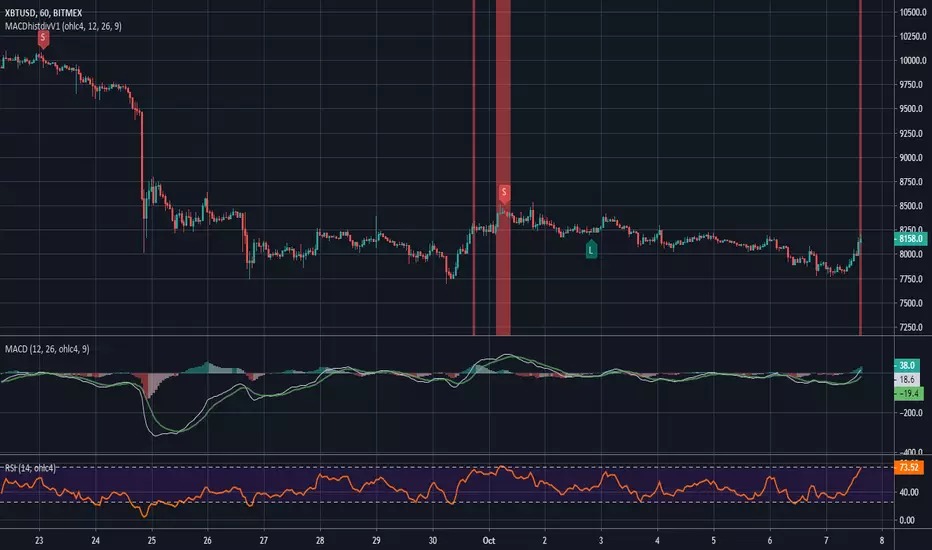
MACD and RSI divergence by Rexio v2Hi everyone!
I wrote this indicator for intraday trading and it cannot be use only by itself you need to at least draw some S/R lines to make it useful. It is based at MACD histogram and gives signal when it sees divergence on MACD/RSI/MACD's Histogram (or all at once - settings) when macd's histogram switchs trend. Im using it to playing with a trend most of the time looking for hidden divergence at higher time frame and after that looking for regular divergence at lower time frame.
Im not a computer programist nor professional trader so it is only for educational purposes only.

MACD histogram divergence by Rexio v1Hi everyone!
I wrote this indicator for intraday trading and it cannot be use only by itself you need to at least draw some S/R lines to make it useful. It is based at MACD histogram and gives signal when it sees divergence on MACD's Histogram when macd's histogram switchs trend. Im using it to playing with a trend most of the time looking. It highlights candles which can give good singnals to play with a trend (its based on ema200 and RSI overbought and oversold zones).
Im not a computer programist nor professional trader so it is only for educational purposes only.
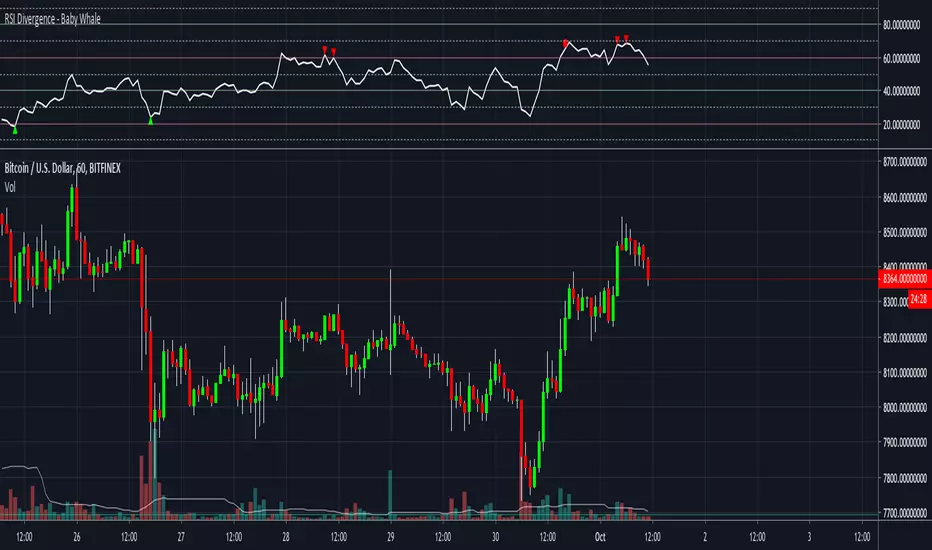
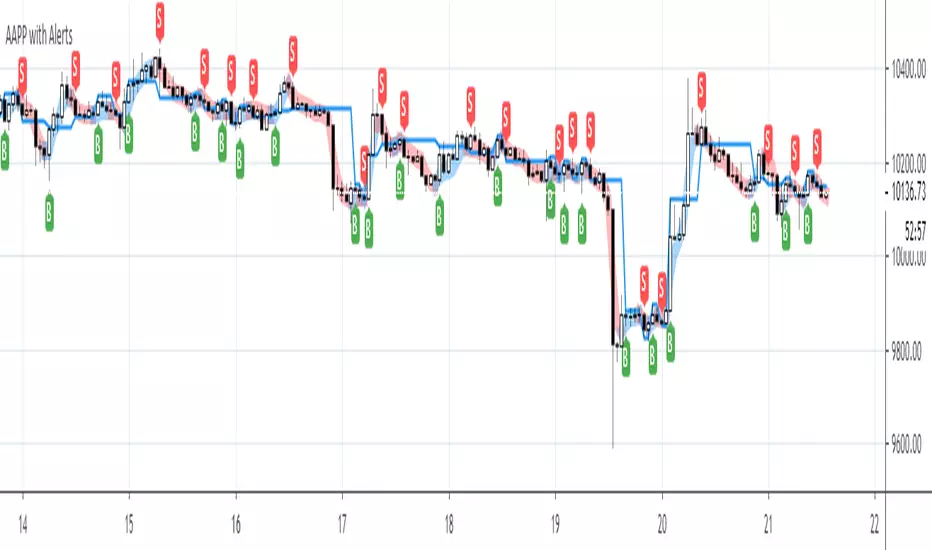
RSI Divergence - Baby WhaleHey guys!
BabyWhale here!
I will open source my scripts, so everyone can use them and update.
In this RSI Divergence script I added Hidden Divergence (beta) as well.
This script will show you:
Bullish Divergence (green triangle)
Hidden Bullish Divergence (green circle)
Bearish Divergence (red triangle)
Hidden Bearish Divergence (red circle)
You can set the RSI values.
I recommend 60 / 40 or 70 / 30.
Last but not least, you can set alarms when a Divergence or Hidden Divergence is found.
Feedback is always welcome!
Credits to @Libertus, I used his script as inspiration.
Good luck with trading!
BabyWhale
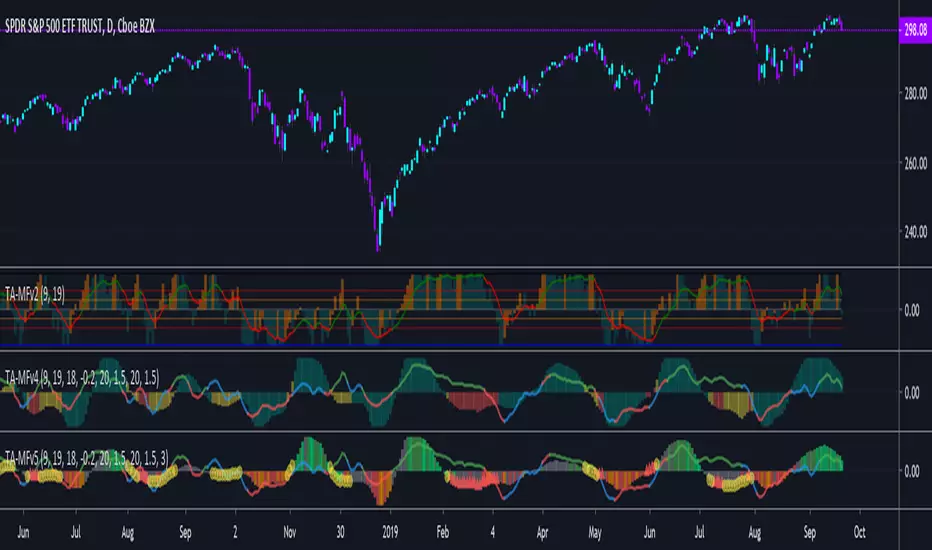
TA-Money Flow-Version5This is the MACD of a stochastic OBV movement indicator, Squeeze Momentum Indicator, and addition coloring for Market Direction Indicator . It is good (right) to work with both price and volume.
In this version we've moved the divergence highlighting to symbols at the ends of the histograms. Same coloring scheme as previous, yellow is divergence of either OBV or SQZ , red is both divergence. In the previous version we added in the "squeeze on - blue" highlighting to show follow through of divergence (or just squeeze/stall). We also added in another old script, but colors so well, Lazybears (Market Direction Indicator, linked below). Also incorporated a 3 color or 5 color scheme from the MDI script as a bool. It works great on any time frame, but you need to have volume data. Not sure where I originally got this (stoch-OBV, somewhere off Tradingview several years ago, thanks to the person who shared), Squeeze/MDI is Lazybear, links below.
Enjoy.
Version 5:
Moved divergence highlighting to symbols on histogram
Added coloring based on MDI
TA-Money-Flow-Version4
TA-Money-Flow-Version3
TA-Money-Flow-Version2
Squeeze-Momentum-Indicator-LazyBear
Market-Direction-Indicator-LazyBear
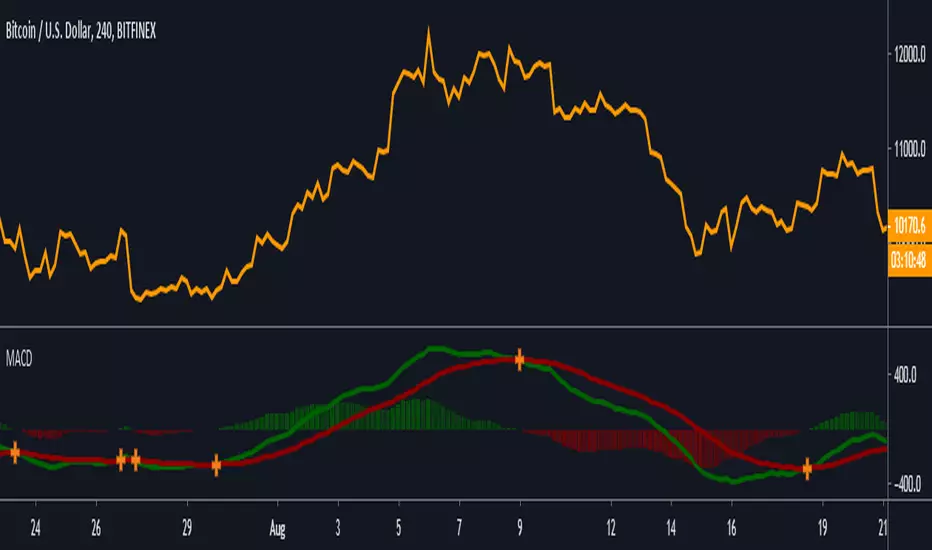
MACD [Gu5]Extremely popular indicator MACD (Moving Average Convergence/Divergence)
Same design of my previous indicators
Show Cross Line for a better visualization
```
Setting recommended for BTC
"Fast Length" = 21
"Slow Length" = 55
"Signal Smoothing" = 14
Other markets try
"Fast Length" = 12
"Slow Length" = 26
"Signal Smoothing" = 9
```
--
El MACD (Convergencia/Divergencia de Medias Móviles) es uno de los mas populares indicadores
Continuando con el mismo estilo de diseño de mis anteriores indicadores
Destaca el cruce de medias para una mejor visualización
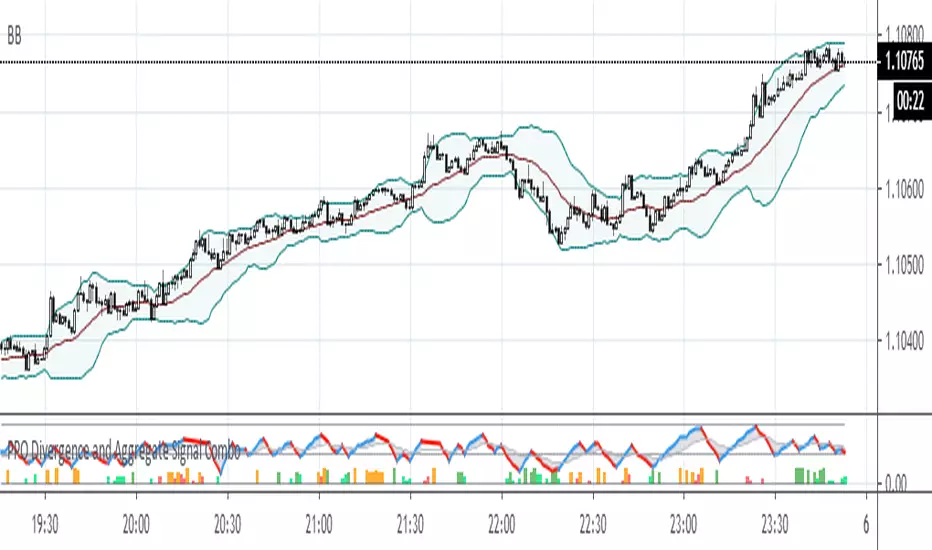
PPO Divergence and Aggregate Signal ComboThis is a further development of the last two posts on aggregated signal generation. It shows how to implement the idea in conjunction with another indicator. In this case general rule for long and short entry: the aggregated curve (gray) must cross the mid-line. Colored columns serve as an early warning. Settings were tested with EURUSD in 5m, 30m and 1H TFs.
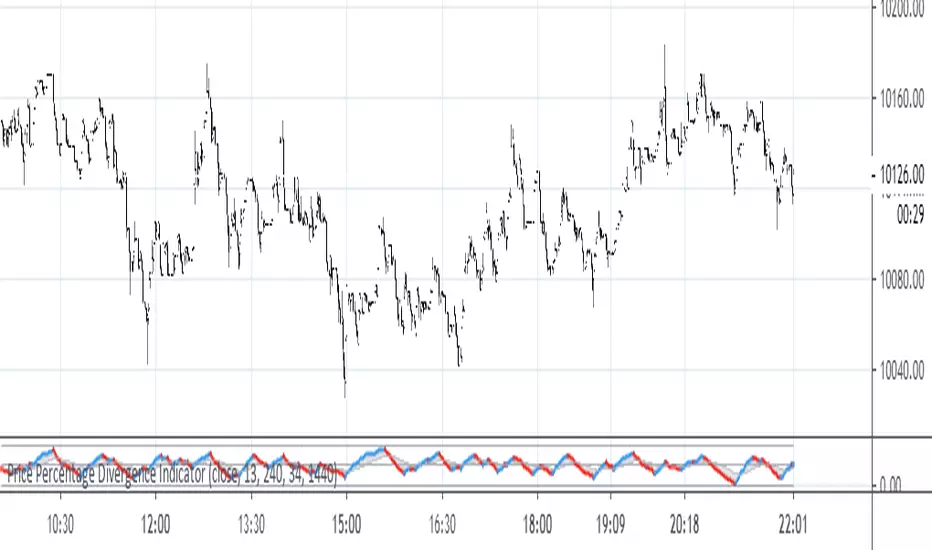
Price Percentage Divergence IndicatorThis is a price percentage divergence ( PPO ) indicator. It may as well be called a turning points indicator.)
MG - Real time RSI divergenceShows RSI divergences in real time (as soon as bar closes in divergence instead of waiting for an RSI pivot).
There are alerts included on these events so you are immediately made aware of divergence.
Adjustement:
It works by detecting a break of a previous high or low and then comparing the RSI value at the last break to the current break. Therefore, by decreasing the adjacent candles required for a pivot, you increase the number of divergence checks and therefore divergence readings. As with many indicators, with higher the values, you get less but more significant signals. (This can be visualized with the plot pivot lines option)
RSI period can be adjusted


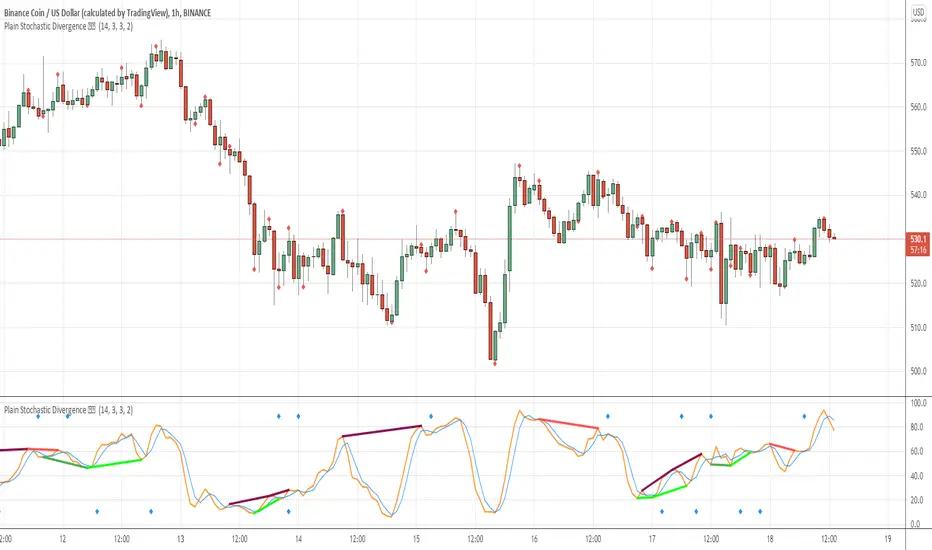
Plain Stochastic Divergence Stochastic Divergence
Plain simple way of calculating divergences
We all have times when we want to see just the divergences and nothning else
This script is minimalised to visualize that
references :
// stochastic // divergence // stoch //
PriceDivergence (ps4)This script implements price divergence module using signals from several factors like:
RSI, RSI Stochastic, MACD, Volume MA, Accumulation/Distribution, Fisher Transform and CCI

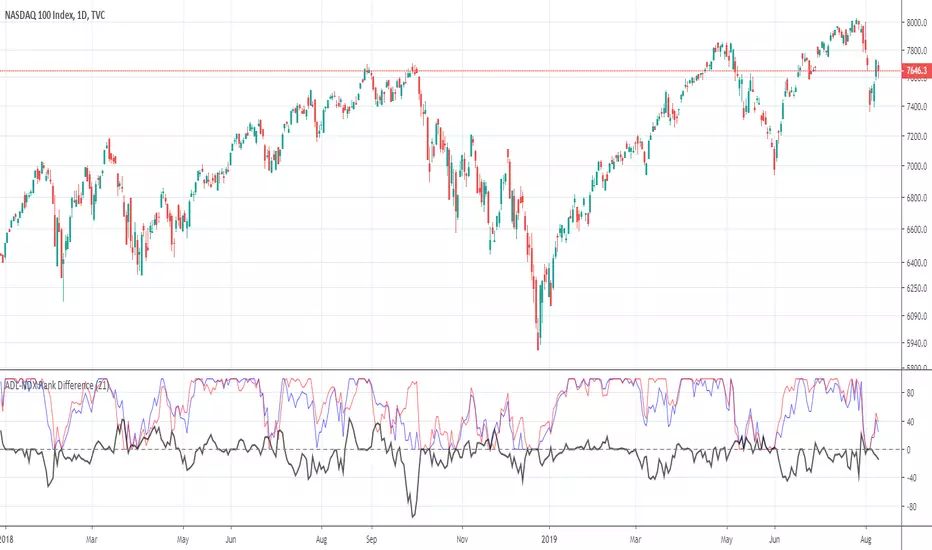
ADL-NDX Rank Difference-Buschi
English:
An expansion of the Advance Decline Line of the NASDAQ. It can be interesting to compare the Advance Decline Line with the corresponding benchmark index. I therefore made a ranking (0 to 100) based on the performance over the last days (default: 21 days). The difference is the target figure and ranges between -100 (bearish divergence) to +100 (bullish divergence).
Deutsch:
Eine Erweiterung der Advance Decline Line der NASDAQ. Oft möchte man den Verlauf der Advance Decline Line mit dem zugehörigen Leitindex vergleichen. Daher habe ich für beide ein Ranking (0 bis 100) erstellt auf Basis des Verlaufs über die letzten Tage (Standardwert: 21 Tage). Die Differenz stellt dabei die Zielgröße dar und schwankt zwischen -100 (bärische Divergenz) und +100 (bullische Divergenz).
ADL-SPX Rank Difference-Buschi
English:
An expansion of the Advance Decline Line of the NYSE. It can be interesting to compare the Advance Decline Line with the corresponding benchmark index. I therefore made a ranking (0 to 100) based on the performance over the last days (default: 21 days). The difference is the target figure and ranges between -100 (bearish divergence) to +100 (bullish divergence).
Deutsch:
Eine Erweiterung der Advance Decline Line der NYSE. Oft möchte man den Verlauf der Advance Decline Line mit dem zugehörigen Leitindex vergleichen. Daher habe ich für beide ein Ranking (0 bis 100) erstellt auf Basis des Verlaufs über die letzten Tage (Standardwert: 21 Tage). Die Differenz stellt dabei die Zielgröße dar und schwankt zwischen -100 (bärische Divergenz) und +100 (bullische Divergenz).

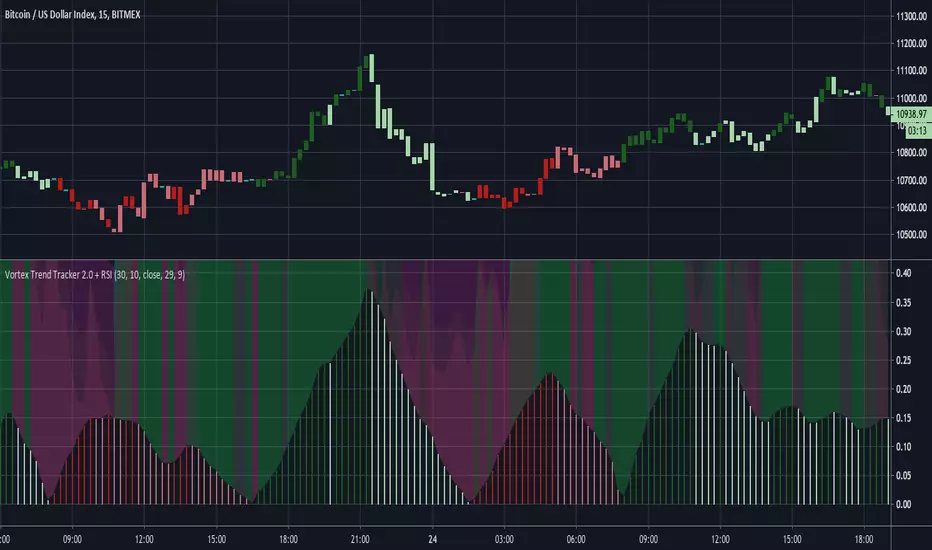
Vortex Trend Tracker 2.0 + RSIHere's an updated version of our Vortex Trend Tracker indicator.
Here's the link to the original if anyone wants to read more about the Vortex or see the first version:
We've added in 4 rsi's of varying lengths for this second version(2 fast and 2 slow) that create the background color effect.
Vortex Trend TrackerThough it may sound complex, the Vortex Indicator is essentially an uptrend line and a downtrend line. The vortex indicator can be used for a variety of purposes, including tracking the strength of trends, identifying/anticipating reversals, and generating entry/exit signals. It’s calculation is shown in the open-source code below.
To reduce the number of whipsaws produced by the indicator, we used an Exponential Moving Average of vmPlus and vmNegative values with a default length of 10. Decreasing this length will result in a more responsive vortex at the cost of more whipsaws and false signals.
The chart shows the absolute value of the difference between the uptrend and downtrend line displayed as the main histogram.
If the uptrend line is greater than the downtrend (thus indicating positive movement), then the histogram bars will be either light green or dark green. If the uptrend line has just now crossed the downtrend line, then the bar will be dark green. Bars will also be dark green when the uptrend line is greater than the downtrend line and the uptrend line is increasing. This means the trend is increasing in strength still. If the uptrend line is greater than the downtrend line, but is decreasing, then the bars will be light green. This means that the upwards trend is losing strength.
If the downtrend line is greater than the uptrend line, then there is a negative trend occurring and the bars will be either red or light red. If the downtrend line has just crossed over the uptrend line or is increasing in value, then the bar will be red. If the downtrend line is greater than the uptrend line, but is decreasing in value, then the bars will be light red (meaning the downtrend is weakening).
One way to trade using this vortex is to enter a long position when the bar color changes from red to light red. This would mean that the downtrend is decreasing in strength and an upwards reversal is likely to occur soon. Then, traders can exit their long position when the bars change from dark green to light green. When that color change occurs it means that the uptrend is running out of steam and price is unlikely to continue its upwards climb.
Traders can also choose to have the uptrend and downtrend lines plotted as well in the input menu. This may make it easier to visualize the Vortex and its usefulness in identifying reversals.


MACD Price Divergence indicatorIndicator for divergence between MACD trend and price trends. Try it out and let me know what you think!

VWMA/SMA Breakout and Divergence DetectorThis indicator compares four different values :
-Fast Simple Moving Average(SMA)
-Fast Volume Weighted Moving Average(VWMA)
-Slow SMA
-Slow VWMA
Comparing SMA's and VWMA's of the same length is a common trading tactic. Since volume is not taken into consideration when calculating Simple Moving Averages, we can gain valuable insights from the difference between the two lines.
Since volume should be increasing along with an upwards price movement, the VWMA should be greater than the SMA during a volume-supported uptrend. Thus, we can confirm an uptrend if the VWMA remains greater than the SMA. If the VWMA falls under the SMA in the midst of an upwards price movement, however, that indicates bearish divergence. The opposite is true for downtrends. If price is decreasing and volume is decreasing at the same time (as it should), then we can confirm the downtrend.
Interpreting the Graph:
If the slow SMA is greater than the slow VWMA, then the area representing the difference between the two lines is filled in red. If the slow VWMA is greater than the slow SMA, however, the area between the two is filled green.
If the fast SMA is greater than the fast VWMA, then the area between the two dotted lines is filled in red. On the other hand, the area will be filled green if the fast VWMA is greater than the slow SMA.
In addition to spotting divergences and confirming trends, the four lines can be used to spot breakouts. Typically, a VWMA crossover will precede the SMA crossover. When the fast VWMA crosses over the slow VWMA and then a SMA crossover follows shortly after, then it is a hint that a bullish trend is beginning to form.

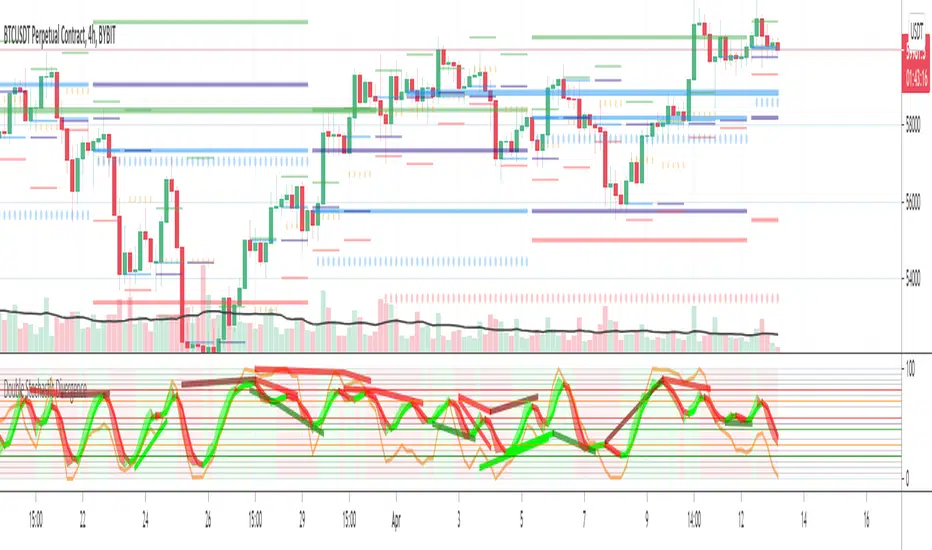
Double Stochastic DivergenceSame as my protected script but you can now see the code
This Study plots divergences and overlays a second %K as a fractal and changes the color of %D for the non fractal
Option to use Stochastic RSI for Fractal
Background Shading according to trend
Feel Free to change the indicator values to suit your style / system
The divergence script is thanks to @RicardoSantos, I've just adjusted it to suite my indicator
Remember that divergences work best when traded with the trend or very late in a trend when going against the trend
Common value for %K is 5, I have chosen 3 as it gives faster entries when using multiple time frames
If you are not using a momentum indicator as a trailing stop and using only cycle indicator
then I would recommended %K be 4 for exits
Multi Divergence Overlay +This Indicator overlays Divergences lines and labels on the chart from multiple sources including RSI, RSI Signal Line and 2 Stochastics and more
The Colors and Labels match my other Divergence Indicators
The divergence script is thanks to @RicardoSantos, I've just adjusted it to suite my indicator
Remember that divergences work best when traded with the trend or very late in a trend when going against the trend
The + Part of this indicator is that it now plots
Exhaustion pivots
&
Bob Rooker - Reversal Tabs and Knoxville Divergences
