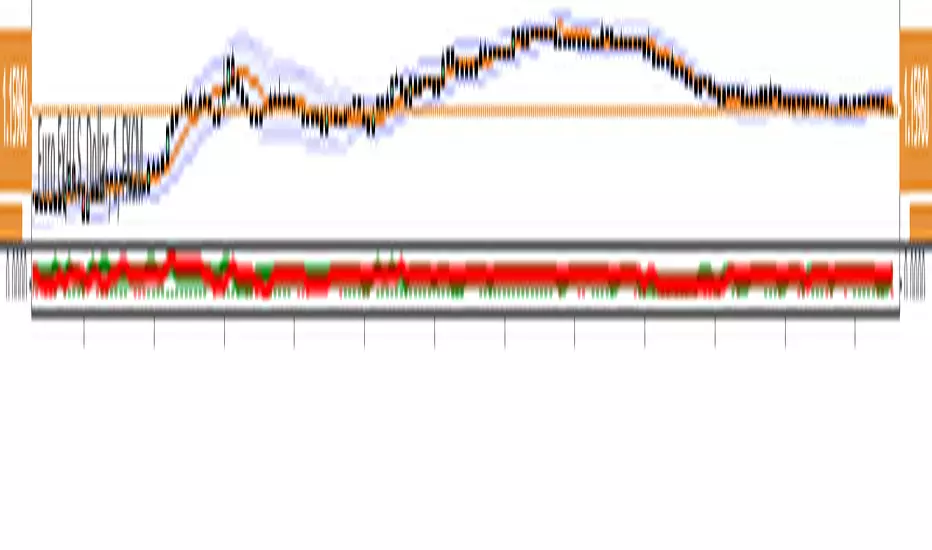
Mean Reversion and Momentum - Indicator versionMean Reversion and Momentum
Interpretation:
- Divergence means trend reversal
- Parallel movement means trend continuation
Squares above serve as a confirming signal
Divergence
RSI or MFI %BPlots where RSI or MFI is inside its Bollinger Bands. Various strategies: good to see the trend (above/below average), overbought/oversold conditions (you could work a strategy around RSI getting out of overbought/oversold conditions as shown in the screenshot), divergences, etc...
I will also publish a Bollinger Bands width of RSI to identify areas of squeeze in volatility
Enjoy!

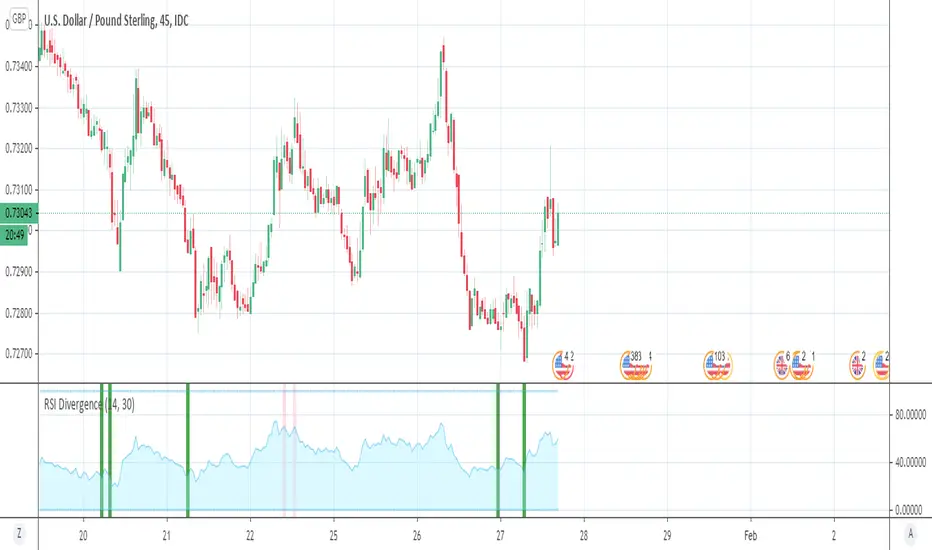
RSI DivergenceSimple RSI Divergence with adjustable lookback period.
Highlights bars with higher price but lower RSI (bearish) or lower price but higher RSI (bullish) than the highest/lowest points in the lookback period.
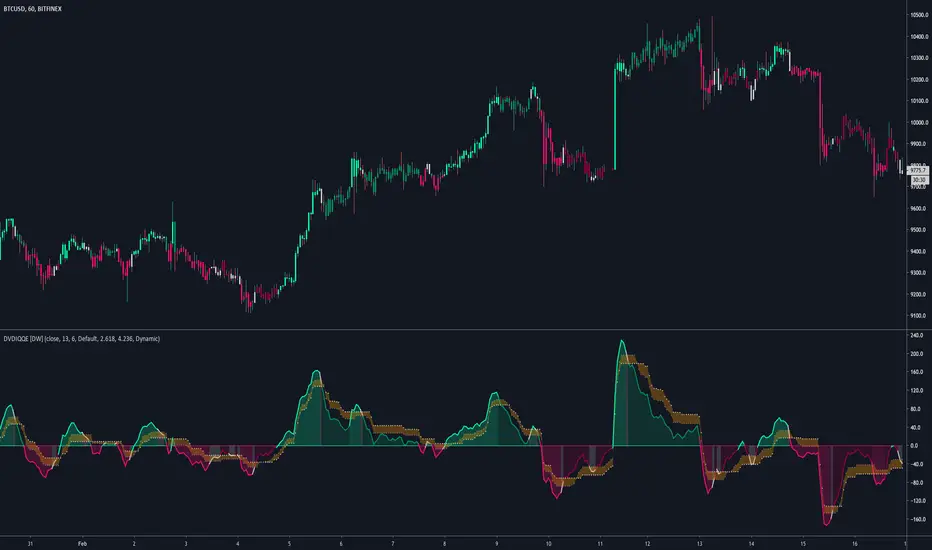
DVDIQQE [DW]This is an experimental study inspired by the Quantitative Qualitative Estimation indicator designed to identify trend and wave activity.
In this study, rather than using RSI for the calculation, the Dual Volume Divergence Index oscillator is utilized.
First, the DVDI oscillator is calculated by taking the difference between PVI and its EMA, and NVI and its EMA, then taking the difference between the two results.
Optional parameters for DVDI calculation are included within this script:
- An option to use tick volume rather than real volume for the volume source
- An option to use cumulative data, which sums the movements of the oscillator from the beginning to the end of TradingView's maximum window to give a more broad picture of market sentiment
Next, two trailing levels are calculated using the average true range of the oscillator. The levels are then used to determine wave direction.
Lastly, rather than using 0 as the center line, it is instead calculated by taking a cumulative average of the oscillator.
Custom bar colors are included.
Note: For charts that have no real volume component, use tick volume as the volume source.
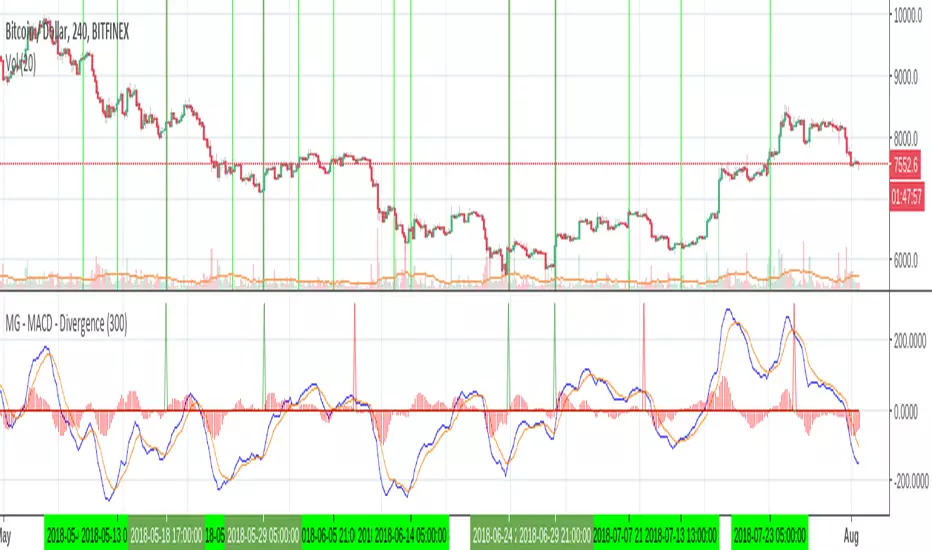
MG - MACD - Divergence - 1.0The MACD indicator can produce some powerful divergence signals which can be useful confirmation for entering / exiting a trade.
This indicator generates and alert and plots (if enabled), when a divergence is detected. For example, if bullish (above zero) and two bearish MACD crosses are detected with the second being lower than the first, a bearish divergence alert is triggered. Theoretically a good place to take profit / possibly enter a short position if you have further confirmation.
Can also be configured to include continuation signals i.e. a bullish trend with two bullish MACD crosses where the second is higher than the first. This could indicate more bullish action ahead.
In order to illustrate how this indicator helps to sift out a good amount of false signals, I have highlighted in the above image in dark green, all of the divergence buy signals highlighted by the indicator and in light green, the rest of the MACD buy signals.
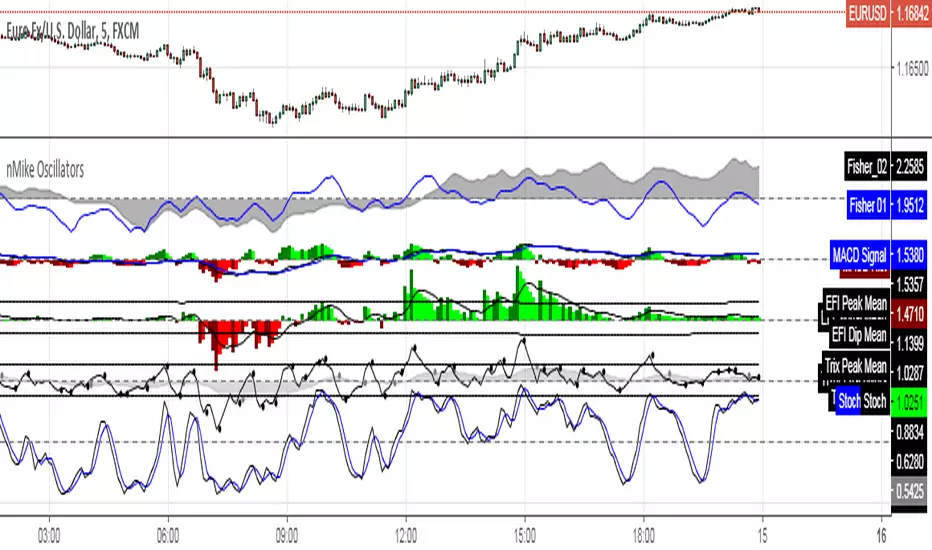
[RS]nMikes Divergence OscillatorsOscillator Package used for nMike's trading system.
Note: this is still in development, so use at your own discretion.
Relative Strength Index (Log/Divs/MTF/EMA)RSI calculated for log scale, with divergences labeled, as well as a 1 hour 55 EMA for signal.
Original log-space RSI by fskrypt.
Divergences taken from JustUncleL, originally from RicardoSantos.

Money Flow Index + AlertsThis study is based on the work of TV user Beasley Savage ( ) and all credit goes to them.
Changes I've made:
1. Added a visual symbol of an overbought/oversold threshold cross in the form of a red/green circle, respectively. Sometimes it can be hard to see when a cross actually occurs, and if your scaling isn't set up properly you can get misleading visuals. This way removes all doubt. Bear in mind they aren't meant as trading signals, so DO NOT use them as such. Research the MFI if you're unsure, but I use them as an early warning and that particular market/stock is added to my watchlist.
2. Added 60/40 lines as the MFI respects these incredibly well in trends. E.g. in a solid uptrend the MFI won't go below 40, and vice versa. Use the idea of support and resistance levels on the indicator and it'll be a great help. I've coloured the zones. Strong uptrends should stay above 60, strong downtrends should stay below 40. The zone in between 40-60 I've called the transition zone. MFI often stays here in consolidation periods, and in the last leg of a cycle/trend the MFI will often drop into this zone after being above 60 or below 40. This is a great sign that you should get out and start looking to reverse your position. Hopefully it helps to spot divergences as well.
3. Added alerts based on an overbought/oversold cross. Also added an alert for when either condition is triggered, so hopefully that's useful for those struggling with low alert limits. Feel free to change the overbought/oversold levels, the alerts + crossover visual are set to adapt.
Like any indicator, don't use this one alone. It works best paired with indicators/techniques that contradict it. You'll often see a OB/OS cross, and price will continue on it's way for many weeks more. But MFI is a great tool for identifying upcoming trend changes.
Any queries please comment or PM me.
Cheers,
RJR

Consensio Trading SystemConsensio Trading System involves using 3 different moving average comprised of 2, 7 and 30-week simple moving average. The trading methodology is simple when all moving average are above one another and is converging up ..You're in a bull market and vise versa for a bear market when all the moving average below one another and is converging down. There are said to be more than 1000 (1k) combination for this system to begin trade with and all pattern require at least 3 moving average. This system is mainly used with the weekly chart for longterm perspective although it can be used up to 30 min for short-term trade setups. The main component of this system is longer-term moving average i.e.30 period if that is down and other MA are consolidating within a range aka death cross back and forth ... the overall market should be considered bear market regardless of other two moving average crossovers.
Hyperwave Channel by Lucid Investment Strategies
Co-hosted by D. Tyler Jenks and Leah Wald
D. Tyler Jenks, the President, and CIO of Lucid Investment Strategies LLC developed the proprietary technical system of Hyperwave. After 40 years as an investment manager, he discovered over 300 examples of Hyperwaves within various asset classes; stocks, bonds, commodities , indexes, and cryptocurrencies

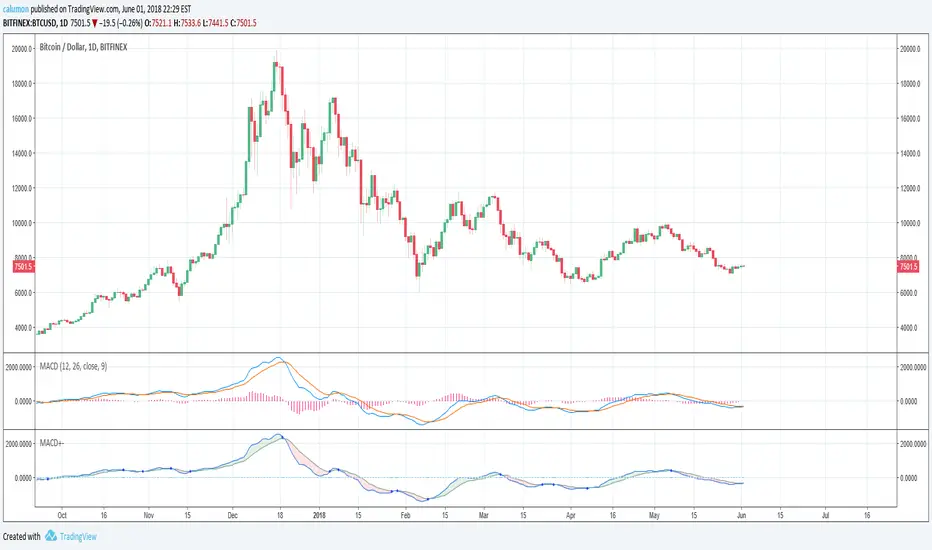
MACD with highlighted positive and negative trendThe values used by this indicator are equal to MACD 12 26 9 (and Signal). Only changes are made to looks:
If MACD closes higher than Signal, then we are seeing green. Else, we are seeing red.
Another point is that we get a blue circle when there is a trend change from bullish to bearish or vice versa. Please note that there needs to be an offset for this. We will only see the circle, when there already WAS (instead of is) a trend change.
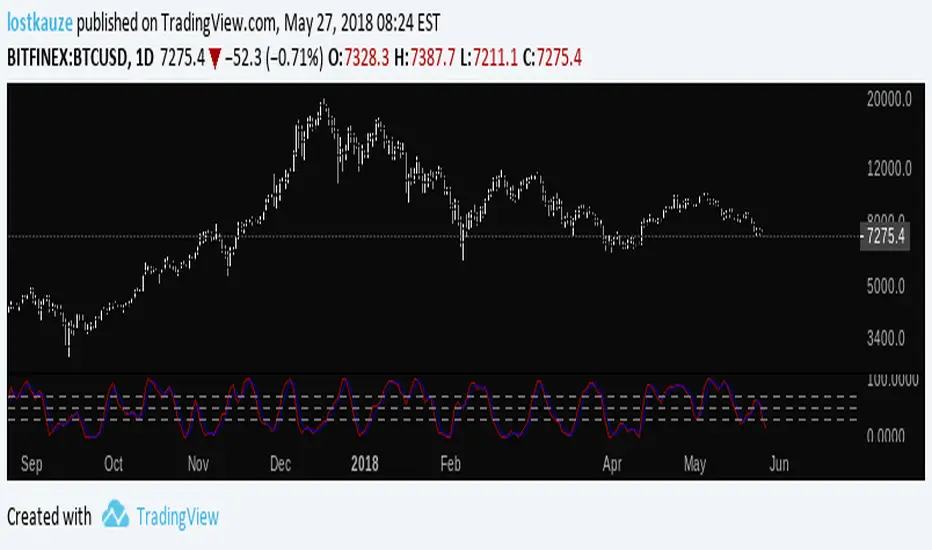
Stoch BitfinexSimilar to RSI Bitfinex , but Stoch version.
It applies Stochastic Oscillator to BTC longs/shorts ratio on Bitfinex. You can use the oscillator as you'd use Stoch:
- Divergences
- Oversold/overbought signals
- R/S on the indicator
- Trend indication
- etc

Stochastic On Balance Volume(not sure why the text in the image above is messed up; it looked good before publishing. The oscillators above are (from top to bottom) StochOBV, OBVOSC (LazyBear), OBV)
Applies the Stochastic Oscillator to OBV the same way StochRSI applies the Stochastic Oscillator to RSI.
Features:
- Bounded between 0 and 100, so it may be used for overbought/oversold alerts;
- Uses two lines for crossing signals similar to Stoch and StochRSI;
- Only considers recent OBV action, similar to how StochRSI only considers recent RSI action;
It can be used for simple signals, divergence, trend lines, and any other method you'd use StochRSI for.
The OBV calculation is from LazyBear's OBVOSC script here , so thank you for your script.

MACD percentage price oscillatorMACD Percentage Price Oscillator is a variation of the MACD indicator. Signal line crossovers are almost identical. The major difference is the MACD Percentage scale which enables comparison between stocks at different prices.
MACD Percentage Price Oscillator's trading signals are the same as for the MACD indicator. The MACD indicator is primarily used to trade trends and should not be used in a ranging market. Signals are taken when MACD crosses its signal line, calculated as a 9 day exponential moving average of MACD.
First check whether price is trending. If the MACD indicator is flat or stays close to the zero line, the market is ranging and signals are unreliable.
Signals are far stronger if there is either:
- a divergence on the MACD indicator; or
- a large swing above or below the zero line.
- Unless there is a divergence, do not go long if the signal is above the zero line, nor go short if the signal is below zero. Place stop-losses below the last minor Low when long, or the last minor High when short.
The main advantage of MACD Percentage over MACD is the ability to compare indicator values across stocks.
The only difference with MACD Percentage Price Oscillator is that the difference between the fast and slow moving averages is calculated as a percentage of the slow moving average: MACD = (12 Day EMA - 26 Day EMA) / 26 Day EMA

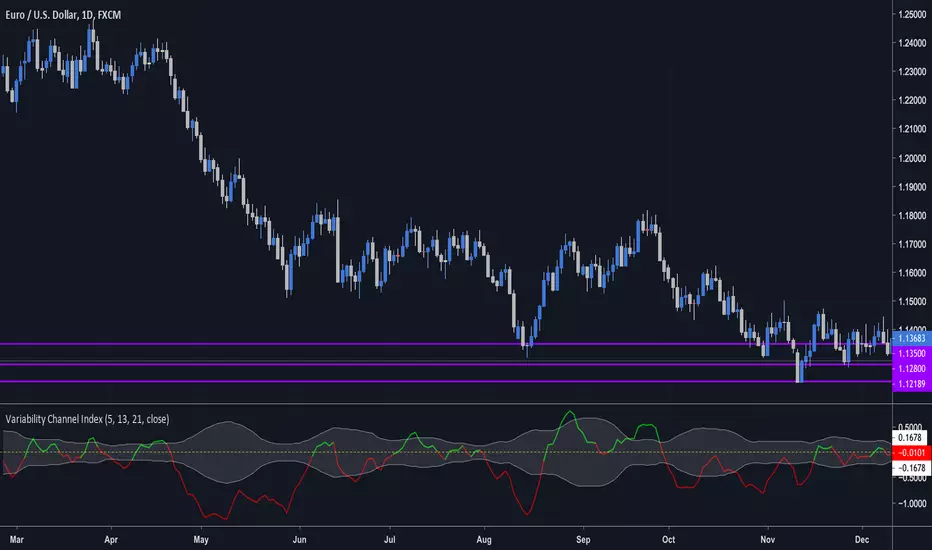
Variability Channel Index (by vitelot)This is a momentum, trend, as well as a divergence indicator.
It is similar to CCI, though it is based on a slow and fast EMA in connection to ATR, which
allows to interprete it easily.
Both EMAs and ATR have customisable period.
Further explanation and basic usage can be found in the comment section inside the script.
Awesome Oscillator and MACD HistogramThis is a quick script that combines two standard indicators, the Awesome Oscillator and MACD histogram, to highlight the beginnings of periods of fast price movement (divergence between the two). Since MACD's EMA responds more quickly than AO's SMA, look for periods of green over gold as a bullish signal, and red under blue as a bearish signal.
Of course both indicators are lagging in nature, but the presence of this divergence often leads larger, continued movement in the same direction.
Bullish Signals
Change from red to green below 0 with either blue or gold above 0 (strengthened on second green bar):
Rising green above 0 with gold below 0:
Bearish Signals
Change from green to red above 0 with either blue or gold below 0 (strengthened on second red bar):
Deepening red below 0 with blue above 0:

CMYK RMI◊ Introduction
I started using this script because of its fast reaction, and good tell for buy/sell moments on a short timescale.
For larger timescales, the overall trend should be taken into account regarding the levels.
In the future i will update this indicator, to automatically adjust those.
◊ Origin
The Relative Momentum Index was developed by Roger Altman and was introduced in his article in the February, 1993 issue of Technical Analysis of Stocks & Commodities magazine.
While RSI counts up and down days from close to close, the Relative Momentum Index counts up and down days from the close relative to a close x number of days ago.
This results in an RSI that is smoother.
◊ Adjustments
CMYK color theme applied.
Four levels to indicate intensity.
Two Timescales, to overview the broader trend, and fast movements.
◊ Usage
RMI indicates overbought and oversold zones, and can be used for divergence and trend analysis.
◊ Future Prospects
Self adjusting levels, relative to an SMA trend.
Alternative RMI, which functions as an overlay.
◊ ◊ ◊ ◊ ◊ ◊ ◊ ◊ ◊ ◊ ◊ ◊ ◊ ◊ ◊ ◊ ◊ ◊ ◊ ◊ ◊ ◊ ◊ ◊ ◊ ◊ ◊ ◊ ◊ ◊ ◊ ◊ ◊ ◊ ◊ ◊ ◊ ◊ ◊ ◊ ◊ ◊ ◊ ◊ ◊ ◊ ◊ ◊ ◊ ◊ ◊ ◊ ◊ ◊ ◊ ◊ ◊ ◊ ◊ ◊ ◊ ◊ ◊ ◊ ◊ ◊ ◊ ◊ ◊ ◊ ◊ ◊ ◊ ◊ ◊ ◊ ◊ ◊ ◊ ◊ ◊ ◊ ◊ ◊ ◊ ◊ ◊ ◊ ◊ ◊ ◊ ◊ ◊ ◊ ◊ ◊ ◊ ◊ ◊ ◊ ◊ ◊ ◊ ◊ ◊ ◊

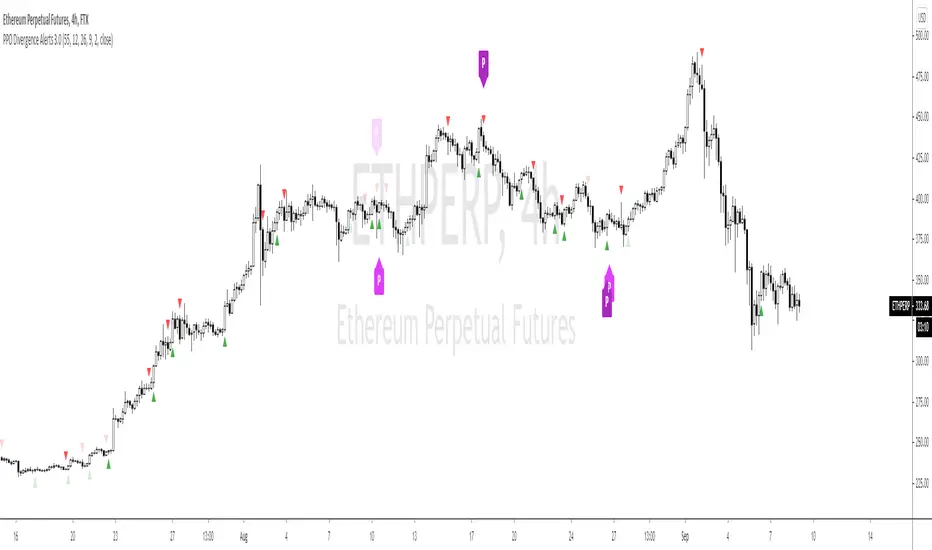
PPO Divergence Alerts 2.0This is basically the same code as my other PPO Divergence indicator expect it overlays the signal on the candles, rather than needing the oscillator. I'm keeping the old version, as I'm sure people will prefer it, but this version takes up less screen real estate.
EMA Spread OscillatorEMA Spread Oscillator
Quickly see past levels where diff maxed out. Momentum and price can only keep going up for so long. This obviously differs per underlying asset. So that is where this oscillator comes in handy.
Of course you can see on the chart how far apart the moving averages are, but it is easier to spot on an oscillator.
Volume Weighted Average Divergence [DW]This is an experimental study inspired by the volume weighted moving average convergence divergence (VWMACD) concept.
In this formula, divergences between two volume weighted moving averages and two simple moving averages over their respective lookback periods are calculated.
The difference between the divergences is calculated, then the difference between the result and an exponential moving average of the result are calculated to provide a histogram.
Finally, the mean value between the two divergences is calculated to provide the VWAD line.
Custom bar colors are also included.

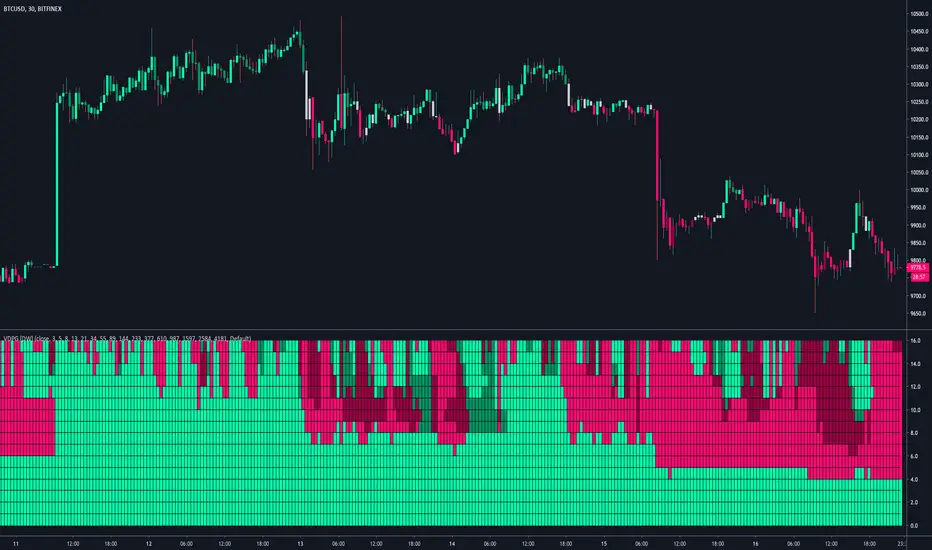
Volume Divergence Polarity Grid [DW]This study is an experiment built off the framework of my Dual Volume Divergence Index indicator.
It is designed to gauge polarity over multiple lookback periods of your choice by expressing the data as a two color grid.
Positive Volume Divergence and Negative Volume Divergence are calculated, and their relative values are used to gauge polarity.
The order of the grid is top to bottom - the top is the first lookback period, and the bottom is the last.
MTF Polarity Grid [DW]This is an experimental study designed to track directional polarities across multiple timeframes and express them as a simple two color grid.
The polarity in this calculation is determined by divergence between a fast and slow McGinley Dynamic.
Your current resolution's polarity is the top row, the rows below are are for higher timeframes of your choice.

KAMA Divergence [DW]This study is a simple experiment that expresses divergences between price and Kaufman's Adaptive Moving Average as a percentage. The result is then smoothed using KAMA to provide a signal line.
