Dynamic RSI Regression Bands (Zeiierman)█ Overview
The Dynamic RSI Regression Bands (Zeiierman) is a regression channel tool that dynamically resets based on RSI overbought and oversold conditions. It adapts to trend shifts in real time, creating a highly responsive regression framework that visualizes market sentiment and directional momentum with every RSI-triggered event.
Unlike static regression models, this indicator recalibrates its slope and deviation bands only after the RSI crosses predefined thresholds, helping traders pinpoint new phases of momentum, exhaustion, or reversal.
You’re not just measuring the trend — you’re tracking when and where the trend deserves to be re-evaluated.
█ The Assumption:
"A major momentum shift (RSI crossing OB/OS) signals a potential regime change, and thus, the trend model should be recalibrated from that point."
Instead of using a fixed-length regression (which assumes trend relevance over a static window), this script resets the regression calculation every time RSI crosses into extreme territory. The underlying idea is that extreme RSI levels often represent emotional peaks in market behavior and are statistically likely to be followed by a new price structure.
█ How It Works
⚪ RSI-Based Channel Reset
RSI is monitored continuously
If RSI crosses above the Overbought level, the indicator resets and starts a new regression channel
If RSI crosses below the Oversold level, the same reset logic applies
These events act as “anchor points” for dynamic trend analysis
⚪ Regression Channel Logic
A custom linear regression is calculated from the RSI reset point forward
The lookback grows with each bar after the reset, up to a user-defined max
Regression lines are drawn from the reset point to the current bar
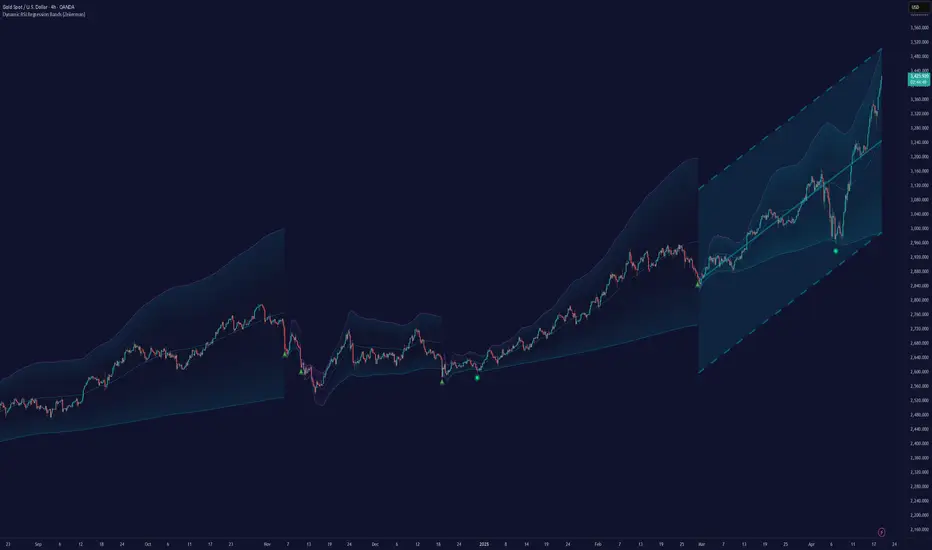
⚪ Standard Deviation Bands
Upper and lower bands are plotted around the regression line using the standard deviation
These serve as dynamic volatility envelopes, great for spotting breakouts or reversals
⚪ Rejection Markers
If price hits the upper/lower band and then closes back inside it, a rejection marker is plotted
Helps visualize failed breakouts and areas of absorption or reversal pressure
█ How to Use
⚪ Detect Trend Shifts
Use the RSI resets to identify when the trend might be starting fresh.
⚪ Watch the Bands for Volatility Extremes
Use the outer bands as soft areas of potential reversal or momentum breakout.
⚪ Spot Rejections for Potential Entry Signals
If price moves outside a band but then quickly returns inside, it often means the breakout failed, and price may reverse.
█ Settings Explained
RSI Length – How many bars RSI uses. Shorter = faster.
OB / OS Levels – Crossing these triggers a regression reset.
Base Regression Length – Max number of bars regression can use post-reset.
StdDev Multiplier – Controls band width from the regression line.
Min Bars After Reset – Ensures channel doesn’t form immediately; waits for structure.
Show Reset Markers – Triangles mark where RSI crossed OB/OS.
Show Rejection Markers – Circles mark where the price rejected the channel edge.
-----------------
Disclaimer
The content provided in my scripts, indicators, ideas, algorithms, and systems is for educational and informational purposes only. It does not constitute financial advice, investment recommendations, or a solicitation to buy or sell any financial instruments. I will not accept liability for any loss or damage, including without limitation any loss of profit, which may arise directly or indirectly from the use of or reliance on such information.
All investments involve risk, and the past performance of a security, industry, sector, market, financial product, trading strategy, backtest, or individual's trading does not guarantee future results or returns. Investors are fully responsible for any investment decisions they make. Such decisions should be based solely on an evaluation of their financial circumstances, investment objectives, risk tolerance, and liquidity needs.
Dynamicrsi
ATR Adjusted RSIATR Adjusted RSI Indicator
By Nathan Farmer
The ATR Adjusted RSI Indicator is a versatile indicator designed primarily for trend-following strategies, while also offering configurations for overbought/oversold (OB/OS) signals, making it suitable for mean-reversion setups. This tool combines the classic Relative Strength Index (RSI) with a unique Average True Range (ATR)-based smoothing mechanism, allowing traders to adjust their RSI signals according to market volatility for more reliable entries and exits.
Key Features:
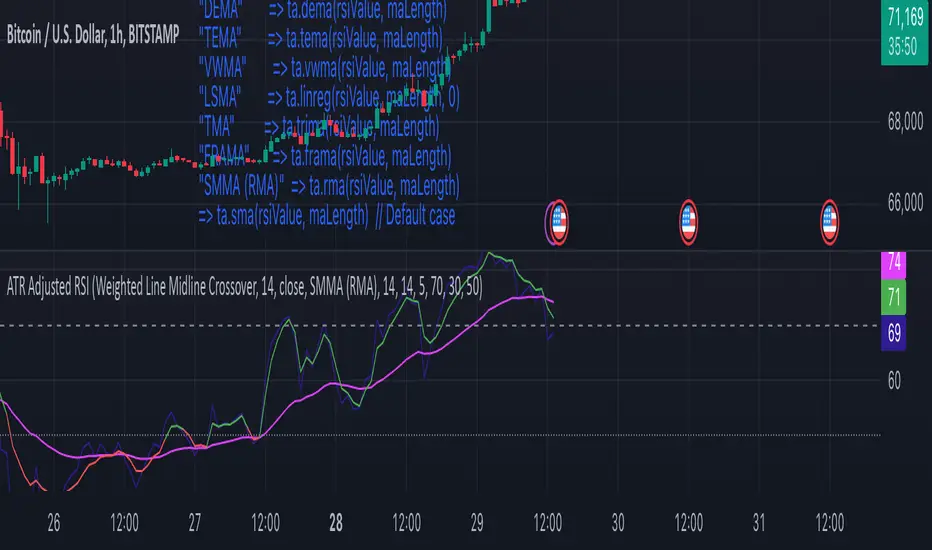
ATR Weighted RSI:
At the core of this indicator is the ATR-adjusted RSI line, where the RSI is smoothed based on volatility (measured by the ATR). When volatility increases, the smoothing effect intensifies, resulting in a more stable and reliable RSI reading. This makes the indicator more responsive to market conditions, which is especially useful in trend-following systems.
Multiple Signal Types:
This indicator offers a variety of signal-generation methods, adaptable to different market environments and trading preferences:
RSI MA Crossovers: Generates signals when the RSI crosses above or below its moving average, with the flexibility to choose between different moving average types (SMA, EMA, WMA, etc.).
Midline Crossovers: Provides trend confirmation when either the RSI or its moving average crosses the 50 midline, signaling potential trend reversals.
ATR-Inversely Weighted RSI Variations: Uses the smoothed, ATR-adjusted RSI for a more refined and responsive trend-following signal. There are variations both for the MA crossover and the midline crossover.
Overbought/Oversold Conditions: Ideal for mean reversion setups, where signals are triggered when the RSI or its moving average crosses over overbought or oversold levels.
Flexible Customization:
With a wide range of customizable options, you can tailor the indicator to fit your personal trading style. Choose from various moving average types for the RSI, modify the ATR smoothing length, and adjust overbought/oversold levels to optimize your signals.
Usage:
While this indicator is primarily designed for trend-following, its OB/OS configurations make it highly effective for mean-reverting setups as well. Depending on your selected signal type, the relevant indicator line will change color between green and red to visually signal long or short opportunities. This flexibility allows traders to switch between trending and sideways market strategies seamlessly.
A Versatile Tool:
The ATR Adjusted RSI Indicator is a valuable component of any trading system, offering enhanced signals that adapt to market volatility. However, it is not recommended to rely on this indicator alone, especially without thorough backtesting. Its performance varies across different assets and timeframes, so it’s essential to experiment with the parameters to ensure consistent results before applying it in live trading.
Recommendation:
Before incorporating this indicator into live trading, backtest it extensively. Given its flexibility and wide range of signal-generation methods, backtesting allows you to optimize the settings for your preferred assets and timeframes. Only consider using it on it's own if you are confident in its performance based on your own backtest results, and even then, it is not recommended.
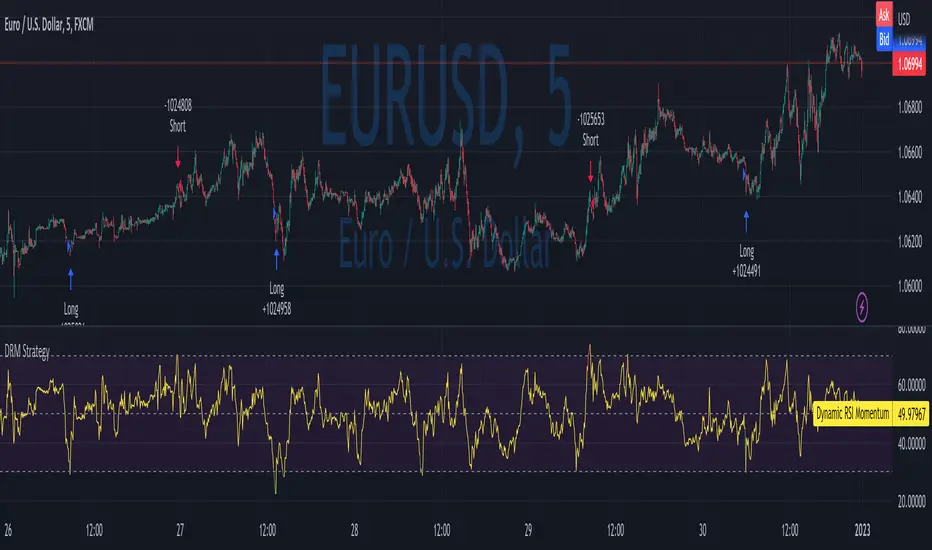
DRM StrategyOne of the ways I go when I develop strategies is by reducing the number of parameters and removing fixed parameters and levels.
In this strategy, I'm trying to create an RSI indicator with a dynamic length.
Length is computed based on the correlation between Price and its momentum.
You can set min and max values for the RSI, and if the correlation is close to 1, we'll be at a min RSI value. When it's -1, we'll be at the max level.
I got this idea from Sofien Kaabar's book.
The strategy is super simple, and there might be much room for improvement.
Performance on the deep backtesting is not excellent, so I think the strategy needs some filters for regimes, etc.
Thanks to @MUQWISHI for helping me code it.
Disclaimer
Please remember that past performance may not indicate future results.
Due to various factors, including changing market conditions, the strategy may no longer perform as well as in historical backtesting.
This post and the script don’t provide any financial advice.