Robust Cycle Measurement [Ehlers]The last of Ehlers Instantaneous Frequency Measurement methods.
This is a more robust version of this script.
I wrote it as a function, so you can simply copy and paste it into any script to add an adaptive period setting capability.
Cheers,
DasanC
Ehlers
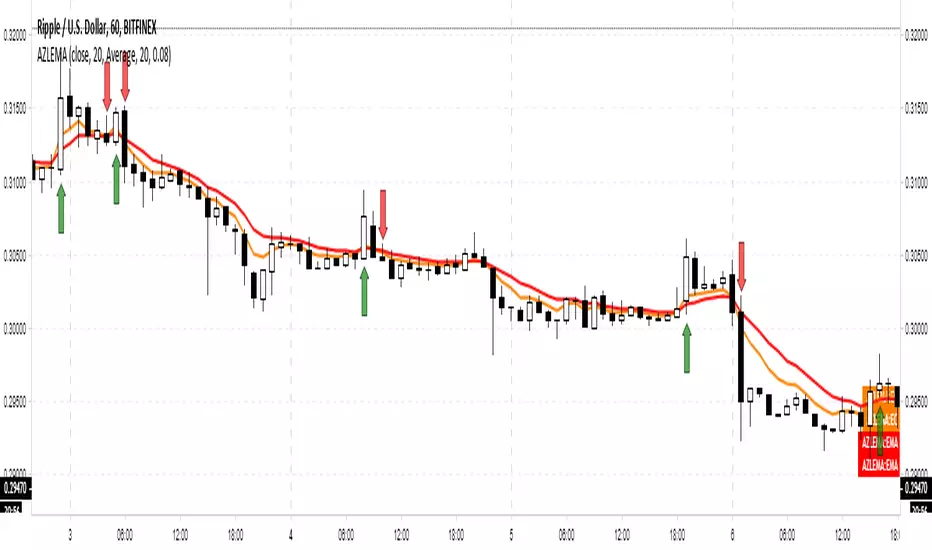
Adaptive Zero Lag EMA [STUDY]A user has asked for the Study/Indicator version of this Strategy .
If you encounter the error "loop....>100ms" simply toggle the eye icon to hide and unhide the indicator
The following is simply quoted from my previous post for your convenience: (obviously there won't be risk, Stop Loss, or Take profit parameters!)
OPERATING PRINCIPLE
The strategy is based on Ehlers idea that any indicator can be turned into a signal-producing trade system through smoothing and other filtering processes.
In fact, I'm using his Zero Lag EMA ( ZLEMA ) as a baseline indicator as well as some code snippets he has made public (1). God bless open source!
Next, I've provided the option to use an Instantaneous Frequency Measurement (IFM) method, which will adaptively choose the best period for the ZLEMA (2)
I've written other studies that use the differential calculus approximations for IFM, so it was only natural to include them in this strategy.
The primary two are Cosine IFM (3) and In-phase Quadrature IFM (4). You can also find an indicator with both plotted and the ability to average them together, as one IFM prefers long periods and the other short. (5)
BEFORE WE BEGIN
1. This strategy only runs on "normal" FX pairs ( EURUSD , GBPJPY , AUDUSD ...) and will fail on Metals or Commodities.
Cryptos are largely untested.
2. Please run it on these time frames: M15 to D.
Anything outside this range will likely fail.
HOW TO USE AND SUCCEED
1. If the Default settings don't produce good results right off the bat, then lower gain limit to 1 or 2 and threshold to 0.01.
2. Test each setting under adaptive method. If you want to leave it Off, then I'd recommend using some kind of IFM (see my links below) to
discover the most efficient period to use.
3. Once you have the best adaptive method chosen, begin incrementing gain limit until you find a nice balance between profit factor ( PF ) and drawdown.
4. Now, begin incrementing threshold. The goal is to have PF above 2 and a drawdown as low as possible.
5. Finally, change the source! Typically, close is the best option, but I have run into cases where high
yielded the highest returns and win rate.
6. Sit back, relax, and tweak the risk until you're happy with the return and drawdown amounts.
ADVANCED
You may need to adjust take profit (TP) points and stop loss (SL) points to create the best entry possible. Don't be greedy! You'll likely have poor
results if the TP is set to 300 and SL is 50.
If you are trading a pair that has a long Dominant Cycle Period, then you may increase Max Period to allow the IFM
to accept longer periods. Any period above the Max Period will be rejected. This may increase lag time!
Cheers and good luck trading!
-DasanC
(1)www.mesasoftware.com
(2)www.jamesgoulding.com
(3) Cosine IFM
(4) I-Q IFM
(5) Averaging IFM
IFM stands for Instantaneous frequency measurement
Adaptive Zero Lag EMA v2This is my most successful strategy to date! Please enjoy and join the Open Source movement by sharing your code and ideas online!
OPERATING PRINCIPLE
The strategy is based on Ehlers idea that any indicator can be turned into a signal-producing trade system through smoothing and other filtering processes.
In fact, I'm using his Zero Lag EMA (ZLEMA) as a baseline indicator as well as some code snippets he has made public (1). God bless open source!
Next, I've provided the option to use an Instantaneous Frequency Measurement (IFM) method, which will adaptively choose the best period for the ZLEMA (2)
I've written other studies that use the differential calculus approximations for IFM, so it was only natural to include them in this strategy.
The primary two are Cosine IFM (3) and In-phase Quadrature IFM (4). You can also find an indicator with both plotted and the ability to average them together, as one IFM prefers long periods and the other short. (5)
BEFORE WE BEGIN
1. This strategy only runs on "normal" FX pairs (EURUSD, GBPJPY, AUDUSD ...) and will fail on Metals or Commodities.
Cryptos are largely untested.
2. Please run it on these time frames: M15 to D.
Anything outside this range will likely fail.
HOW TO USE AND SUCCEED
1. If the Default settings don't produce good results right off the bat, then lower gain limit to 1 or 2 and threshold to 0.01.
2. Test each setting under adaptive method . If you want to leave it Off , then I'd recommend using some kind of IFM (see my links below) to
discover the most efficient period to use.
3. Once you have the best adaptive method chosen, begin incrementing gain limit until you find a nice balance between profit factor (PF) and drawdown.
4. Now, begin incrementing threshold . The goal is to have PF above 2 and a drawdown as low as possible.
5. Finally, change the source ! Typically, close is the best option, but I have run into cases where high
yielded the highest returns and win rate.
6. Sit back, relax, and tweak the risk until you're happy with the return and drawdown amounts.
ADVANCED
You may need to adjust take profit (TP) points and stop loss (SL) points to create the best entry possible. Don't be greedy! You'll likely have poor
results if the TP is set to 300 and SL is 50.
If you are trading a pair that has a long Dominant Cycle Period , then you may increase Max Period to allow the IFM
to accept longer periods. Any period above the Max Period will be rejected. This may increase lag time!
Cheers and good luck trading!
-DasanC
PS - This code doesn't repaint or have future-leak, which was present in Pinescript v2.
PPS - Believe me! These returns are typical! Sometimes you must push aside the "if it's too good to be true..." mindset that society has ingrained in you.
Do you really believe the most successful pass up opportunities before investigating them? ;)
(1) Ehlers & Ric Zero Lag EMA
(2) Measuring Cycles by Ehlers
(3) Cosine IFM
(4) Inphase Quadrature IFM
(5) Averaging IFM

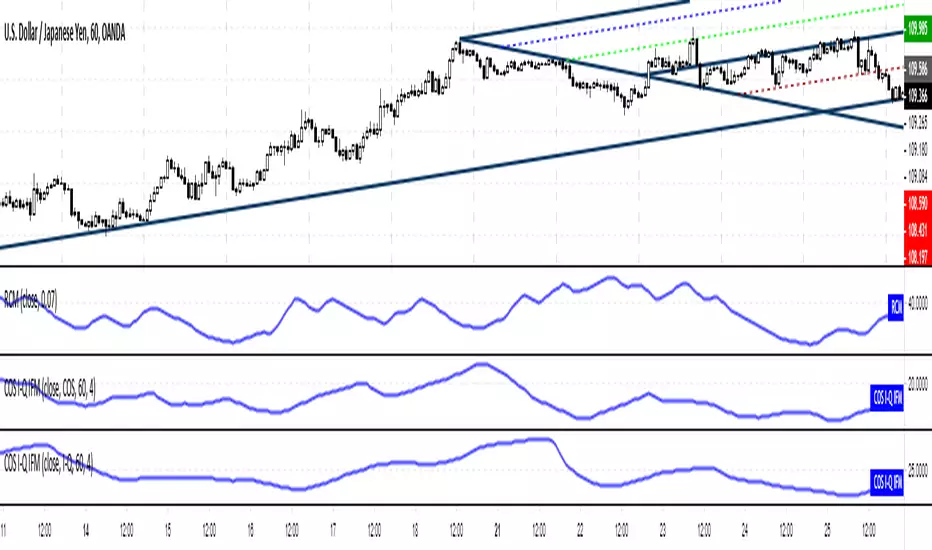
Cosine, In-Phase & Quadrature IFM [Ehlers]Yet another method for determining the cycle of a market: this time, you have access to the two fastest and most accurate methods
as well as the option to average these methods together.
The controls are pretty straight forward:
Source lets you select the price data to perform calculations on (close, open, etc..)
Max Period is simply the cap for the algorithm when it's checking the validity of Periods.
-> If you notice your plots have a flat top, then increase this value to accept a wider range of Periods.
-> This setting has a min. value of 8 to reduce noise and a max of 100 to ignore waves from higher time frames.
Average? simply averages the two methods of calculation.
-> You may want to do this if you notice the two plots diverging a lot.
-> Cosine IFM tends to favor shorter periods; I-Q IFM tends to favor longer.
Cheers,
- DasanC

Adaptive Bandpass Filter [Ehlers]This is my latest bandpass filter - used to determine if a security is in a trend or cycle.
Now with an adaptive period setting! I use Ehlers in-phase & quadrature dominant cycle measurement (IQ IFM) method to set the period dynamically.
This method favors longer periods which tend to produce smoother, albeit laggier bandpass oscillator plots. From my quick tests, I tend to have lag between 4 and 8 bars, depending on the Timeframe.
The lower timeframes tend to have more noise and thus produce more interfering frequencies that may cause lag.
>Settings
Source: Select the data source to perform calc's on (close, open, etc...)
Period: Select the period to tune. Periods outside of this value will be attenuated (reduced)
Adaptive: Enable to have the I-Q IFM set the period for you (disables Period setting)
Bandpass Tolerance: Allow periods that are plus/minus the chosen period to pass.
Cycle Tolerance: Sensitivity of cycle mode. Lower values consider trends more frequent, higher values consider cycles more frequent.
Bandpass tolerance example: for instance, if this setting is 0.1 (10%) and Period is set to 20, then waves with a period of 18 - 22 will pass.
>How to read
Red line is the bandpass output, showing a lagged version of the dominant cycle representing the
Black lines are the upper and lower bounds for a cycle
Green Background indicates an uptrend
Red background indicates a downtrend

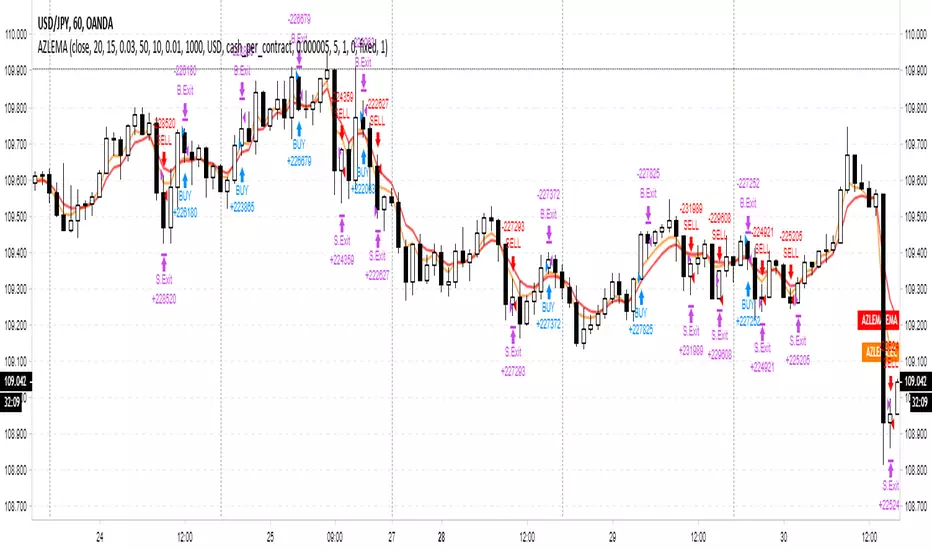
Adaptive Zero Lag EMA Strategy [Ehlers + Ric]Behold! A strategy that makes use of Ehlers research into the field of signal processing and wins so consistently, on multiple time frames AND on multiple currency pairs.
The Adaptive Zero Lag EMA (AZLEMA) is based on an informative report by Ehlers and Ric .
I've modified it by using Cosine IFM, a method by Ehlers on determining the dominant cycle period without using fast-Fourier transforms
Instead, we use some basic differential equations that are simplified to approximate the cycle period over a 100 bar sample size.
The settings for this strategy allow you to scalp or swing trade! High versatility!
Since this strategy is frequency based, you can run it on any timeframe (M1 is untested) and even have the option of using adaptive settings for a best-fit.
>Settings
Source : Choose the value for calculations (close, open, high + low / 2, etc...)
Period : Choose the dominant cycle for the ZLEMA (typically under 100)
Adaptive? : Allow the strategy to continuously update the Period for you (disables Period setting)
Gain Limit : Higher = faster response. Lower = smoother response. See for more information.
Threshold : Provides a bit more control over entering a trade. Lower = less selective. Higher = More selective. (range from 0 to 1)
SL Points : Stop Poss level in points (10 points = 1 pip)
TP Points : Take Profit level in points
Risk : Percent of current balance to risk on each trade (0.01 = 1%)
www.mesasoftware.com
www.jamesgoulding.com(Measuring%20Cycles).doc
In-Phase & Quadrature IFMThis indicator provides a continuous measurement of a securities' dominant cycle period, based on Ehlers ever-impressive reports and analysis tools.
This method uses in-phase and quadrature analysis, making use of the imaginary domain. This method is prone to favor longer periods and can
allow noise to greatly affect the end result.
>What does that even mean?
Essentially, you get a real-time (low lag) plot of the cycle period in bars. If the I-Q IFM reads "16" then you can expect the distance between swing highs and swing lows to be approx. 16 bars.
>How is this useful?
When you throw an RSI or MACD on your chart, you can now set the "Period" or "Length" value with confidence.
Knowing the dominant cycle period tells you that price reversal will occur around these intervals.
>Extending.
The better way to use this tool is by extending the script into any indicators that use a length or period that is set manually.
Simply use the "len" variable in your custom script to replace your input values.
Now you have a way to adaptively set the period value, using signal processing theory instead of just intuition ;)
PM if you have questions.

Cosine IFM [Ehlers]This indicator provides a continuous measurement of a securities' dominant cycle period, based on Ehlers ever-impressive reports and analysis tools.
>What does that even mean?
Essentially, you get a real-time (low lag) plot of the cycle period in bars. If the COS IFM reads "16" then you can expect the distance between swing highs and swing lows to be approx. 16 bars.
>How is this useful?
When you throw an RSI or MACD on your chart, you can now set the "Period" or "Length" value with confidence.
Knowing the dominant cycle period tells you that price reversal will occur around these intervals.
>Extending.
The better way to use this tool is by extending the script into any indicators that use a length or period that is set manually.
Simply use the "len" variable in your custom script to replace your input values.
Now you have a way to adaptively set the period value, using signal processing theory instead of just intuition ;)
PM if you have questions.

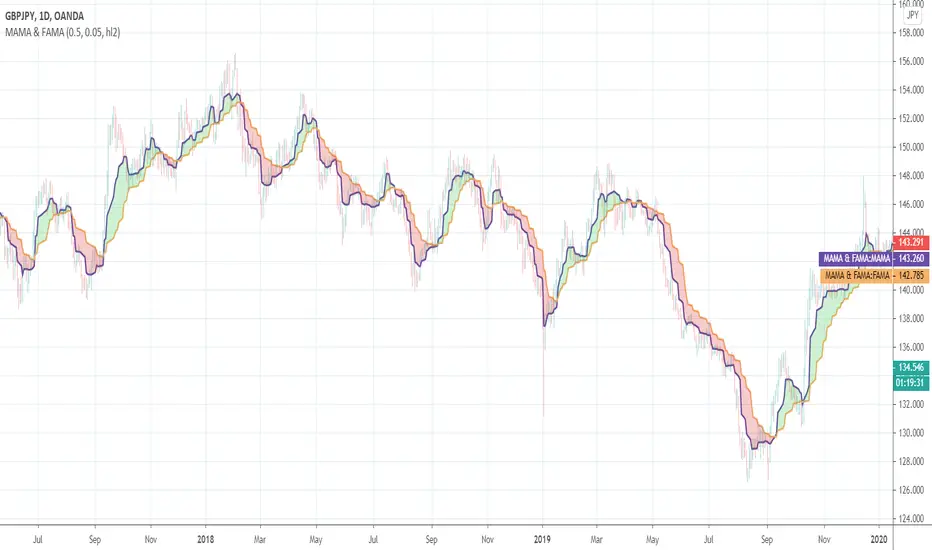
MAMA by EHLERSMESA Adaptive Moving Average aka: Mother of Adaptive Moving Averages:
The MESA Adaptive Moving Average ( MAMA ) adapts to price movement in an
entirely new and unique way. The adapation is based on the rate change of phase as
measured by the Hilbert Transform Discriminator I have previously described.1
The advantage of this method of adaptation is that it features a fast attack average and a
slow decay average so that composite average rapidly ratchets behind price changes
and holds the average value until the next ratchet occurs. The action of MAMA is
shown in Figure 1. Since the average fallback is slow I can build trading systems that
are virtually free of whipsaw trades.
For detailed information of MAMA: (creators' PDF document)
www.mesasoftware.com
Long condition: when MAMA Crosses over FAMA (Following Adaptive Moving Average )
Short condition: when FAMA Crosses over MAMA
(Personally modified LazyBear's version which was originally calculated in degrees instead of radian by applying explanations in the MESA pdf document.http://www.mesasoftware.com/papers/MAMA.pdf)
Creator: John EHLERS

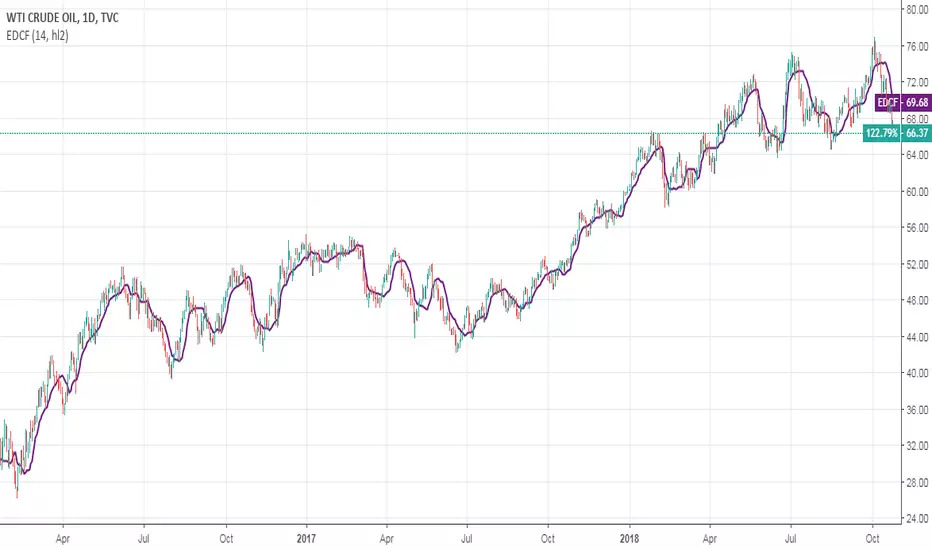
Ehlers Distance Coefficient FilterThis indicator was described by John F. Ehlers in his book "Rocket Science for Traders" (2001, Chapter 18: Ehlers Filters).
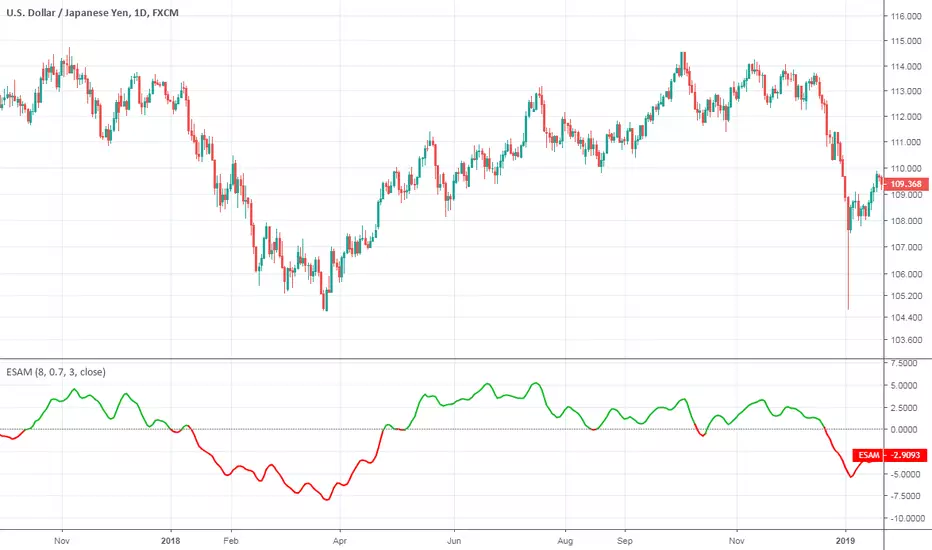
Ehlers Smoothed Adaptive MomentumEhlers Smoothed Adaptive Momentum script.
This indicator was developed and described by John F. Ehlers in his book "Cybernetic Analysis for Stocks and Futures" (2004, Chapter 12: Adapting to the Trend).
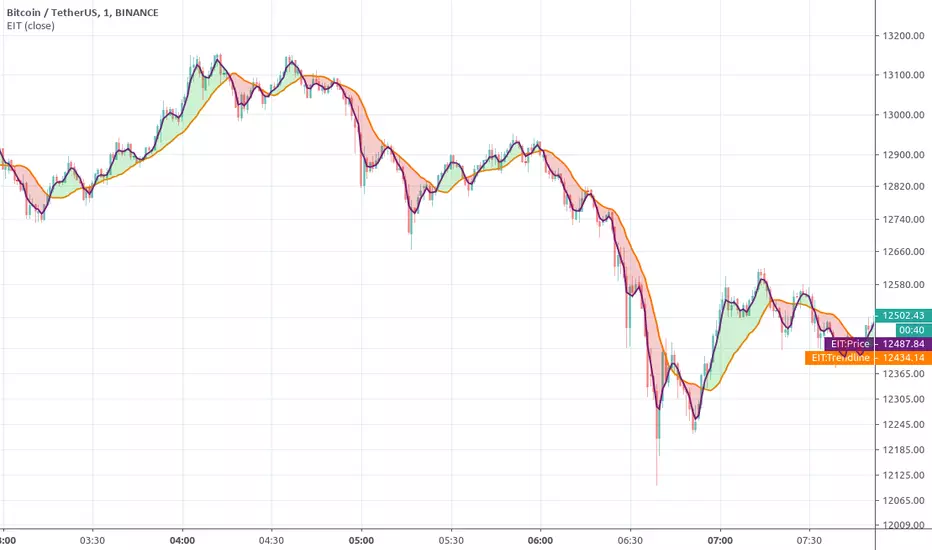
Ehlers Instantaneous TrendlineEhlers Instantaneous Trendline script.
This indicator was described by John F. Ehlers in his book "Rocket Science for Traders" (2001, Chapter 10: The Instantaneous Trendline).
Butterworth FilterButterworth Filter script.
This indicator was described by John F. Ehlers in his book "Rocket Science for Traders" (2001, Chapter 15: Infinite Impulse Response Filters).

Gaussian FilterGaussian Filter script.
This indicator was described by John F. Ehlers in his book "Rocket Science for Traders" (2001, Chapter 15: Infinite Impulse Response Filters).

Missile RSI (RSI of momentum w/ Dominant Cycle length + Fisher)This is a predictive indicator that looks for explosions in momentum of the cycles in price and large shifts in Momentum (Fisher turns the Bimodal PDF into Guassian like) as statistically unlikely events, showing points to exit or reverse positions.
You can adjust the lowpass frequency cuttoff (Aka what cycles you want to remove from the calculations through the super smoother filter).
To be honest you can monkey trade the direction of the Signal if you'd like but the Divergences and Maxing of the values is whats most useful.
Let me know if you guys want me to add anything else.

Ehlers FilterThis is the Adaptive Ehlers Filter.
I had to unroll the for loops and array because TV is missing crucial data structures and data conversions (Arrays and series to integer conversion for values).
I'm in the process of releasing some scripts. This is a very old script I had. This contains volatility ranges and can be used as trading signals. You can also see how the EF moves up or down, the direction, when price is sideways, and use price breaks up and down as signals from the line.
Have fun, because I didn't making this script hahaha
NOTE : There is an issue with the script where at certain time frames it positions itself below or above. I think its due to calculations. If anyone knows the fix before I get the chance to take a look at it, please let me know.
books.google.com

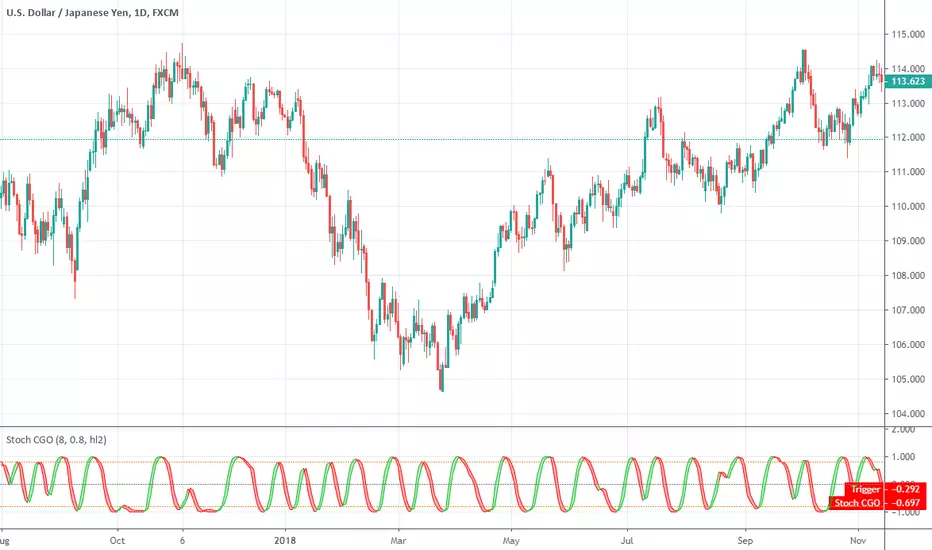
Stochastic CG Oscillator (Center of Gravity)Stochastic CG Oscillator (Center of Gravity) script.
This indicator was originally developed by John F. Ehlers (see his book `Cybernetic Analysis for Stocks and Futures`, Chapter 8: `Stochasticization and Fisherization of Indicators`).
Ehlers Reverse Exponential Moving AverageEhlers Reverse Exponential Moving Average script.
This indicator was originally developed by John F. Ehlers (Stocks & Commodities V. 35:10: The Reverse EMA Indicator).

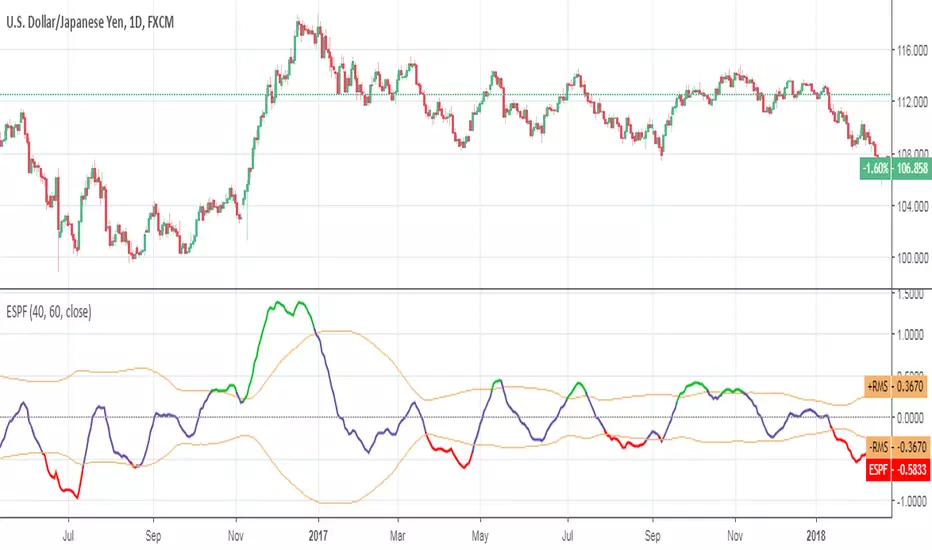
Ehlers Super Passband FilterEhlers Super Passband Filter script.
This indicator was originally developed by John F. Ehlers (Stocks & Commodities V. 34:8: The Super Passband Filter).
Ehlers MESA Adaptive Moving Averages (MAMA & FAMA)Ehlers MESA Adaptive Moving Averages (MAMA & FAMA) script.
These indicators was originally developed by John F. Ehlers (Stocks & Commodities V. 19:10: MESA Adaptive Moving Averages).
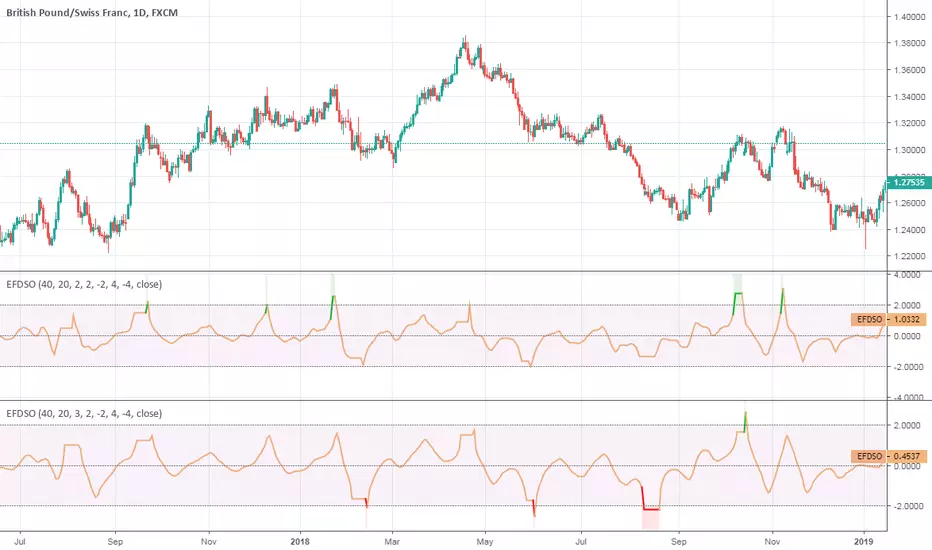
Ehlers Fisherized Deviation-Scaled OscillatorEhlers Fisherized Deviation-Scaled Oscillator script.
This indicator was originally developed by John F. Ehlers (Stocks & Commodities V. 36:11: Probability - Probably A Good Thing To Know).
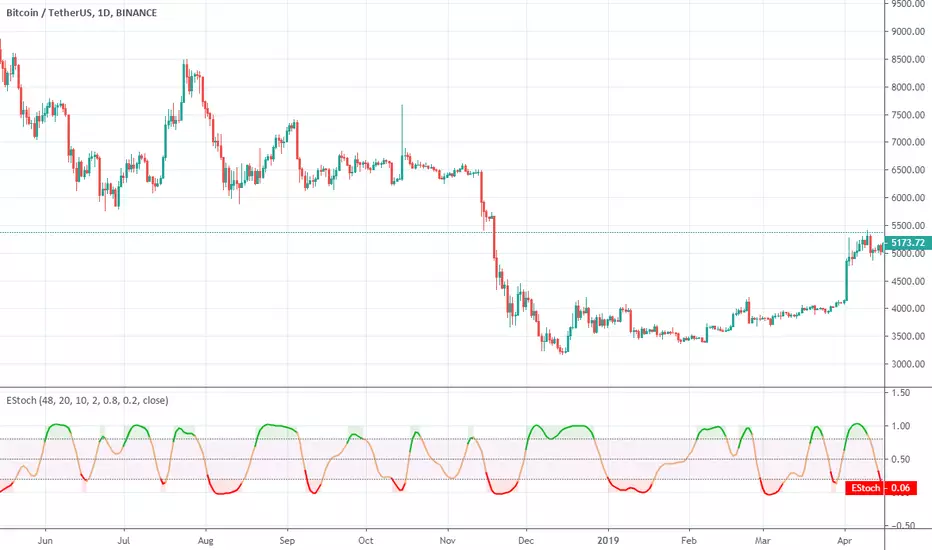
Ehlers StochasticEhlers Stochastic script.
This indicator was originally developed by John F. Ehlers (Stocks & Commodities V. 32:1: Predictive And Successful Indicators).
Ehlers Roofing FilterEhlers Roofing Filter script.
This indicator was originally developed by John F. Ehlers (Stocks & Commodities V. 32:1: Predictive And Successful Indicators).
