B-auto fibA new interactive input mode for price and time inputs is now available. Instead of selecting bar numers and/or time from input widgets, you can now select them by clicking on the chart.
The interactive mode is activated by using confirm = true in input.time() and input.price().
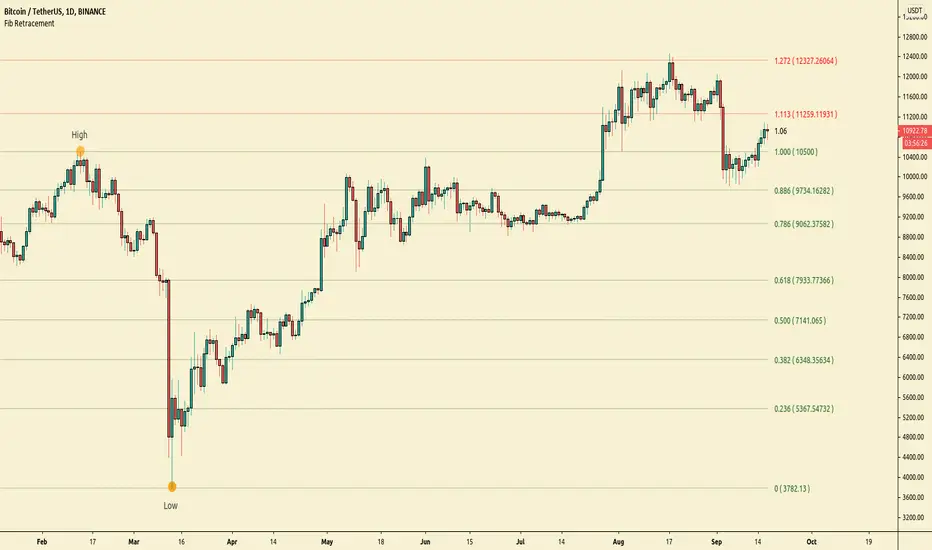
This is code for an Anchored fibonachi indicator where the anchor point is set interactively
this way you can change start date and fib level is calculating automaticly indicator is finding highest and lowest price and calculating fib levels
thanks to versiyon5
i hope tradingview will make a fibo widget like Anchored VWAP it will be very usefull
thanks good works so far :)
Fib

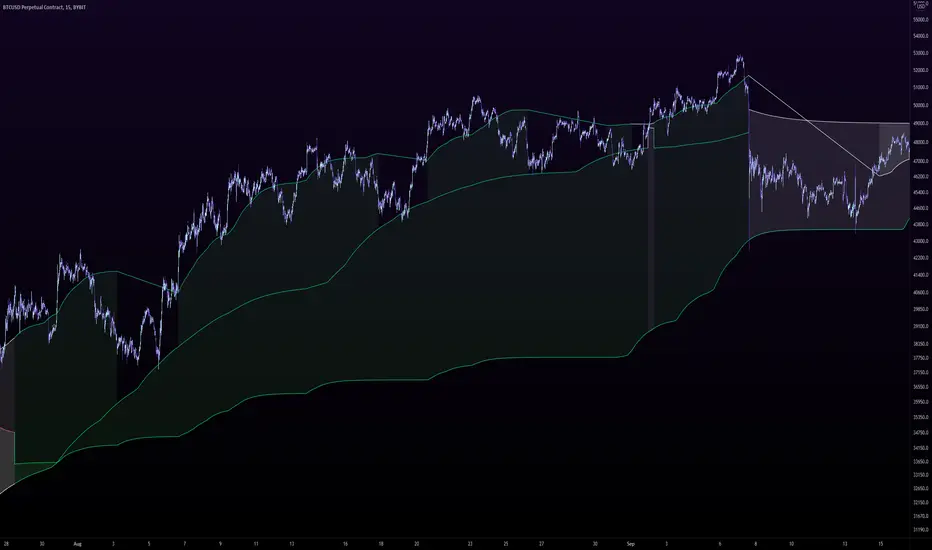
Auto Fib Golden Pocket Band - Autofib Moving Averageplots the fib retracement Golden pocket moving average band on two different pivots
Support and ResistanceThis indicator shows three types of support and resistance lines: Horizontal, Parallel (using linear regression) and Fibonacci Retracement. Lines can be adjusted or turned on and off in settings. A great tool for setting up entries, exits and locating pivot points.


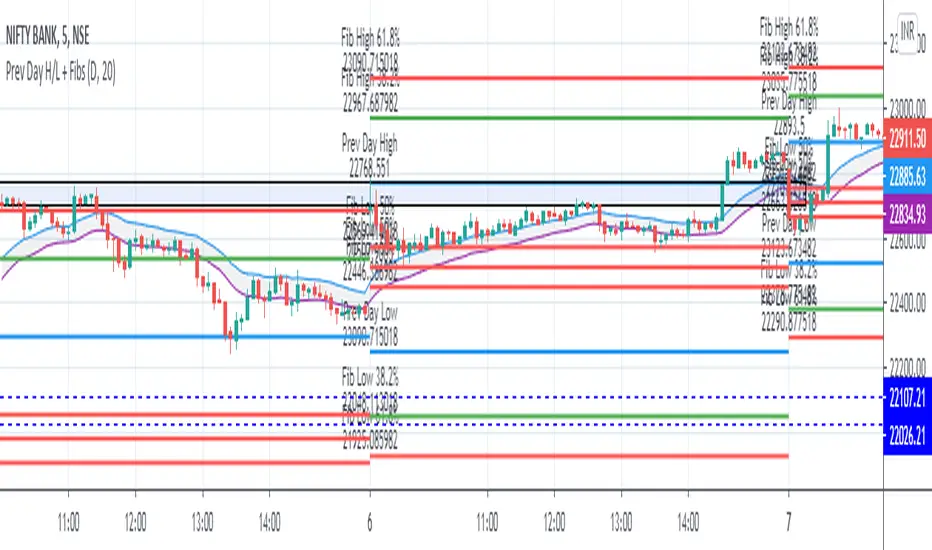
Intraday Trading ZonesThis script can help in intraday trading. It can plot
1. Previous day high, low and close.
2. Intraday Fibonacci levels
3. Big Round Numbers
3. CPR (Central Pivot Range)
4. VWAP

Martyv Auto Fib Retracement with Logarithmic SupportSimple & easy auto-fib levels. Took the out-of-the-box version provided by TradingView and added Logarithmic support and a nicer palette, and made the controls a bit nicer to use (in my opinion lol). Enjoy.

Fib-Simple MA MultiplesThis is just a Simple Moving Average script with several multipliers at Fibonacci number values. You can adjust the MA lengths and source value. Enjoy.

Auto Fibonacci ComboA combination of Fibonacci indicators including:
1- Moving Auto-calculated Fibo Retracement Levels
2- Dynamic Auto-calculated Fibo Extension Levels
3- Adjustable Auto-calculated Fibo Time Zones
4- ّFlexible Fibo Moving Averages Ribbon
The ribbon consists of 10 moving averages of selected source for different Fibonacci numbers count of bars which could be colorized for a better trend observation. Also the type of the moving averages could be picked up from 6 different types which are:
- SMA (Simple Moving Average)
- EMA (Exponential Moving Average)
- HMA (Hull Moving Average)
- LSMA (Least Squares Moving Average)
- TMA (Triangular Moving Average)
- MAEMA (My Personalized Momentum Adjusted EMA)
I think the latter one makes a nice conjunction with Fibonacci retracements.
Feel free to test the set and send me your thoughts.

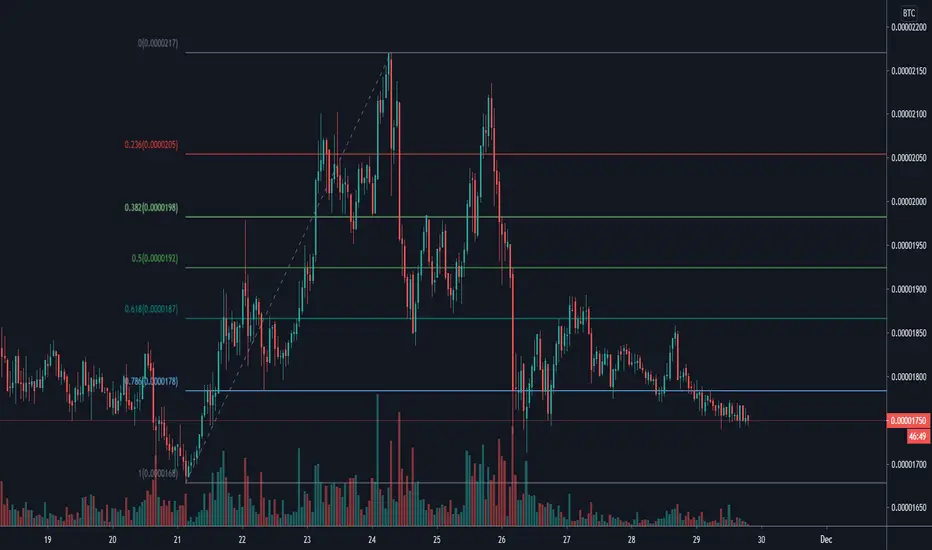
Auto Fib Retracement (Price Format)This is a modded version of TV builtin "Auto Fib Retracement". This version has the option to format price label. Sometimes when you analyzing e.g. altcoin charts against BTC. They can have more then 2 decimal points and the old version displays 0 when that happens. I also optimized it a little so it should be faster now
Previous Day High - Low and EMA BandThe fib are plotted to previous day High and low to find next days support and resistance based on fibs.
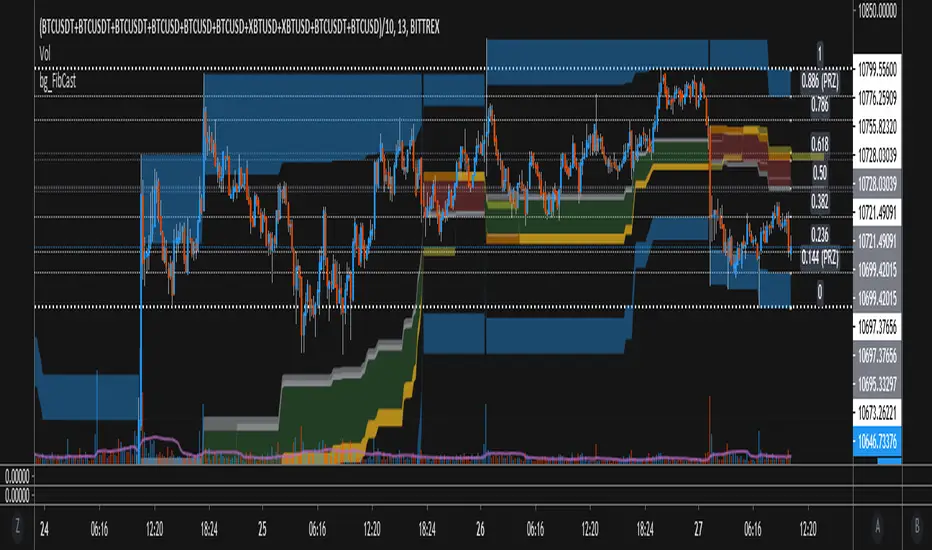
bgeraghty_FibCastThis script draws a High-To-Low or Low-To-High Fibonacci Retrace over the chart, based on which of those two happens in the given time period (Default is 144 Candles).
Updates from older versions:
- Paints 0.5, 0.618, 0.65 and spaces in between, giving good hindsight to the trend, and ideas of where strong support/resistance may lie.
- Silver Paint Strip = 0.50 retrace, Gold = 0.618-0.65, and the Red/Green between indicates the direction of the (Fib) Trend as H->L or L->H
- Paints 0.144 and 0.886 ranges Blue, and these are typically extremes or possible reversal zones. (PRZ)
Simple Fibonacci RetracementSimple Fibonacci Retracement is a free and easy to use script to plot Fibonacci levels, for any assets like Stocks, Forex, Commodities , Cryptocurrencies etc. on any time frame chart.
Fibonacci Levels can be plotted using Lookback or manual Price input from the settings.
1. Lookback type - Candles
Determines the High and Low price of the user input number of Candles back (100 default) and plots Fibonacci Levels based on the calculated High and Low for the number of candles in the past from the current candle. The levels stay intact on any time frame as long as no new Highs or Lows are formed.
2. Lookback type - Days
Determines the High and Low price of the user input number of Days back (100 default) and plots Fibonacci Levels based on the calculated High and Low for the number of days in the past from the day of the current bar. The levels stay intact on any time frame as long as no new Highs or Lows are formed.
3. Manual Price Input
Plots Fibonacci Levels based on the user specified High and Low Price in the settings input fields. The levels stay intact on any time frame irrespective of new Highs or Lows being formed. Manual Price Input will enable the trader to keep the Levels intact and visually see the higher Fibonacci Retracement levels, when the price crosses beyond 100% retracement. On the other two lookback types, the Fibonacci levels are displayed only upto 100% retracement.
The Fibonacci levels can also be reversed by enabling 'Reverse' option from the settings.
Volatility based Standarde Deviation and Fib. Pivot PointsThis indicator plots Standard deviation levels and Fib. Pivot Points. I prefer to use only SD levels but Fib. levels also come handy in providing support and resistance.
How to use this indicator:
You have to manually enter instrument's Closing Price / Settlement Price and VIX closing price to draw each day's levels.
For NQ, I use VXN closign price and for ES or RTY, I use VIX closing price.
This indicator can be used on individual stocks and forex pairs.

Bollinger Bands Fibonacci Ratios (Automatic Timeframe)A Fibonacci Bollinger Bands indicator with automatic timeframe detection.
The timeframe reverts to the value specified in settings when viewing Daily, Monthly or seconds-based charts.
Based on: Bollinger Bands Fibonacci ratios by Shizaru (/script/bCy9urOG-Bollinger-Bands-Fibonacci-ratios/)

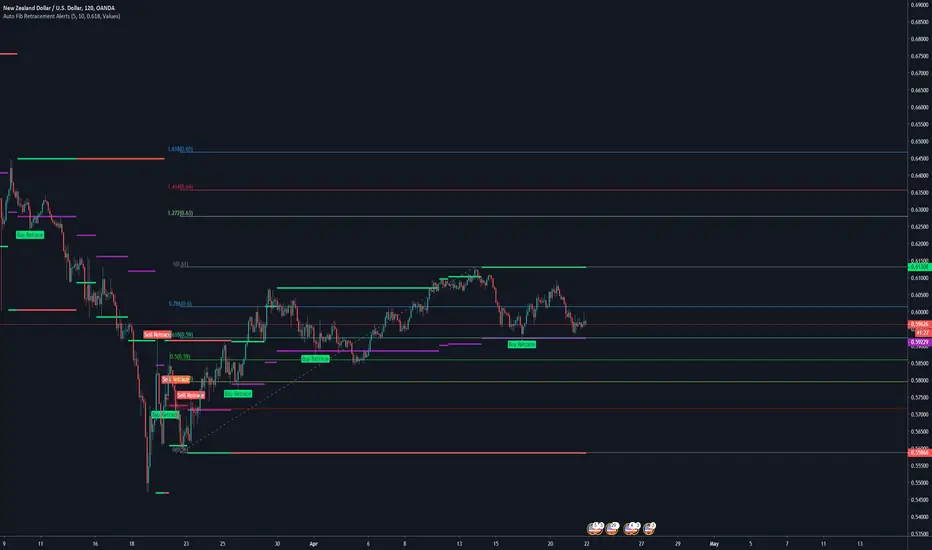
Auto Fib Retracement AlertsFor the fibonacci traders.
The Auto Fib Retracement Is a good indicator for tradingview to show you the current alerts and points to watch in the market
IMPORTANT SETTING => Retracement
This controls your alert levels
I have modified it to deliver the following
+Custom Fib retracement level alerts
+Drawing of old levels and retracement levels
+Backtesting Old Alerts
There are two shapes drawn on the chart;
Shown When the fib end is attained and market retraces back to your level
1. Buy retracement -
2. Sell retracement
How are they detected?
When we have new levels in the market; this is when the red or gree line changes, we calculate the new fib level that we will be watching for retracement
This is the purple level drawn on the chart
When the market first crosses below or above this level, The alert will be fired.
Consequent crosses are not updated
Enjoy! 😍
Originally requested by trade atechproduction
FibboGattoFibboGatto
Up = crossover(FG,ema(FG,period)) , color=blue
Down = crossunder(FG,ema(FG,period)) , color=orange
Uptrend = (FG>ema(FG,period)) ,color=lime
Downtrend = (FG<ema(FG,period)) , color=red

4 Fibonacci EMAsAdd 4 Fibonacci EMAs to your charts with one indicator.
Configureable by value, so they don't necessarily have to use Fibonacci numbers, and by colors.

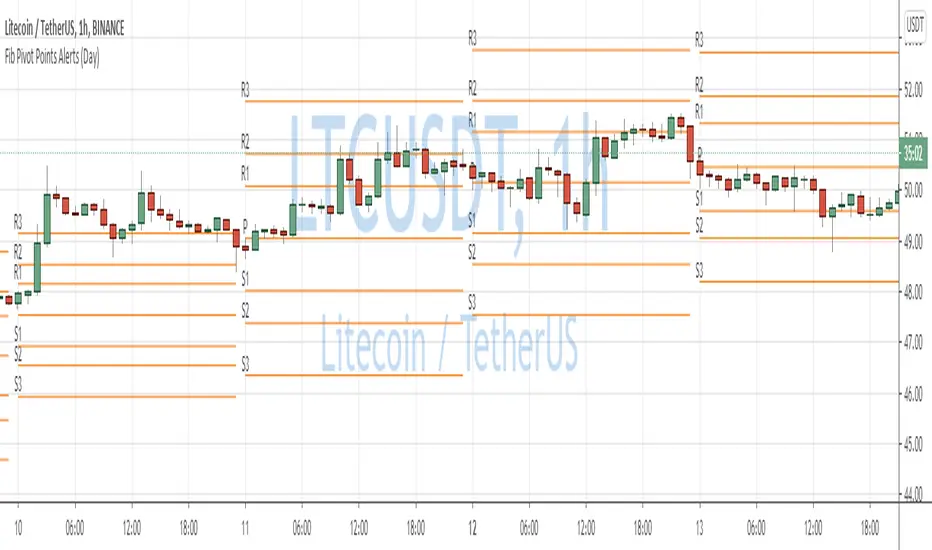
Fibonacci Pivot Points AlertsCreated a script for alerts on Fibonacci Pivot Points.
You will be able to create separate alerts for every level or create one for price crossing any level.
Because of some TradingView limitations, alerts won't be fired for the first bar of the session. Will try to solve that in the new versions.
In the script used new v4 plotting features, so will be able to plot levels and labels nicely. Unfortunately, there is a limit on the number of consecutive lines you can plot on the plot (around 50), so lines in the past will disappear.
And remember:
Past performance does not guarantee future results.
Lysergik's Stochastic SynergyThis indicator shows the average Stochastic RSI output of the 15m, 1h, 2h, 4h, and Daily Stochastic RSI. It will change in its behavior depending on the time-frame you're using, but for many markets it works best on the 30m time-frame and the daily time-frame.
It is best used along with Lysergik's Fib Cross, which will allow you to avoid false signals in the stochastic synergy indicator. If your MA cross (50, 200) indicates a direction change opposite of the stochastic RSI synergy indicator then that is a signal to wait for more price action to determine your entry/exit points.
Using the Lysergik's Fib Cross, the same applies, but remember that a golden cross (white cross symbol) followed directly by a golden ratio cross (gold cross symbol) is even further indication that the stochastic RSI needs more breathing room before reversing.
This indicator is fully adjustable for you to back-test against charts and refine the indicator to your market.
The inputs in respective order are as follows:
RSI Length, Stoch Length, Smooth K, Smooth D, Upper Limit, Lower Limit, Basis
Enjoy and remember only make trades on your own terms.
Happy trading/investing! :)

Fibonacci Pivot RangeThis is based on Fibonacci Pivot Points. I forked "CristianD CD_PivotR" code for this. Thanks
"Fibonacci Pivot Points start just the same as Standard Pivot Points. From the base Pivot Point, Fibonacci multiples of the high-low differential are added to form resistance levels and subtracted to form support levels."
Pivot Point (P) = (High + Low + Close)/3
Support 1 (S1) = P - {.382 * (High - Low)}
Support 2 (S2) = P - {.618 * (High - Low)}
Resistance 1 (R1) = P + {.382 * (High - Low)}
Resistance 2 (R2) = P + {.618 * (High - Low)}
Adding more support or resistance levels should be really easy.

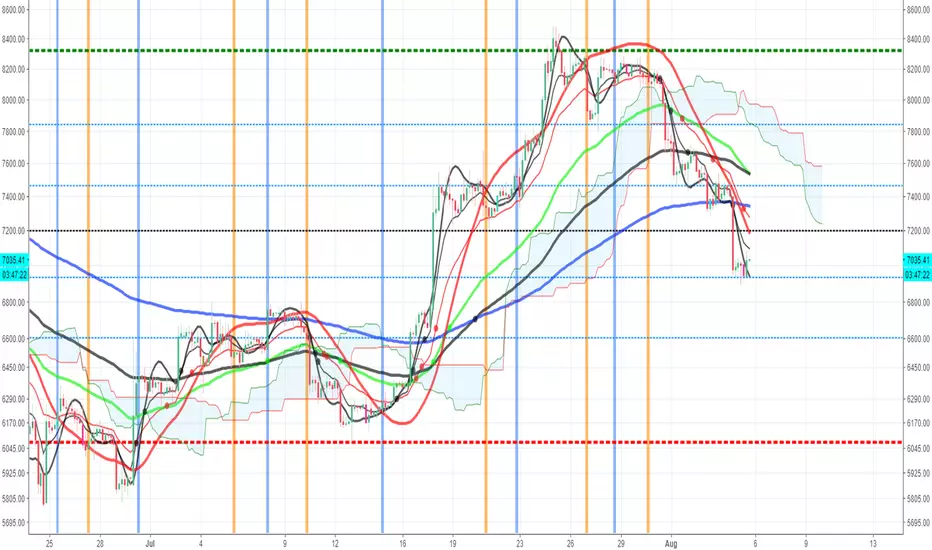
Trading ComboThis is a combo of many indicators including :
Ichimoku Cloud(With Buy and Sell Signals)
EMA
MA
HULL MA
Fibonacci Lines
Bitcoin Kill Zones(Turned off by Default)
MA Turning Points
Reversal(Pin) Bars and Upshaved and Downshaved Bars(Inside and Outside Bars Disabled By default)
Credits to for the source code:
Lazybear
ChrisMoody
100kiwi
Gesundheit
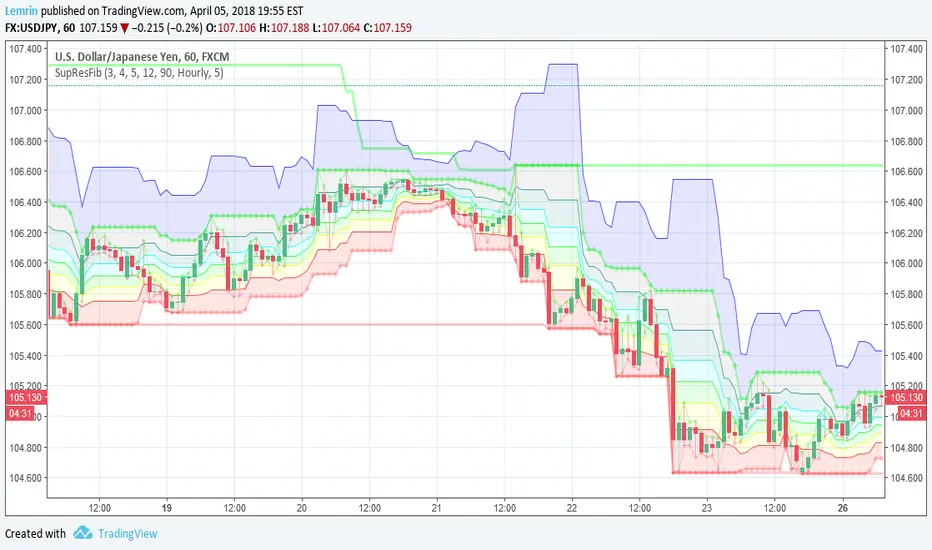
Automatic Support, Resistance, Fibonacci LevelsThis indicator plots absolute high and low values for up to five completely adjustable time periods (in months, weeks, days, hours, minutes) and optionally calculates the Fibonacci levels on the pair of absolutes of your choice, ascending or descending, and mimics the shading available in the built-in Fib charting tools (e.g. retracement).
Here are a few screenshots of the same chart with various options selected.
3-Month, 4-Week, and 5-Day absolutes with 3-Monthly Fib plotted:
The same chart with 4-Weekly Fib:
The same chart with 5-Daily Fib:
5-Day, 12-Hour, 90-Minute absolutes with 12-Hourly Fib:
Zoomed in, on a 30-minute interval, with 90-minute Fib:
With descending ("inverted") 90-minute Fib:
I started putting this together for Vazzyb, who was looking for a way to automate plotting horizontal support and resistance levels for monthly, weekly, and daily extremes, and then I added additional features as they occurred to me. Special thanks to Paaax, who suggested I add Fib levels.
I am leaving the code open, so you may feel free to grab snippets you like and use them for your own purposes. Of particular interest may be my custom "calc_fib()" function, which accepts any series pair, as well as a Boolean indicating whether to invert, and returns an array with each of the major Fibonacci levels: .
If anyone likes this enough to feel generous, please feel free:
BTC
3KmFchJ18QvMzAJKDcFQXvyK9p1EHWQdhP
BCH
qqtrw64ptuwprk5vtj3z8qwkvh3v0jawxq7khqng7x
ETH
0x9b51361A278910Ba3945C7519C9f0FA8a77df18d
LTC
MDeWWsP7XCG2zQuZ2dYALZXQ52u2qkc8fh
P.S. If you want the time lengths to be as close to accurate as possible, don't forget to change the number of days per week when using for cryptocurrency!
Securities day session - Opening-Range- Jayy Opening Range (OR) for regular daytime session eg NYSE 0 930hrs to 1600 hrs.
This is not for Forex sessions which is addressed in a separate script.
This script fixes two issues:
syntax error when code compiles
flaky plotting of the opening range and targets that required page reloading
Additions:
In this code there are more more opening range time period choices at the bottom of the format dialogue box
Opening Range Targets:
Opening Range Targets as per Leaf_West
Targets are set at 127% , 162%, 200 %, 262 %, 362%, 423%, 685%, 1109% and 1794% and this can be traded intraday using methods described at charts-by-leaf.com I also have some Leaf West PDFs that describe how the targets are set and how they are traded. There are others that use opening range.
See the notes in the script for more detail.
My first opening range script originated from work done by Chris Moody. This script has changed significantly but there are small remnants of Chris Moody's script lurking within.
This script is available to all.
Cheers Jayy
