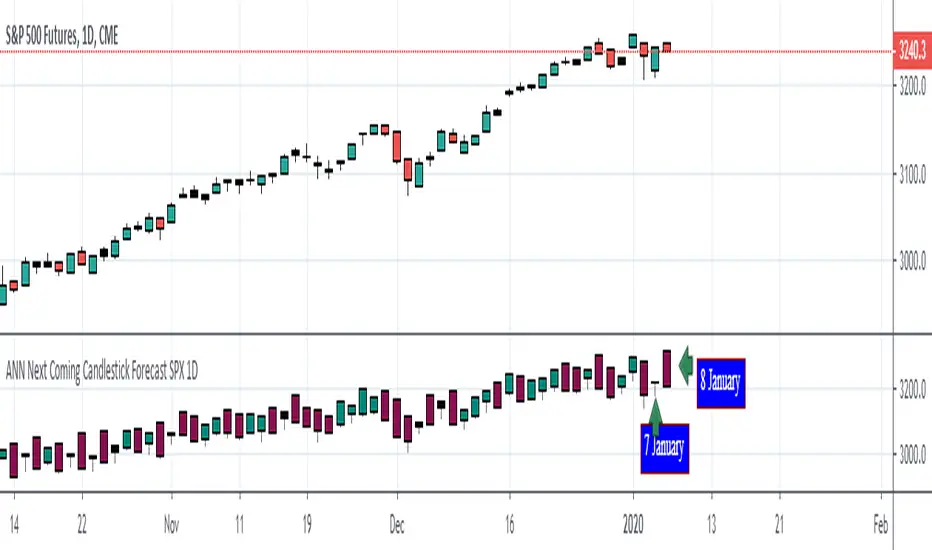
ANN Next Coming Candlestick Forecast SPX 1D v1.0WARNING:
Experimental and incomplete.
Script is open to development and will be developed.
This is just version 1.0
STRUCTURE
This script is trained according to the open, close, high and low values of the bars.
It is tried to predict the future values of opening, closing, high and low values.
A few simple codes were used to correlate expectation with current values. (You can see between line 129 - 159 )
Therefore, they are all individually trained.
You can see in functions.
The average training error of each variable is less than 0.011.
NOTE :
This script is designed for experimental use on S & P 500 and connected instruments only on 1-day bars.
The Plotcandle function is inspired by the following script of alexgrover :
Since we estimate the next values, our error rates should be much lower for all candlestick values. This is just first version to show logic.
I will continue to look for other variables to reach average error = 0.001 - 0.005 for each candlestick status.
Feel free to use and improve , this is open-source.
Best regards.
Forecast
Fancy Moving Average [BigBitsIO]This script is for a single moving average with as many features as I can possibly fit into a single moving average. If you can think of more, or have questions regarding this script, please message me or contact me via social media.
Features:
- A single moving average (MA).
- Standard MA inputs.
- MA type.
- MA period.
- MA price.
- MA resolution (time frame).
- Visibility toggle.
- Fancy MA inputs.
- Toggle to show only candles included in the MA calculation ("Highlight inclusion") or display entire MA history.
- Toggle to show a ghost trail when Highlight inclusion is toggled on. Displays a shaded version of past MA history before the inclusion period (as seen on snapshot).
- Toggle to show forecast values for the MA.
- Other inputs related to forecasting:
- Forecast bias. (Neutral forecasts MA if the current price remains the same.)
- Forecast period.
- Forecast magnitude.
*** DISCLAIMER: For educational and entertainment purposes only. Nothing in this content should be interpreted as financial advice or a recommendation to buy or sell any sort of security or investment including all types of crypto. DYOR, TYOB. ***

[RS][V4]ZigZag Percent Reversal - Helper - AntiSlopeEXPERIMENTAL:
A helper script to map the Anti derivative slopes.
Quadratic Least Squares Moving Average - Smoothing + Forecast Introduction
Technical analysis make often uses of classical statistical procedures, one of them being regression analysis, and since fitting polynomial functions that minimize the sum of squares can be achieved with the use of the mean, variance, covariance...etc, technical analyst only needed to replace the mean in all those calculations with a moving average, we then end up with a low lag filter called least squares moving average (lsma) .
The least squares moving average could be classified as a rolling linear regression, altho this sound really bad it is useful to understand the relationship of both methods, both have the same form, that is ax + b , where a and b are coefficients of the model. However in a simple linear regression a and b are constant, while the lsma use variables instead.
In a simple lsma we model the relationship of the closing price (dependent variable) with a linear sequence (independent variable), therefore x = 1,2,3,4..etc. However we can use polynomial of higher degrees to model such relationship, this is required if we want more reactivity. Therefore we can use a quadratic form, that is ax^2 + bx + c , where a,b and c are variables.
This is the quadratic least squares moving average (qlsma), a not so official term, but we'll stick with it because it still represent the aim of the filter quite well. In this indicator i make the calculations of the qlsma less troublesome, therefore one might understand how it would work, note that in general the coefficients of a polynomial regression model are found using matrix calculus.
The Indicator
A qlsma, unlike the classic lsma, will fit better to the price and will be more reactive, this is the advantage of using an higher degrees for its calculation, we can model more complex relationship.
lsma in green, qlsma in red, with both length = 200
However the over/under shoots are greater, i'll explain why in the next sections, but this is one of the drawbacks of using higher degrees.
The indicator allow to forecast future values, the ahead period of the forecast is determined by the forecast setting. The value for this setting should be lower than length, else the forecasts can easily over/under shoot which heavily damage the forecast. In order to get a view on how well the forecast is performing you can check the option "Show past predicted values".
Of course understanding the logic behind the forecast is important, in short regressions models best fit a certain curve to the data, this curve can be a line (linear regression), a parabola (quadratic regression) and so on, the type of curve is determined by the degree of the polynomial used, here 2, which is a parabola. Lets use a linear regression model as example :
ax + b where x is a linear sequence 1,2,3...and a/b are constants. Our goal is to find the values for a and b that minimize the sum of squares of the line with the dependent variable y, here the closing price, so our hypothesis is that :
closing price = ax + b + ε
where ε is white noise, a component that the model couldn't forecast. The forecast of the closing price 14 step ahead would be equal to :
closing price 14 step aheads = a(x+14) + b
Since x is a linear sequence we only need to sum it with the forecasting horizon period, the same is done here with :
a*(n+forecast)^2 + b*(n + forecast) + c
Note that the forecast proposed in the indicator is more for teaching purpose that anything else, this indicator can't possibly forecast future values, even on a meh rate.
Low lag filters have been used to provide noise free crosses with slow moving average, a bad practice in my opinion due to the ability low lag filters have to overshoot/undershoot, more interesting use cases might be to use the qlsma as input for other indicators.
On The Code
Some of you might know that i posted a "quadratic regression" indicator long ago, the original calculations was coming from a forum, but because the calculation was ugly as hell as well as extra inefficient (dogfood level) i had to do something about it, the name was also terribly misleading.
We can see in the code that we make heavy use of the variance and covariance, both estimated with :
VAR(x) = SMA(x^2) - SMA(x)^2
COV(x,y) = SMA(xy) - SMA(x)SMA(y)
Those elements are then combined, we can easily recognize the intercept element c , who don't change much from the classical lsma.
As Digital Filter
The frequency response of the qlsma is similar to the one of the lsma, those filters amplify certain frequencies in the passband, and have ripples in the stop band. There is something interesting about those filters, first using higher degrees allow to greater boost of the frequencies in the passband, which result in greater over/under shoots. Another funny thing is that the peak/valley of the ripples is equal the peak or valley in the ripples of another lsma of different degree.
The transient response of those filters, that is impulse response, step response...etc is related to the degree of the polynomial used, therefore lets denote a lsma of degree p : lsma(p) , the impulse response of lsma(p) is a polynomial of degree p, and the step response is simple a polynomial of order p+1.
This is why it was more interesting to estimate the qlsma using convolution, however we can no longer forecast future values.
Conclusion
I proposed a more usable quadratic least squares moving average, with more options, as well as a cleaner and more efficient code. The process of shrinking the original code is made easier when you know about the estimations of both variance and covariance.
I hope the proposed indicator/calculation is useful.
Thx for reading !

Scripting Tutorial 9 - TManyMA Strategy - Long Market Order OnlyThis script is for a triple moving average strategy where the user can select from different types of moving averages, price sources, lookback periods and resolutions.
Features:
- 3 Moving Averages with variable MA types, periods, price sources, resolutions and the ability to disable each individually
- Crossovers are plotted on the chart with detailed information regarding the crossover (Ex: 50 SMA crossed over 200 SMA )
- Forecasting available for all three MAs. MA values are forecasted 5 values out and plotted as if a continuation to the MA.
- Forecast bias also applies to all forecasting. Bias means we can forecast based on an anticipated bullish, bearish or neutral direction in the market.
- To understand bias, please read the source code, or if you can't read the code just send me a message on here or Twitter. Twitter should be linked to my profile.
- Ribbons added and on by default. Optional setting to disable the ribbons. 5 ribbons between MA1 and MA2 and another 5 between MA2 and MA3.
- Ribbons are alpha-color coded based on their relation to their default MAs.
- Ribbons are only visible between MAs if the MAs being compared share the same Type, Resolution, and Source because there is no way to consolidate those three in a simple manner.
- Ribbon values are calculated based on calculated MA Periods between the MAs.
- Converted the existing study into a strategy
- Strategy only enters long positions with a market order when MA crossovers occur
- Strategy exits positions when crossunders occur
- Trades 100% of the equity with one order/position by default
- Ability to disable trading certain crosses with input checks
This script is meant as an educational script with well-formatted styling, and references for specific functions.
*** PLEASE NOTE - THIS STRATEGY IS MEANT FOR LEARNING PURPOSES. DEPENDING ON IT'S CONFIGURATION IT MAY OR MAY NOT BE USEFUL FOR ACTUAL TRADING. THE STRATEGY IS NOT FINANCIAL ADVICE ***

Scripting Tutorial 8 - Triple Many Moving Averages RibbonsThis script is for a triple moving average indicator where the user can select from different types of moving averages, price sources, lookback periods and resolutions.
Features:
- 3 Moving Averages with variable MA types, periods, price sources, resolutions and the ability to disable each individually
- Crossovers are plotted on the chart with detailed information regarding the crossover (Ex: 50 SMA crossed over 200 SMA )
- Forecasting available for all three MAs. MA values are forecasted 5 values out and plotted as if a continuation to the MA.
- Forecast bias also applies to all forecasting. Bias means we can forecast based on an anticipated bullish, bearish or neutral direction in the market.
- To understand bias, please read the source code, or if you can't read the code just send me a message on here or Twitter. Twitter should be linked to my profile.
- Ribbons added and on by default. Optional setting to disable the ribbons. 5 ribbons between MA1 and MA2 and another 5 between MA2 and MA3.
- Ribbons are alpha-color coded based on their relation to their default MAs.
- Ribbons are only visible between MAs if the MAs being compared share the same Type, Resolution, and Source because there is no way to consolidate those three in a simple manner.
- Ribbon values are calculated based on calculated MA Periods between the MAs.
This script is meant as an educational script with well-formatted styling, and references for specific functions.

InfoPanel Divergence IndicatorThis panel spots divergences of some well knonw indicators. It may be usefull because you have all indicators in one panel only.
Also, you can check on chart which indicator gives better results of each pair on stock or index or crypto.
TO DO: to add custom indicators.
thanks to: RicardoSantos for his script of panel coding
Tradingview scripts
Other members of TV community (I cannot remember the source and inspiration of all snipets)
Please use comment section for any feedback.

Scripting Tutorial 6 - Triple Many Moving Averages ForecastingThis script is for a triple moving average indicator where the user can select from different types of moving averages, price sources and lookback periods.
Features:
- 3 Moving Averages with variable MA types, periods, price sources and ability to disable each individually
- Crossovers are plotted on the chart with detailed information regarding the crossover (Ex: 50 SMA crossed over 200 SMA )
- Forecasting available for all three MAs. MA values are forecasted 5 values out and plotted as if a continuation to the MA.
- Forecast bias also applies to all forecasting. Bias means we can forecast based on an anticipated bullish, bearish or neutral direction in the market.
- To understand bias, please read the source code, or if you can't read the code just send me a message on here or Twitter. Twitter should be linked on my profile.
This script is meant as an educational script with well-formatted styling, and references for specific functions.

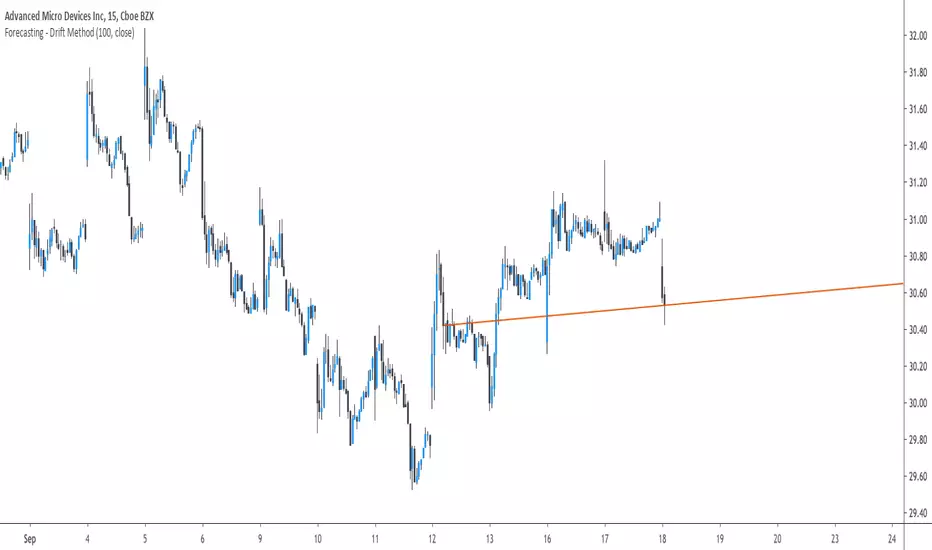
Forecasting - Drift MethodIntroduction
Nothing fancy in terms of code, take this post as an educational post where i provide information rather than an useful tool.
Time-Series Forecasting And The Drift Method
In time-series analysis one can use many many forecasting methods, some share similarities but they can all by classified in groups and sub-groups, the drift method is a forecasting method that unlike averages/naive methods does not have a constant (flat) forecast, instead the drift method can increase or decrease over time, this is why its a great method when it comes to forecasting linear trends.
Basically a drift forecast is like a linear extrapolation, first you take the first and last point of your data and draw a line between those points, extend this line into the future and you have a forecast, thats pretty much it.
One of the advantage of this method is first its simplicity, everyone could do it by hand without any mathematical calculations, then its ability to be non-conservative, conservative methods involve methods that fit the data very well such as linear/non-linear regression that best fit a curve to the data using the method of least-squares, those methods take into consideration all the data points, however the drift method only care about the first and last point.
Understanding Bias And Variance
In order to follow with the ability of methods to be non-conservative i want to introduce the concept of bias and variance, which are essentials in time-series analysis and machine learning.
First lets talk about training a model, when forecasting a time-series we can divide our data set in two, the first part being the training set and the second one the testing set. In the training set we fit a model to the training data, for example :
We use 200 data points, we split this set in two sets, the first one is for training which is in blue, and the other one for testing which is in green.
Basically the Bias is related to how well a forecasting model fit the training set, while the variance is related to how well the model fit the testing set. In our case we can see that the drift line does not fit the training set very well, it is then said to have high bias. If we check the testing set :
We can see that it does not fit the testing set very well, so the model is said to have high variance. It can be better to talk of bias and variance when using regression, but i think you get it. This is an important concept in machine learning, you'll often see the term "overfitting" which relate to a model fitting the training set really well, those models have a low to no bias, however when it comes to testing they don't fit well at all, they have high variance.
Conclusion On The Drift Method
The drift method is good at forecasting linear trends, and thats all...you see, when forecasting financial data you need models that are able to capture the complexity of the price structure as well as being robust to noise and outliers, the drift method isn't able to capture such complexity, its not a super smart method, same goes for linear regression. This is why more peoples are switching to more advanced models such a neural networks that can sometimes capture such complexity and return decent results.
So this method might not be the best but if you like lines then here you go.
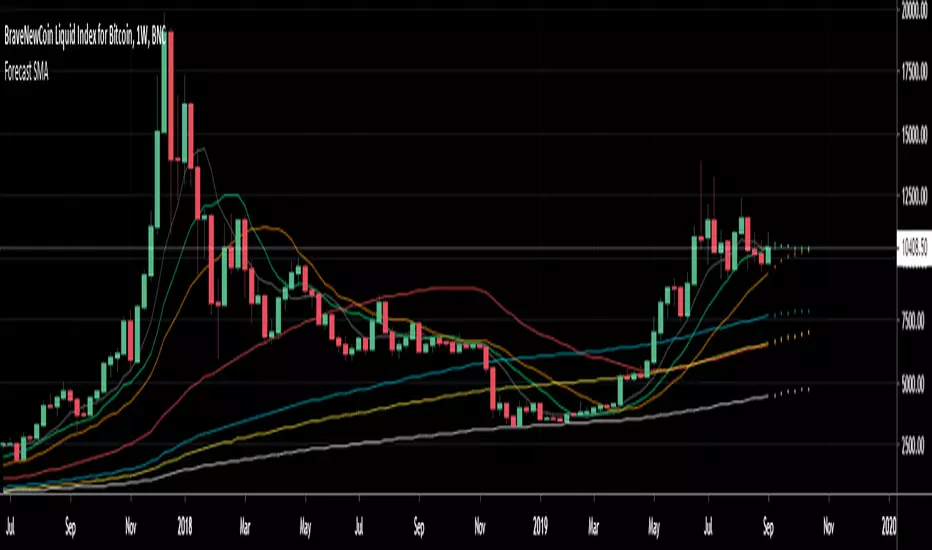
Forecast 7 SMA's 6 periodsForecast 7 SMA's 6 periods
This script is an upgrade of the existing Triple MA Forecast from Yatrader2
To allow the user to display 7 different SMAs and look 6 candles ahead
Default Value
8 SMA
13 SMA
20 SMA
50 SMA
100 SMA
128 SMA
200 SMA
Note:
Best to use on high timeframe, if on low timeframe change the forecast maximum to lower
This was made to forecast the 20 SMA on weekly timeframe on the upcomming Bitcoin price
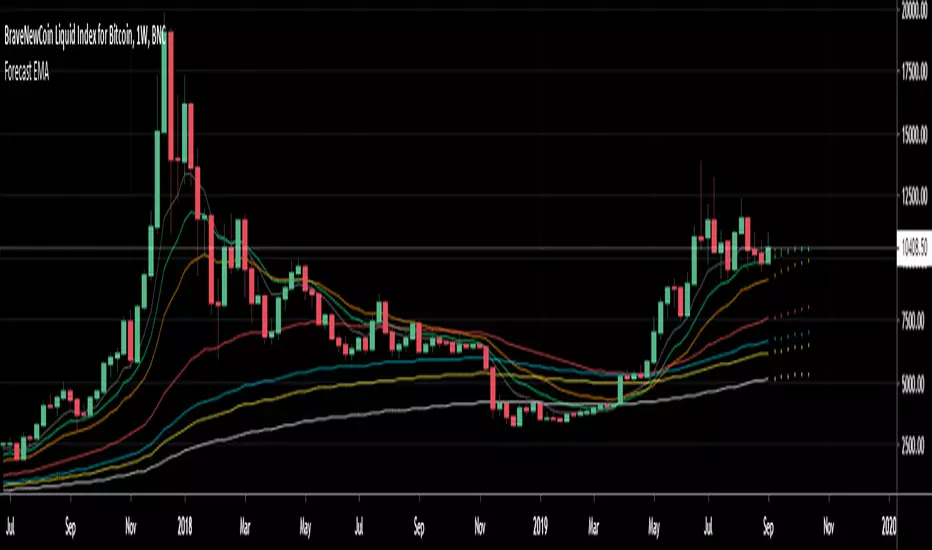
Forecast 7 EMA's 6 periodsForecast 7 EMA's 6 periods
This script is an upgrade of the existing Triple MA Forecast from Yatrader2
To allow the user to display 7 different EMAs and look 6 candles ahead
Default Value
8 ema
13 ema
21 ema
55 ema
100 ema
128 ema
200 ema
Note:
Best to use on high timeframe, if on low timeframe change the forecast maximum to lower
This was made to forecast the 21 ema on weekly timeframe on the upcomming Bitcoin price
Forecast Oscillator & Point of ForceThis is a scaled version of the Forecast Oscillator, paired with a Point of Force Indicator, my modification of an indicator, whose original name and developer happened to be missing on my notes, so my regards to the author).
Point of force is a spot from where price action will dynamically evolve in the same direction or soon reverse and pursue that reversed path. It may be an indication of a turning point or entry point to consider going long/short and should be use together with a background oscillator showing a prevailing local trend.

Forecast Oscillator (ps4)This is a scaled version of a Forecast Oscillator, which may be used as a standalone indicator or as a filter. Scaling allows to reduce data to a standard interval, say, 0..1 or -1..1. Oftentimes, it also makes data more contrastive.

Combo Backtest 123 Reversal & Chande Forecast Oscillator This is combo strategies for get a cumulative signal.
First strategy
This System was created from the Book "How I Tripled My Money In The
Futures Market" by Ulf Jensen, Page 183. This is reverse type of strategies.
The strategy buys at market, if close price is higher than the previous close
during 2 days and the meaning of 9-days Stochastic Slow Oscillator is lower than 50.
The strategy sells at market, if close price is lower than the previous close price
during 2 days and the meaning of 9-days Stochastic Fast Oscillator is higher than 50.
Second strategy
The Chande Forecast Oscillator developed by Tushar Chande The Forecast
Oscillator plots the percentage difference between the closing price and
the n-period linear regression forecasted price. The oscillator is above
zero when the forecast price is greater than the closing price and less
than zero if it is below.
WARNING:
- For purpose educate only
- This script to change bars colors.
Combo Strategy 123 Reversal & Chande Forecast Oscillator This is combo strategies for get a cumulative signal.
First strategy
This System was created from the Book "How I Tripled My Money In The
Futures Market" by Ulf Jensen, Page 183. This is reverse type of strategies.
The strategy buys at market, if close price is higher than the previous close
during 2 days and the meaning of 9-days Stochastic Slow Oscillator is lower than 50.
The strategy sells at market, if close price is lower than the previous close price
during 2 days and the meaning of 9-days Stochastic Fast Oscillator is higher than 50.
Second strategy
The Chande Forecast Oscillator developed by Tushar Chande The Forecast
Oscillator plots the percentage difference between the closing price and
the n-period linear regression forecasted price. The oscillator is above
zero when the forecast price is greater than the closing price and less
than zero if it is below.
WARNING:
- For purpose educate only
- This script to change bars colors.

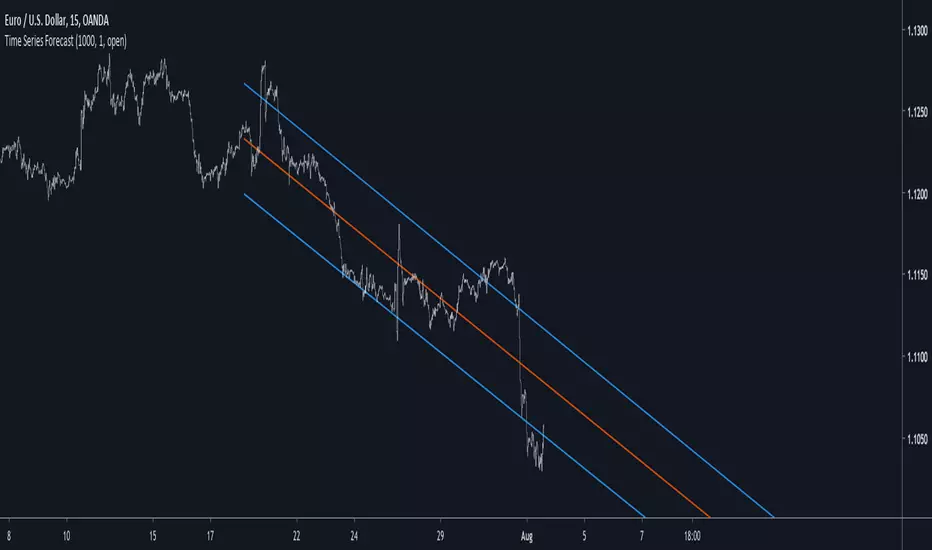
Time Series ForecastIntroduction
Forecasting is a blurry science that deal with lot of uncertainty. Most of the time forecasting is made with the assumption that past values can be used to forecast a time series, the accuracy of the forecast depend on the type of time series, the pre-processing applied to it, the forecast model and the parameters of the model.
In tradingview we don't have much forecasting models appart from the linear regression which is definitely not adapted to forecast financial markets, instead we mainly use it as support/resistance indicator. So i wanted to try making a forecasting tool based on the lsma that might provide something at least interesting, i hope you find an use to it.
The Method
Remember that the regression model and the lsma are closely related, both share the same equation ax + b but the lsma will use running parameters while a and b are constants in a linear regression, the last point of the lsma of period p is the last point of the linear regression that fit a line to the price at time p to 1, try to add a linear regression with count = 100 and an lsma of length = 100 and you will see, this is why the lsma is also called "end point moving average".
The forecast of the linear regression is the linear extrapolation of the fitted line, however the proposed indicator forecast is the linear extrapolation between the value of the lsma at time length and the last value of the lsma when short term extrapolation is false, when short term extrapolation is checked the forecast is the linear extrapolation between the lsma value prior to the last point and the last lsma value.
long term extrapolation, length = 1000
short term extrapolation, length = 1000
How To Use
Intervals are create from the running mean absolute error between the price and the lsma. Those intervals can be interpreted as possible support and resistance levels when using long term extrapolation, make sure that the intervals have been priorly tested, this mean the intervals are more significants.
The short term extrapolation is made with the assumption that the price will follow the last two lsma points direction, the forecast tend to become inaccurate during a trend change or when noise affect heavily the lsma.
You can test both method accuracy with the replay mode.
Comparison With The Linear Regression
Both methods share similitudes, but they have different results, lets compare them.
In blue the indicator and in red a linear regression of both period 200, the linear regression is always extremely conservative since she fit a line using the least squares method, at the contrary the indicator is less conservative which can be an advantage as well as a problem.
Conclusion
Linear models are good when what we want to forecast is approximately linear, thats not the case with market price and this is why other methods are used. But the use of the lsma to provide a forecast is still an interesting method that might require further studies.
Thanks for reading !
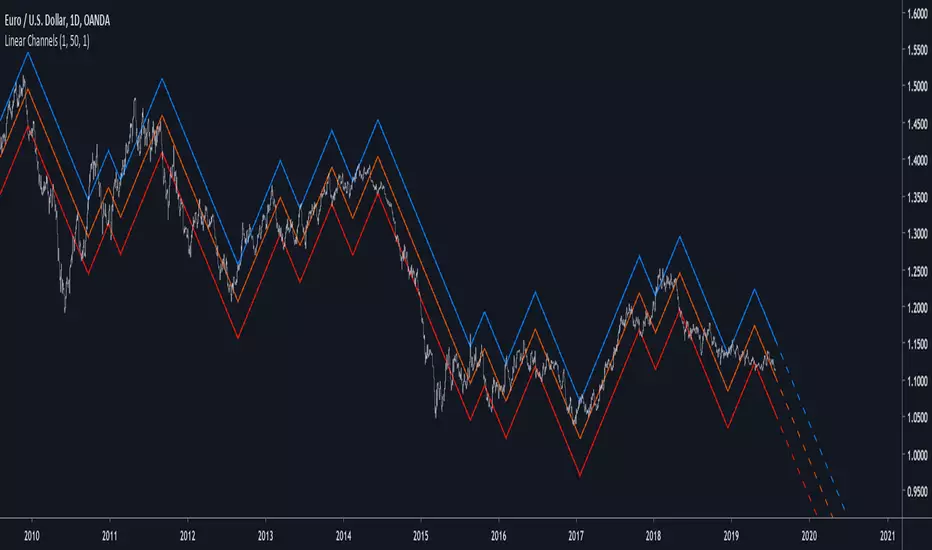
Linear ChannelsIntroduction
I already made an indicator (simple line) that tried to make lines on price such that the results would not repaint and give a good fit to the price, today i publish a channels indicator based on the simple line indicator. The indicator aim to show possible support and resistance levels when the central line posses a low sum of squares with the price, a linear extrapolation was also provided in order to show possible future price positions respective to the channels.
The Indicator
The emphasis parameter of the simple line indicator has been removed, instead we keep length and mult as numerical input parameters. In general length control how persistent the lines are, larger values will create longer lines on average, mult help make the line fit to the price better but might as well affect how spread the channels are as well as the lines average length. When mult > length the lines will fit better the price while when length >= mult the fit might not be the best.
The point parameter allow you to fix the indicator when using it on high market price values or when the indicator exhibit a weird behaviour.
point = false on btcusd
point = true
If the lines still does not fit well enough try to lower length.
I know this might result inconvenient in so many ways but i'am working on simplifying things. Therefore some larger price values might use lower length and use mult instead. For market not using the point parameters a settings of : length > 1 and mult = length*2 might provide a good to go setup.
The channel spreading parameter allow to make spread the channels by a certain factor.
Issues
I'am still not good with line extensions, if it bother you deactivate the extrapolation parameter. Sorry for the inconvenience.
Conclusion
It is possible to make non repainting linear indicators, and i'am working on some of them. While some might argue that price is not linear thus not requiring the use of linear indicators it can still be interesting to use those if they, unlike the linear regression, don't repaints and provide a way to change their directions according to the price trend.
Thanks for reading !
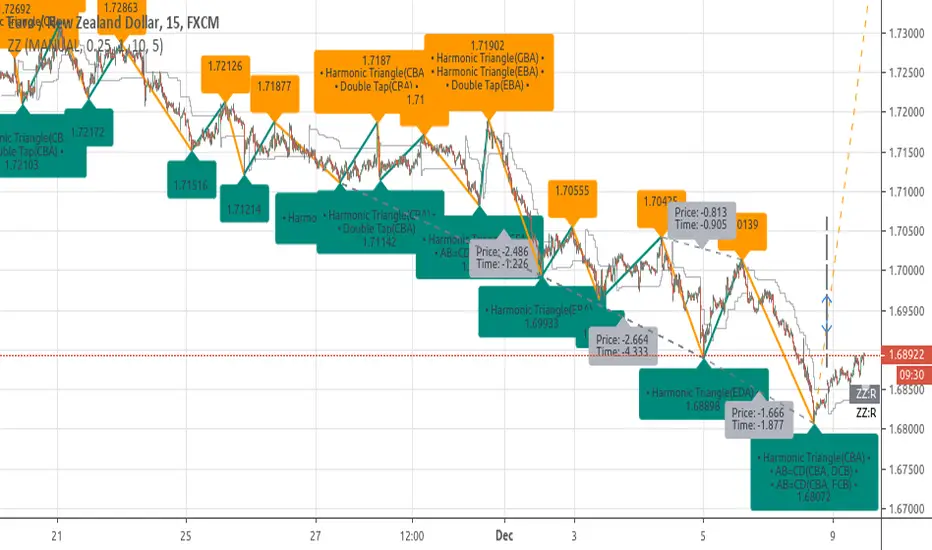
[RS]ZigZag Percent Reversal - Forecast - patterns - labels description:
• Zig Zag indicator plots points on the chart whenever prices reverse
by a percentage greater than a pre-chosen variable.
• Forecasts area based on zigzag statistics.
• Displays labels with detected patterns.
• Displays slope information rate of price, time diferentials and angle(experimental)
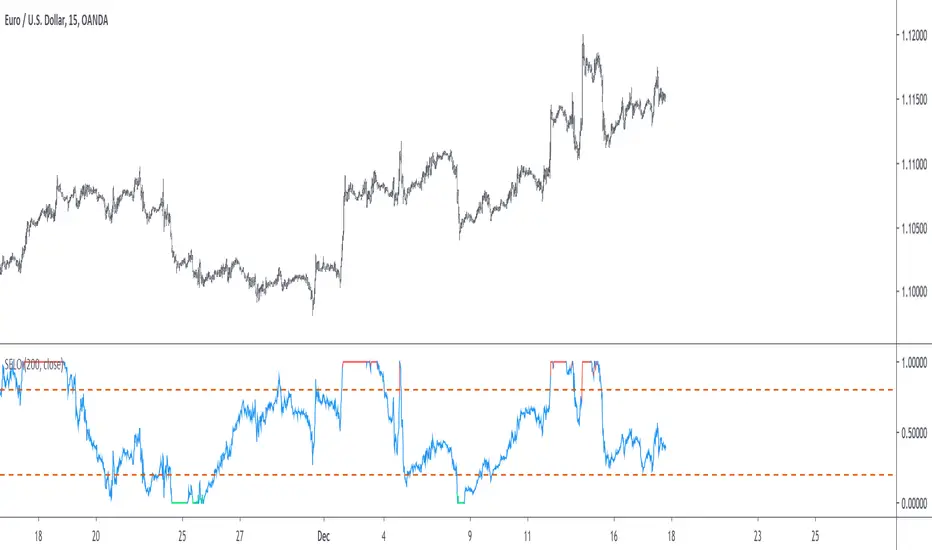
Stationary Extrapolated Levels OscillatorIntroduction
The oscillator version of the stationary extrapolated levels indicator. The methodology behind the extrapolated levels where to minimize the risk of making a decision based only on a forecast, therefore the indicator plotted levels in order to determine possible reversal points, signals where generated when the detrended series crossed over/under those levels.
The Indicator
First we detrend the price, this is because forecasting the trend is often harder than a series without trend (stationarity > non-stationarity) , then we forecast the detrended price with a linear extrapolation over a period of length and apply a max/min filter twice to the forecast, the max/min filters are just the highest and lowest function in pine. So the max/min filter have lag length/2 , by applying it two times we have a lag of length which is the period of the forecast. Because we use highest and lowest we can apply min-max normalization in the form of :
x' = (x - min(x, min'))/(max(x,max') - min(x, min'))
where x is the detrended price, max' the highest of the forecast of x and min' the lowest of the forecast of x . This result in a scaled oscillator in a range of (1,0),
When the indicator is equal to 1 or 0 there are high chances of reversals, more in depth this mean that the detrended price have crossed the highest/lowest of the forecast, when the indicator is equal to 0 or 1 for a long time this mean that the forecast was quite inaccurate, you can minimize risk by focusing on the cross between the detrended price and the 0.8/0.2 levels.
Conclusion
I've shown an oscillator version of my previous "Stationary extrapolated levels" indicator, the method involving taking the highest and lowest of the forecast is a great way to minimize the risk involved by time-series forecasting driven decisions. So i hope you find an use to it.
Thanks for reading !
Morphed Sine WaveIntroduction
If you rescale a sine wave to the price you will need to correlate it with it in order to show good results, today i present a different method that does not involve correlation to "morph" a sine wave to the price in order to provide forecast's and highlight market periodic patterns.
Parameters
length control the period of the sine wave, power control the "morphing" amount, if you see for example that the results are going nuts try to increase power , if the results are just the price and the delayed price try to decrease power .
power = 1
power = 100
Those settings might be different depending on which market you are in.
Various Uses
You can do a lot of things with this indicator, use filters as source :
Use the indicator as source for oscillators in order to create cycles indicators :
And certainly many more things
Conclusion
I presented a way to morph a sine wave to the price i order to highlight cycles. You can use any function that return a value between -1 and 1 instead of sin , this can be a scaled rsi/stochastic or correlation coefficient, its up to you :)
If you need help don't hesitate to commend or pm me. I hope you will like the indicator and that it will inspire you to make great things.
Thanks for reading !

[RS]ZigZag Percent Reversal(Multiple) - Forecast Areasnaive level forecasting of multiple zigzag's
based on this principle:
BB Forecast PrototypeExperiment to try apply @atrader2's MA Forecast () to bollinger bands - didn't exactly work out how I expected it to, especially with the Upper/Lower forecast projections.

Moving Averages & Bollinger Bands with ForecastsMoving Averages & Bollinger Bands with Forecasts
11 Moving Averages
SMA, EMA, WMA
Highly Customizable
Linear Regression Forecast
Bollonger Bands
Personal Setup: Add indicator twice
1st indicator = SMA using #4, 7, 10, 11 (20, 50, 100, 200 SMAs) with bollonger bands on 20.
2nd indicator = EMA using #1, 2, 3, 5, 6, 8, 9 (5, 8, 13, 21 ,34, 55, 89 EMAs).
This allows easy toggling between SMAs/Bolls and Fib EMAs
Thank you to yatrader2 for the forecast code