Futures Risk CalculatorFutures Risk Calculator Script - Description
The Futures Risk Calculator (FRC) is a comprehensive tool designed to help traders effectively manage risk when trading futures contracts. This script allows users to calculate risk/reward ratios directly on the chart by specifying their entry price and stop loss. It's an ideal tool for futures traders who want to quantify their potential losses and gains with precision, based on their trading account size and the number of contracts they trade.
What the Script Does:
1. Risk and Reward Calculation:
The script calculates your total risk in dollars and as a percentage of your account size based on the entry and stop-loss prices you input.
It also calculates two key levels where potential reward (Take Profit 1 and Take Profit 2) can be expected, helping you assess the reward-to-risk ratio for any trade.
2. Customizable Settings:
You can specify the size of your trading account (available $ for Futures trading) and the number of futures contracts you're trading. This allows for tailored risk management that reflects your exact trading conditions.
3. Live Chart Integration:
You add the script to your chart after opening a futures chart in TradingView. Simply click on the chart to set your Entry Price and Stop Loss. The script will instantly calculate and display the risk and reward levels based on the points you set.
Adjusting the entry and stop-loss points later is just as easy: drag and drop the levels directly on the chart, and the risk and reward calculations update automatically.
4. Futures Contract Support:
The script is pre-configured with a list of popular futures symbols (like ES, NQ, CL, GC, and more). If your preferred futures contract isn’t in the list, you can easily add it by modifying the script.
The script uses each symbol’s point value to ensure precise risk calculations, providing you with an accurate dollar risk and potential reward based on the specific contract you're trading.
How to Use the Script:
1. Apply the Script to a Futures Chart:
Open a futures contract chart in TradingView.
Add the Futures Risk Calculator (FRC) script as an indicator.
2. Set Entry and Stop Loss:
Upon applying the script, it will prompt you to select your entry price by clicking the chart where you plan to enter the market.
Next, click on the chart to set your stop-loss level.
The script will then calculate your total risk in dollars and as a percentage of your account size.
3. View Risk, Reward, and (Take Profit):
You can immediately see visual lines representing your entry, stop loss, and the calculated reward-to-risk ratio levels (Take Profit 1 and Take Profit 2).
If you want to adjust the entry or stop loss after plotting them, simply move the points on
the chart, and the script will recalculate everything for you.
4. Configure Account and Contracts:
In the script settings, you can enter your account size and adjust the number of contracts you are trading. These inputs allow the script to calculate risk in monetary terms and as a percentage, making it easier to manage your risk effectively.
5. Understand the Information in the Table:
Once you apply the script, a table will appear in the top-right corner of your chart, providing you with key information about your futures contract and the trade setup. Here's what each field represents:
Account Size: Displays your total account value, which you can set in the script's settings.
Future: Shows the selected futures symbol, along with key details such as its tick size and point value. This gives you a clear understanding of how much one point or tick is worth in dollar terms.
Entry Price: The exact price at which you plan to enter the trade, displayed in green.
Stop Loss Price: The price level where you plan to exit the trade if the market moves against you, shown in red.
Contracts: The number of futures contracts you are trading, which you can adjust in the settings.
Risk: Highlighted in orange, this field shows your total risk in dollars, as well as the percentage risk based on your account size. This is a crucial value to help you stay within your risk tolerance and manage your trades effectively.
Futures

QQQ and SPY Price Levels [MW]Introduction:
Don’t let SPY and QQQ resistance levels hurt your futures trading anymore. The QQQ and SPY Price Levels indicator automagically provides easily accessible QQQ price levels for NASDAQ-related charts such as QQQ, /NQ and /MNQ futures, and leveraged ETFs such as TQQQ and SQQQ as well as for SPY price levels for S&P 500-related charts such as SPY, /ES and /MES futures, SPX, and leveraged ETFs such as UPRO and SPXU. If you’ve ever traded futures, or anything QQQ- or SPY-related and wanted to know at what price would the corresponding asset reach a key whole number level of QQQ or SPY, like 400, 440, 445, or even 447.50, this tool is for you. Key 10x, 5x, and even 2.5x multiples of QQQ and SPY can act as support or resistance for other related-assets. Until now, there hasn’t been an indicator that can serve as an easy visual cue to know exactly when that is about to happen across assets.
This indicator is a fork of the original SPY Price Levels indicator, which only considered SPY-related assets.
Settings:
QQQ/SPY 2.5x: Show closest levels above and below that are multiples of 2.5 on QQQ
QQQ/SPY 5x: Show closest levels above and below that are multiples of 5 on QQQ
QQQ/SPY 10x: Show closest levels above and below that are multiples of 10 on QQQ
Show QQQ/SPY Price Label: Show the current QQQ/SPY price
Extend lines to the left: Extend label lines for each price level to the beginning of the chart
Calculations:
This indicator defines the ratio between the price of QQQ/SPY and another NASDAQ/S&P-related asset and uses that multiplier once the user-defined price increments are defined. For example, if /MNQ is at 19000 and QQQ is at 465, then the ratio would be 40.8.
The incremental QQQ levels that are above and below the QQQ price are calculated using the following equations:
qqqLevelUp = _multiplier * math.ceil(_qqqClose / _multiplier)
qqqLevelDown = _multiplier * math.floor(_qqqClose / _multiplier)
The conversion ratio is then multiplied by that amount to get the final estimated corresponding price using the calculation:
levelUp := _conversion * qqqLevelUp
levelDown := _conversion * qqqLevelDown
For leveraged assets, the conversion must be used on the difference between the current QQQ price and the incremental upper and lower levels.
For example, the calculation for the next level up looks like the following:
levelUpDelta := math.abs(_qqqClose - qqqLevelUp)
levelUp := close + _conversion * (levelUpDelta * _leverage)
This logic is identical for SPY-related assets.
How to Use:
The QQQ and SPY Price Levels indicator aims to be as unobtrusive as possible. The default view shows 3 labels and 2 lines that are all aligned to the right of the main chart, so that it interferes as little as possible with any other indicators. It can be added to any /NQ or /MNQ futures chart, SQQQ, TQQQ, and, of course, QQQ as well as any /ES /MES futures chart, SPXU, UPRO, SPX, and of course SPY. The most immediate price levels for each multiplier appears above and below the current price along with the price of QQQ/SPY.
For example, MNQU2024 is currently at 19594. By looking at the indicator the next QQQ increment below is at 475, or 19556 on the MNQU2024 chart. This potential support is marked with a green label that shows both prices. The next increment above is at QQQ 477.50, or 19659 on the MESU2024 chart. And the QQQ price itself, is also shown (and can be removed) at 475.92.
QQQ and SPY price increments of 2.5, 5, and 10 tend to consistently act at the very least as emotional support and resistance levels. Weak, or weakening volume and/or momentum when these levels are hit can trigger a strong rejection, and can sometimes precipitate lengthy consolidation periods at those levels. Watching an NASDAQ- and S&P 500-related asset come to a halt, fall off a cliff, or react in some other unintuitive way could very well be the result of a QQQ/SPY level being reached. Even though many of us know that this relationship exists, it’s easy to forget. So, this indicator helps to ensure that its users keep that relationship front and center.
By extending the lines into the past on QQQ/SPY and their related assets, you can see what reactions happened at these key levels.
Other Usage Notes and Limitations:
The calculations used only provide an estimated relationship or a close approximation, and are not exact.
It's important for traders to be aware of the limitations of any indicator and to use them as part of a broader, well-rounded trading strategy that includes risk management, fundamental analysis, and other tools that can help with reducing false signals, determining trend direction, and providing additional confirmation for a trade decision. Diversifying strategies and not relying solely on one type of indicator or analysis can help mitigate some of these risks.

Key Times & Opening Prices [Olitrades]This indicator plots key time's (opening prices) with the possibility of vertical separators. It was initially created to utilize on the indices futures market, utilizing ICT logic.
These opening prices are often utilized to determine if price is currently at a premium or a discounted value.
The default times include:
Daily Open (18:00 PM)
Midnight (00:00 AM)
Settlement (15:00 PM)
7:30 AM
8:30 AM
9:30 AM (Equities Open)
10:00 AM (Morning 4h Candle Open)
14:00 PM (Afternoon 4h Candle Open)
Along with up to three custom time slots.
All times used in the indicator are Eastern Standard time (New York local time) and will automatically adjust no matter your time zone.
Historical
When in historical mode, the indicator will keep the previous levels so you can easily visualize them and their relation to price.
You can also choose how many past levels you want to see. This allows you to back test only specific days/weeks.
Other Inputs
The indicator contains an adjustable offset, to modify how far the line extends depending on the current timeframe.
Each one of the above-mentioned levels can be turned on and off, including the custom times. You can also choose between plotting just the opening price, a vertical line separator, or both! All of these lines have adjustable styles (dotted, dashed or solid) and width.
They also have custom cut offs. You may choose specific cut off times for custom time slots (when to stop extending the lines), as well as for AM (before noon) default levels and PM (after noon) default levels.
The indicator also allows to show text labels next to these lines, which is set by default but can be turned off. Custom times also include custom text options.

SessionLibrary "Session"
Helper functions for trading sessions. TradingView doesn't provide correct data when
calling some of the convenience methods like session.ismarket when you are looking at futures charts. This library corrects those mistakes by providing functions with the same names as the TradingView default properties. that reference a custom defined set of session hours for futures. It also provides a way for consumers to customize the map values by calling getSessionMap() and then overwriting (or adding) custom session definitions.
getSessionMap()
Returns a map of the futures rth & eth session hours. The map is keyed with symbol:session format (eg. ES:market or ES:overnight).
Returns: A map of futures symbols and their associated session hours.
getSessionString(session, symbol, sessionMap)
Returns a session string representing the session hours (and days) for the requested symbol (or the chart's symbol if the symbol value is not provided). If the session string is not found in the collection, it will return a blank string.
Parameters:
session (string) : A string representing the session hour being requested. One of: market (regular trading hours), overnight (extended/electronic trading hours), postmarket (after-hours), premarket
symbol (string) : The symbol to check. Optional. Defaults to chart symbol.
sessionMap (map) : The map of futures session hours. Optional. Uses default if not provided.
inSession(session, sessionMap, barsBack)
Returns true if the current symbol is currently in the session parameters defined by sessionString.
Parameters:
session (string) : A string representing the session hour being requested. One of: market (regular trading hours), overnight (extended/electronic trading hours), postmarket (after-hours), premarket
sessionMap (map) : The map of futures session hours. Optional. Uses default if not provided.
barsBack (int) : Private. Only used by futures to check islastbar. Optional. The default is 0.
ismarket(sessionMap)
Returns true if the current bar is a part of the regular trading hours (i.e. market hours), false otherwise. Works for futures (TradingView's methods do not).
Parameters:
sessionMap (map) : The map of futures session hours. Optional. Uses default if not provided.
Returns: bool
isfirstbar()
Returns true if the current bar is the first bar of the day's session, false otherwise. If extended session information is used, only returns true on the first bar of the pre-market bars. Works for futures (TradingView's methods do not).
Returns: bool
islastbar()
Returns true if the current bar is the last bar of the day's session, false otherwise. If extended session information is used, only returns true on the last bar of the post-market bars. Works for futures (TradingView's methods do not).
Returns: bool
ispremarket(sessionMap)
Returns true if the current bar is a part of the pre-market, false otherwise. On non-intraday charts always returns false. Works for futures (TradingView's methods do not).
Parameters:
sessionMap (map) : The map of futures session hours. Optional. Uses default if not provided.
Returns: bool
ispostmarket(sessionMap)
Returns true if the current bar is a part of the post-market, false otherwise. On non-intraday charts always returns false. Works for futures (TradingView's methods do not).
Parameters:
sessionMap (map) : The map of futures session hours. Optional. Uses default if not provided.
Returns: bool
isfirstbar_regular(sessionMap)
Returns true on the first regular session bar of the day, false otherwise. The result is the same whether extended session information is used or not. Works for futures (TradingView's methods do not).
Parameters:
sessionMap (map) : The map of futures session hours. Optional. Uses default if not provided.
Returns: bool
islastbar_regular(sessionMap)
Returns true on the last regular session bar of the day, false otherwise. The result is the same whether extended session information is used or not. Works for futures (TradingView's methods do not).
Parameters:
sessionMap (map) : The map of futures session hours. Optional. Uses default if not provided.
Returns: bool
isovernight(sessionMap)
Returns true if the current bar is a part of the pre-market or post-market, false otherwise. On non-intraday charts always returns false.
Parameters:
sessionMap (map) : The map of futures session hours. Optional. Uses default if not provided.
Returns: bool
getSessionHighAndLow(session, sessionMap)
Returns a tuple containing the high and low print during the specified session.
Parameters:
session (string) : The session for which to get the high & low prints. Defaults to market.
sessionMap (map) : The map of futures session hours. Optional. Uses default if not provided.
Returns: A tuple containing

whookLibrary "whook"
This library provides functions for generating trading alerts for `whook`
check this -> github.com
Currently supported exchanges:
Kucoin futures
Bitget futures
Coinex futures
Bingx
OKX futures ( also its demo mode )
Bybit futures ( also Bybit testnet )
Binance futures ( also Binance futures testnet )
Phemex futures ( also Phemex testnet )
Kraken futures ( also Kraken futures testnet )
# --- Test Cases ---
Note: These test cases are for demonstration purposes only and may not cover all scenarios.
// buy(string account, float amount, string unit = "units", float leverage = 1)
buy("MyAccount", 100, "units", 1)
buy("MyAccount", 1000, "USDT", 5)
buy("MyAccount", 50, "percent", 2)
// sell(string account, float amount, string unit = "units", float leverage = 1)
sell("MyAccount", 50, "units", 1)
sell("MyAccount", 500, "USDT", 3)
sell("MyAccount", 25, "percent", 2)
// set_position(string account, float amount, string unit = "units", float leverage = 1)
set_position("MyAccount", 100, "units", 1)
set_position("MyAccount", 1000, "USDT", 5)
set_position("MyAccount", 50, "percent", 2)
// limit_buy(string account, float amount, float price, string unit = "units", float leverage = 1, string id = "")
limit_buy("MyAccount", 100, 10000, "units", 1, "MyBuyOrder")
limit_buy("MyAccount", 1000, 10500, "USDT", 5)
limit_buy("MyAccount", 50, 11000, "percent", 2)
// limit_sell(string account, float amount, float price, string unit = "units", float leverage = 1, string id = "")
limit_sell("MyAccount", 50, 10000, "units", 1, "MySellOrder")
limit_sell("MyAccount", 500, 9500, "USDT", 3)
limit_sell("MyAccount", 25, 9000, "percent", 2)
// close_percent(string account, float pct = 100)
close_percent("MyAccount", 100)
close_percent("MyAccount", 50)
buy(account, amount, unit, leverage)
Sends a trading alert to execute a market buy order.
Parameters:
account (string) : The account ID.
amount (float) : The amount to buy (can be in USD, units, or percentage).
unit (string) : The unit of the amount (optional, defaults to "units").
leverage (float) : The leverage to use (optional, defaults to 1x).
sell(account, amount, unit, leverage)
Sends a trading alert to execute a market sell order.
Parameters:
account (string) : The account ID.
amount (float) : The amount to sell (can be in USD, units, or percentage).
unit (string) : The unit of the amount (optional, defaults to "units").
leverage (float) : The leverage to use (optional, defaults to 1x).
set_position(account, amount, unit, leverage)
Sends a trading alert to set a position.
Parameters:
account (string) : The account ID.
amount (float) : The amount to set the position to (can be in USD, units, or percentage).
unit (string) : The unit of the amount (optional, defaults to "units").
leverage (float) : The leverage to use (optional, defaults to 1x).
limit_buy(account, amount, price, unit, leverage, id)
Sends a trading alert to place a limit buy order.
Parameters:
account (string) : The account ID.
amount (float) : The amount to buy (can be in USD, units, or percentage).
price (float) : The limit price.
unit (string) : The unit of the amount (optional, defaults to "units").
leverage (float) : The leverage to use (optional, defaults to 1x).
id (string) : An optional custom ID for the limit order.
limit_sell(account, amount, price, unit, leverage, id)
Sends a trading alert to place a limit sell order.
Parameters:
account (string) : The account ID.
amount (float) : The amount to sell (can be in USD, units, or percentage).
price (float) : The limit price.
unit (string) : The unit of the amount (optional, defaults to "units").
leverage (float) : The leverage to use (optional, defaults to 1x).
id (string) : An optional custom ID for the limit order.
close_percent(account, pct)
Sends an alert to close a position on Phemex.
Parameters:
account (string) : The account ID.
pct (float) : The percentage of the position to close (optional, defaults to 100%).
Futures Settlement [NeoButane]Traders use settlement prices as both support/resistance and as a target for price to trend towards. The intention of this script is to provide possible entry and exit levels for swing and scalp trades by drawing horizontal lines of true settlement prices provided by TradingView.
The settlement price, which is calculated daily, is used to determine the profit/loss of a trader's futures position. Prior to the daily close, price settlement of futures contracts is performed by taking the average of its traded price during a specified period of time.
Usage
The settlement prices, shown as horizontal lines, serve as support or resistance for entry or exit. There are hundreds of ways to combine this with favorite indicators, or it can be used as levels for pure price action traders.
See how settlement price levels can be used in confluence with oscillators.
Configuration
Toggles to show each settlement. Reprint shows prior weeks or months after they've ended. Back-adjusted futures, which affect expired futures price history on continuous futures charts, should only be enabled on non-standard charts to match the user's chart settings.
What this script does
This script plots the daily, weekly, and monthly settlements for futures, including an average for the two most recent weekly or monthly settlements. The weekly settlement uses the last day of the week's daily settlement and the monthly settlement uses the last day of the month's daily settlement. For symbols that do not have settlement prices, which will be almost if not all symbols that are not futures, the settlement price instead becomes price at the last second before the daily/weekly/monthly close. In those cases, this script becomes a tool for automatically plotting daily/weekly/monthly closes.
See below for two different bitcoin charts. The chart on top is a non-futures chart and a futures chart is at the bottom. Note that CME bitcoin futures settle 4 hours (1500 CST) before bitcoin's daily close (UTC).
How this script works
TradingView has a built-in ability to display daily settlements instead of the actual daily close. This can be enabled in chart settings for futures on the daily timeframe and there is an argument for Pine Script to do so as well. Because settlement times are different for multiple products during the day, the script uses the settlement price from daily timeframe, which is guaranteed to be correct because TradingView is wonderful. I accidentally found the undocumented backadjustment and settlement_at_close when I was trying to use ticker.inherit() to create a symbol with its daily close time changed to another symbol's, which I still haven't figured out. TradingView has since added documentation for both of them, but there's still an ambiguous 'etc.' in the description of ticker.inherit() so maybe there's more secret arguments...
The script is able to be used on non-standard charts by using ticker.standard(), but back-adjustment will need to be changed by input to match chart settings.
References
Investopedia explanation of settlement price.
www.investopedia.com
Settlement prices for ES.
www.cmegroup.com
CME summary of settlement price.
www.cmegroup.com
How to enable settlement price as close for daily intervals in TradingView. This does not affect the use of this script.
www.tradingview.com
About back-adjustment for continuous futures charts in TradingView.
www.tradingview.com

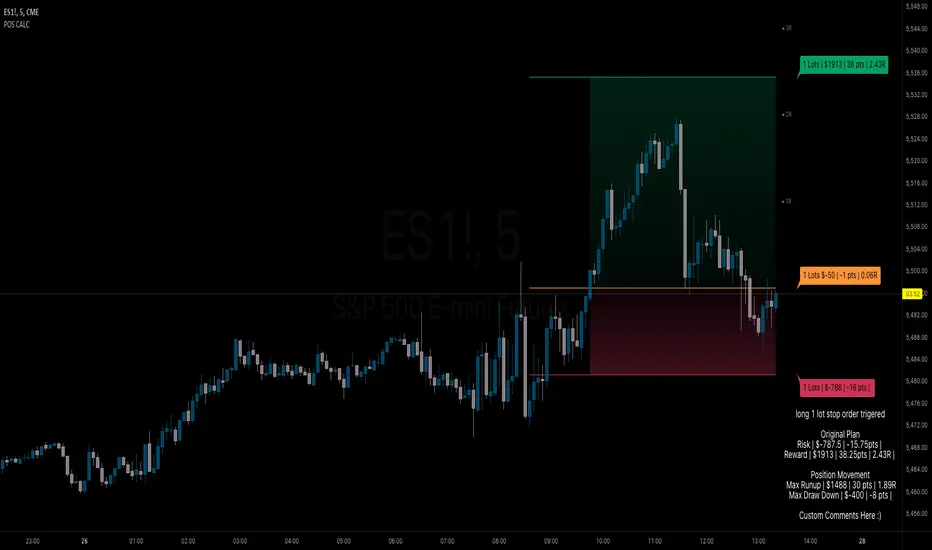
BB Position CalculatorPosition Size Calculator Instructions
Overview
The Position Size Calculator is designed to help traders automatically determine the appropriate lot size based on the dollar amount they are willing to risk. It includes features for automatic lot sizing, fixed lot risk calculations, take profit calculations (both automatic and fixed), max run-up, and max drawdown. Calculated values are displayed in ticks, points, and USD.
Key Features
• Automatic Lot Sizing: Automatically calculates lot size based on the amount of money you are willing to risk.
• Fixed Lot Risk Calculations: Provides risk calculations for fixed lot sizes.
• Take Profit Calculations: Offers both automatic and fixed take profit calculations.
• Max Run-Up and Max Drawdown: Monitors and displays the maximum run-up and drawdown of your trade.
• Detailed Metrics: Displays all calculated values in ticks, points, and USD.
Setup Instructions
1. Add and Remove for Each Position: The calculator is designed to be added to your chart for each new position. Once your preferences are set the first time, save them as your default to retain your settings for future use.
2. Adding the Indicator to Favorites:
• Use the TradingView keyboard shortcut “/” then type “pos.”
• Use the arrow key to select the Position Size Calculator and press enter.
• Close the indicator selection pop-up.
3. Setting the Trigger Price:
• A blue pop-up labeled “SET TRIGGER PRICE” will appear at the bottom of the chart.
• Click on the chart at the price level where you want to enter the trade.
4. Setting the Stop Loss:
• The pop-up will change to “SET STOP LOSS.”
• Click on the chart at the price level where your stop loss will be set.
5. Setting the Take Profit:
• The pop-up will change to “SET TAKE PROFIT.”
• Click on the chart at the price level where you want to take profit. If you have selected the option to overwrite with a set risk/reward ratio (R:R), the calculation will use this price level.
6. Setting the Trade Window Start:
• The pop-up will change to “SET TRADE WINDOW START.”
• Click on the bar in time where you want the indicator to start monitoring for price to trigger the position.
7. Adjusting the Position:
• Clicking on any part of the indicator will display draggable lines, allowing you to fine-tune the position that was previously plotted by the first four chart clicks.
Additional Notes
• Compatibility: This calculator has only been tested with futures trading.
• Customization: Once your preferences are set, save them as your default to make setup quicker for future trades.
• Support: If you have any questions or feature requests, please feel free to reach out.
strategy_helpersThis library is designed to aid traders and developers in calculating risk metrics efficiently across different asset types like equities, futures, and forex. It includes comprehensive functions that calculate the number of units or contracts to trade, the value at risk, and the total value of the position based on provided entry prices, stop levels, and risk percentages. Whether you're managing a portfolio or developing trading strategies, this library provides essential tools for risk management. Functions also automatically select the appropriate risk calculation method based on asset type, calculate leverage levels, and determine potential liquidation points for leveraged positions. Perfect for enhancing the precision and effectiveness of your trading strategies.
Library "strategy_helpers"
Provides tools for calculating risk metrics across different types of trading strategies including equities, futures, and forex. Functions allow for precise control over risk management by calculating the number of units or contracts to trade, the value at risk, and the total position value based on entry prices, stop levels, and desired risk percentage. Additional utilities include automatic risk calculation based on asset type, leverage level calculations, and determination of liquidation levels for leveraged trades.
calculate_risk(entry, stop_level, stop_range, capital, risk_percent, trade_direction, whole_number_buy)
Calculates risk metrics for equity trades based on entry, stop level, and risk percent
Parameters:
entry (float) : The price at which the position is entered. Use close if you arent adding to a position. Use the original entry price if you are adding to a position.
stop_level (float) : The price level where the stop loss is placed
stop_range (float) : The price range from entry to stop level
capital (float) : The total capital available for trading
risk_percent (float) : The percentage of capital risked on the trade. 100% is represented by 100.
trade_direction (bool) : True for long trades, false for short trades
whole_number_buy (bool) : True to adjust the quantity to whole numbers
Returns: A tuple containing the number of units to trade, the value at risk, and the total value of the position:
calculate_risk_futures(risk_capital, stop_range)
Calculates risk metrics for futures trades based on the risk capital and stop range
Parameters:
risk_capital (float) : The capital allocated for the trade
stop_range (float) : The price range from entry to stop level
Returns: A tuple containing the number of contracts to trade, the value at risk, and the total value of the position:
calculate_risk_forex(entry, stop_level, stop_range, capital, risk_percent, trade_direction)
Calculates risk metrics for forex trades based on entry, stop level, and risk percent
Parameters:
entry (float) : The price at which the position is entered. Use close if you arent adding to a position. Use the original entry price if you are adding to a position.
stop_level (float) : The price level where the stop loss is placed
stop_range (float) : The price range from entry to stop level
capital (float) : The total capital available for trading
risk_percent (float) : The percentage of capital risked on the trade. 100% is represented by 100.
trade_direction (bool) : True for long trades, false for short trades
Returns: A tuple containing the number of lots to trade, the value at risk, and the total value of the position:
calculate_risk_auto(entry, stop_level, stop_range, capital, risk_percent, trade_direction, whole_number_buy)
Automatically selects the risk calculation method based on the asset type and calculates risk metrics
Parameters:
entry (float) : The price at which the position is entered. Use close if you arent adding to a position. Use the original entry price if you are adding to a position.
stop_level (float) : The price level where the stop loss is placed
stop_range (float) : The price range from entry to stop level
capital (float) : The total capital available for trading
risk_percent (float) : The percentage of capital risked on the trade. 100% is represented by 100.
trade_direction (bool) : True for long trades, false for short trades
whole_number_buy (bool) : True to adjust the quantity to whole numbers, applicable only for non-futures and non-forex trades
Returns: A tuple containing the number of units or contracts to trade, the value at risk, and the total value of the position:
leverage_level(account_equity, position_value)
Calculates the leverage level used based on account equity and position value
Parameters:
account_equity (float) : Total equity in the trading account
position_value (float) : Total value of the position taken
Returns: The leverage level used in the trade
calculate_liquidation_level(entry, leverage, trade_direction, maintenance_margine)
Calculates the liquidation price level for a leveraged trade
Parameters:
entry (float) : The price at which the position is entered
leverage (float) : The leverage level used in the trade
trade_direction (bool) : True for long trades, false for short trades
maintenance_margine (float) : The maintenance margin requirement, expressed as a percentage
Returns: The price level at which the position would be liquidated, or na if leverage is zero

Captain Backtest Model [TFO]Created by @imjesstwoone and @mickey1984, this trade model attempts to capture the expansion from the 10:00-14:00 EST 4h candle using just 3 simple steps. All of the information presented in this description has been outlined by its creators, all I did was translate it to Pine Script. All core settings of the trade model may be edited so that users can test several variations, however this description will cover its default, intended behavior using NQ 5m as an example.
Step 1 is to identify our Price Range. In this case, we are concerned with the highest high and the lowest low created from 6:00-10:00 EST.
Step 2 is to wait for either the high or low of said range to be taken out. Whichever side gets taken first determines the long/short bias for the remainder of the Trade Window (i.e. if price takes the range high, bias is long, and vice versa). Bias must be determined by 11:15 EST, otherwise no trades will be taken. This filter is intended to weed out "choppy" trading days.
Step 3 is to wait for a retracement and enter with a close through the previous candle's high (if long biased) or low (if short biased). There are a couple toggleable criteria that we use to define a retracement; one is checking for opposite close candles that indicate a pullback; another is checking if price took the previous candle's low (if long biased) or high (if short biased).
This trade model was initially tested for index futures, particularly ES and NQ, using a 5m chart, however this indicator allows us to backtest any symbol on any timeframe. Creators @imjesstwoone and @mickey1984 specified a 5 point stop loss on ES and a 25 point stop loss on NQ with their testing.
I've personally found some success in backtesting NQ 5m using a 25 point stop loss and 75 point profit target (3:1 R). Enabling the Use Fixed R:R parameter will ensure that these stops and targets are utilized, otherwise it will enter and hold the position until the close of the Trade Window.

Bull Flag DetectionThe FuturesGod bull flag indicator aims to identify the occurrence of bull flags.
Bull flags are a popular trading pattern that allows users to gauge long entries into a given market. Flags consist of a pole that is followed by either a downward or sideways consolidation period.
This script can be used on any market but was intended for futures (NQ, ES) trading on the intraday timeframe.
The script does the following:
1. Identifies the occurrence of a flag pole. This is based on a lookback period and percentage threshold decided by the user.
2. Marks the consolidation area after the pole occurrence using swing highs and swing lows.
3. Visually the above is represented by a shaded green area.
4. When a pole is detected, it is marked by a downward off-white triangle. Note that if the percentage threshold is reached several times on the same upward climb, the script will continue to identify points where the threshold for pole detection is met.
5. Also visualized are the 20, 50 and 200 period exponential moving averages. The area between the 20 and 50 EMAs are shaded to provide traders a visual of a possible support area.

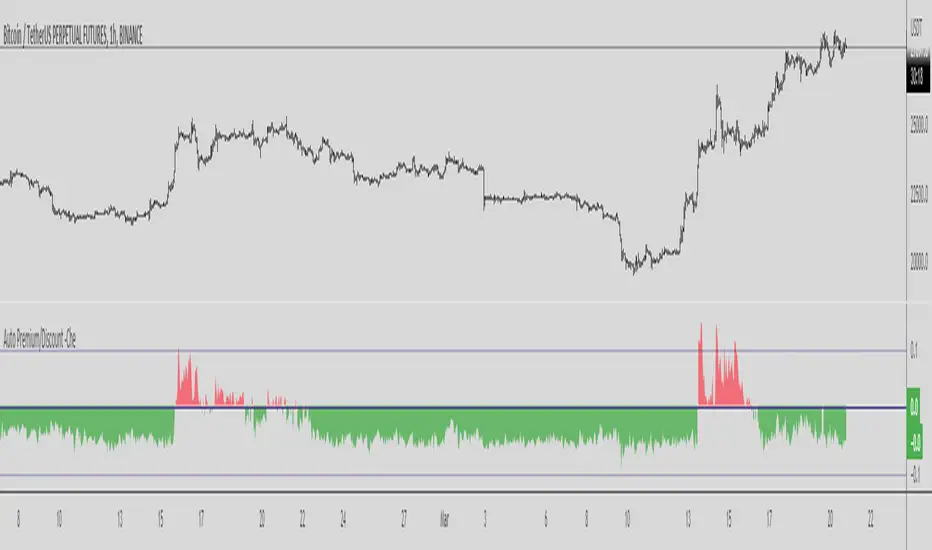
Crypto Spot/Futures Dominance Indicator with AlertsFutures/Spot Dominance Indicator:
Overview:
The futures/spot dominance indicator is a versatile tool used by traders and analysts to assess the relative strength or dominance of the futures market in relation to the spot (or cash) market for a specific asset. It offers insights into market sentiment, potential arbitrage opportunities, and risk management while incorporating the VWAP indicator for added context.
How It Works:
This indicator automatically detects and adapts to the futures symbol applied to the chart, simplifying the setup for traders. However, it still necessitates manual input of the corresponding spot pair to ensure accuracy.
Automatic Futures Symbol Detection: The indicator starts by automatically detecting the futures symbol on the trading chart, eliminating the need for manual configuration. This ensures that the indicator is applied to the correct futures contract.
Manual Spot Pair Entry: To provide a reliable reference point for the comparison, traders must manually input the corresponding spot symbol via the indicator's inputs. For instance, if the indicator detects the BTCUSDT.P futures symbol, traders would manually enter the BTCUSDT spot symbol.
Gathering Data: The indicator collects historical price data for both the detected futures contract and the manually specified spot symbol. This data includes open, high, low, and close prices, as well as trading volume.
VWAP Calculation: To gain a deeper understanding of price trends and market dynamics, the indicator calculates the VWAP (Volume Weighted Average Price) for both the futures and spot markets. The VWAP places more weight on prices with higher trading volume, offering a weighted average that reflects market consensus.
Premium/Discount Calculation: By subtracting the VWAP of the spot market from the VWAP of the futures market, the indicator quantifies the premium or discount of the futures price concerning the spot price. A positive value indicates a premium, while a negative value suggests a discount.
Plotting: The premium/discount value is displayed as a line on the chart, often alongside moving averages or other smoothing techniques for improved trend analysis.
Alerts: In addition to its analysis capabilities, this indicator now includes alerts to enhance your trading experience. It alerts you in the following scenarios:
Premium Above Average: Notifies you when the premium crosses above the average line.
Premium Below Average: Alerts you when the premium crosses below the average line.
Premium Above Zero: Provides an alert when the premium crosses above the zero line.
Premium Below Zero: Generates an alert when the premium crosses below the zero line.
Benefits of the Futures/Spot Dominance Indicator:
Sentiment Analysis: Traders use the indicator to assess market sentiment. A futures premium might signify bullish sentiment, while a discount could indicate bearish sentiment.
Arbitrage Opportunities: Identifying price discrepancies between futures and spot markets can help traders spot arbitrage opportunities, where they can profit from price differentials.
Risk Management: The indicator assists in evaluating risks associated with futures positions, helping traders manage their exposure effectively.
Trend Confirmation: When used in conjunction with other technical indicators, futures/spot dominance, along with VWAP, can provide additional confirmation of price trends.
Hedging: Investors and corporations use this tool to gauge the effectiveness of hedging strategies based on futures contracts.
Speculative Trading: Traders and investors use the indicator to inform speculative positions, aligning their trades with perceived market strength or weakness.
Insightful Analysis: Futures/spot dominance analysis, enriched by VWAP data, offers insights into market behavior during specific events or changes in economic conditions.
In summary, the futures/spot dominance indicator, with its integration of VWAP and automatic futures symbol detection, provides traders and investors with a comprehensive tool to assess market dynamics. It aids in sentiment analysis, risk management, and trend confirmation while offering potential arbitrage opportunities. The newly added alerts enhance the indicator's functionality, providing timely notifications of key market events. However, it relies on manual input of the corresponding spot pair to ensure precise comparisons between futures and spot markets. It should be used alongside other analysis techniques for a well-rounded view of the market.

TASC 2023.10 COT Commercials Indicator█ OVERVIEW
This script implements the COT Commercials Indicator introduced by Alfred François Tagher in an article featured in TASC's October 2023 edition of Traders' Tips . The indicator is designed for use in futures markets and represents a fast stochastic (%K) calculated based on the commercial open interest values of an asset derived from the weekly Commitments Of Traders (COT) report .
█ CONCEPTS
The COT report, issued by the Commodity Futures Trading Commission (CFTC) , presents a breakdown of reportable open interest positions held by various trader groups—commercial, noncommercial, and nonreportable (small traders). Open interest reflects the total number of derivative contracts entered by market participants but not yet settled. Consequently, it can serve as a measure of market activity and liquidity.
The indicator showcased here aims to analyze changes in the reported net values of open interest for commercial traders/hedgers (often referred to as 'smart money', as they deal directly in underlying commodities). The net values are positive when the commercial traders have more long positions than short ones and negative when they hold more short positions than long ones. Positive net values indicate that commercial traders hold more long positions than short ones, while negative values indicate the opposite. Thus, overbought and oversold conditions of the COT Commercials Indicator potentially suggest collective bullish and bearish sentiments, respectively.
█ CALCULATIONS
The calculations involve these steps:
1. Net open interest values are extracted from COT data using the LibraryCOT library provided by TradingView.
2. A fast stochastic indicator (%K) is then applied to normalize these net values.
The script also provides an option of calculating and plotting the indicator curve for noncommercial (speculators) open interest.

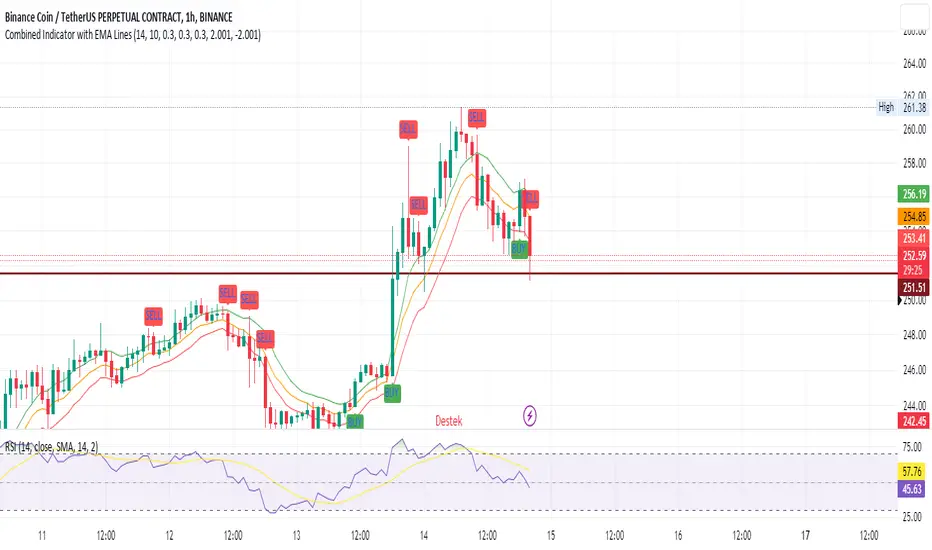
SEC-Combined Indicator with EMA LinesTitle: Combined Indicator with EMA Lines
Description:
The Combined Indicator with EMA Lines is a technical analysis tool that combines multiple indicators to provide insights into the market's strength and potential buying or selling opportunities. It incorporates the Relative Strength Index (RSI), Exponential Moving Average (EMA) lines, and the trend over the past three days to generate signals.
The indicator calculates a combined data value by assigning weights to the RSI, EMA, and past trend. The RSI measures the strength of price movements, while the EMA lines provide an indication of the average price over a specific period. The past trend considers the price behavior over the last three days. By combining these factors, the indicator offers a comprehensive view of market conditions.
Buy and sell signals are generated based on the change in the combined data. A buy signal occurs when there is an increase in the combined data above a specified threshold, indicating a potential buying opportunity. Conversely, a sell signal is triggered when there is a decrease in the combined data below a specified threshold, suggesting a potential selling opportunity.
The indicator also plots the EMA lines, which include the EMA High, EMA Average, and EMA Low. These lines provide additional visual cues about the price trend and potential support and resistance levels.
Traders can use the Combined Indicator with EMA Lines to identify potential entry and exit points in the market. It helps in capturing trends, evaluating price strength, and making informed trading decisions. The buy and sell signals, along with the EMA lines, aid in spotting potential reversals, confirming trends, and managing risk.
It's important to note that this indicator should be used in conjunction with other analysis techniques and risk management strategies. Traders should consider combining it with additional indicators, chart patterns, and fundamental analysis to enhance their trading decisions.
Remember to backtest and validate the indicator's performance using historical data before using it in real-time trading. Adjust the input parameters, such as RSI period, EMA period, and threshold values, to suit your trading style and market conditions.
Annualized Spot-Future DifferenceThe "Annualized Spot-Future Difference" indicator (ASFD) compares the closing prices of a futures contract and its underlying spot asset. It calculates the price difference between the two instruments and annualizes this difference to provide a standardized measure for comparison.
The indicator takes inputs for the futures ticker symbol and the spot ticker symbol, allowing flexibility in selecting the specific assets for analysis. Additionally, it allows the user to input the contract date, which represents the expiration date of the futures contract.
The ASFD indicator plots the annualized difference between the futures and spot prices. It calculates the price difference by subtracting the spot price from the futures price. To annualize this difference, it considers the remaining days to the contract expiration and scales the difference accordingly.
The annualized difference can provide insights into market expectations, as it reflects the market's perception of the future price movement of the underlying asset. A positive value indicates that the futures price is higher than the spot price, potentially suggesting bullish sentiment. Conversely, a negative value suggests bearish sentiment, with the futures price lower than the spot price.
Traders and analysts can utilize the ASFD indicator to identify potential opportunities for arbitrage or evaluate market sentiment regarding the underlying asset. By monitoring changes in the annualized difference over time, they can gain insights into market dynamics and make informed trading decisions.
It's important to note that the ASFD indicator relies on accurate and up-to-date pricing data for both the futures and spot assets. Traders should verify that the selected ticker symbols correspond to the desired instruments and ensure that the contract date aligns with the relevant futures contract expiration.
Overall, the ASFD indicator provides a quantitative measure of the annualized price difference between futures and spot assets, enabling traders and analysts to assess market expectations and identify potential trading opportunities.

4H RangeThis script visualizes certain key values based on a 4-hour timeframe of the selected market on the chart. These values include the High, Mid, and Low price levels during each 4-hour period.
These levels can be helpful to identify inside range price action, chop, and consolidation. They can sometimes act as pivots and can be a great reference for potential entries and exits if price continues to hold the same range.
Here's a step-by-step overview of what this indicator does:
1. Inputs: At the beginning of the script, users are allowed to customize some inputs:
Choose the color of lines and labels.
Decide whether to show labels on the chart.
Choose the size of labels ("tiny", "small", "normal", or "large").
Choose whether to display price values in labels.
Set the number of bars to offset the labels to the right.
Set a threshold for the number of ticks that triggers a new calculation of high, mid, and low values.
* Tick settings may need to be increased on equity charts as one tick is usually equal to one cent.
For example, if you want to clear the range when there is a close one point/one dollar above or below the range high/low then on ES
that would be 4 ticks but one whole point on AAPL would be 100 ticks. 100 ticks on an equity chart may or may not be ideal due to
different % change of 100 ticks might be too excessive depending on the price per share.
So be aware that user preferred thresholds can vary greatly depending on which chart you're using.
2. Retrieving Price Data: The script retrieves the high, low, and closing price for every 4-hour period for the current market.
The script also calculates the mid-price of each 4-hour period (the average of the high and low prices).
3. Line Drawing: At the start of the script (first run), it draws three lines (high, mid, and low) at the levels corresponding to the high,
mid, and low prices. Users can also change transparency settings on historical lines to view them. Default setting for historical lines
is for them to be hidden.
4. Updating Lines and Labels: For each subsequent 4-hour period, the script checks whether the close price of the period has gone
beyond a certain threshold (set by user input) above the previous high or below the previous low. If it has, the script deletes the
previous lines and labels, draws new lines at the new high, mid, and low levels, and creates new labels (if the user has opted to
show labels).
5. Displaying Values in the Data Window: In addition to the visual representation on the chart, the script also plots the high, mid, and
low prices. These plotted values appear in the Data Window of TradingView, allowing users to see the exact price levels even when
they're not directly labeled on the chart.
6. Updating Lines and Labels Position: At the end of each period, the script moves the lines and labels (if they're shown) to the right,
keeping them aligned with the current period.
Please note: This script operates based on a 4-hour timeframe, regardless of the timeframe selected on the chart. If a shorter timeframe is selected on the chart, the lines and labels will appear to extend across multiple bars because they represent 4-hour price levels. If a longer timeframe is selected, the lines and labels may not accurately represent high, mid, and low levels within that longer timeframe.

SPX ES SpreadA very simple indicator to display the spread between ES and SPX. The table by default displays in the upper right corner of the chart. If you are on the chart for SPX, it will show the current price of ES, as well as the difference in points between the two. Similarly, if on the chart for ES, it will show the price for SPX as well as the difference in points between the two. The table does not appear at all if the chart symbol is anything other than ES or SPX. The specific symbols used can be defined by the user.

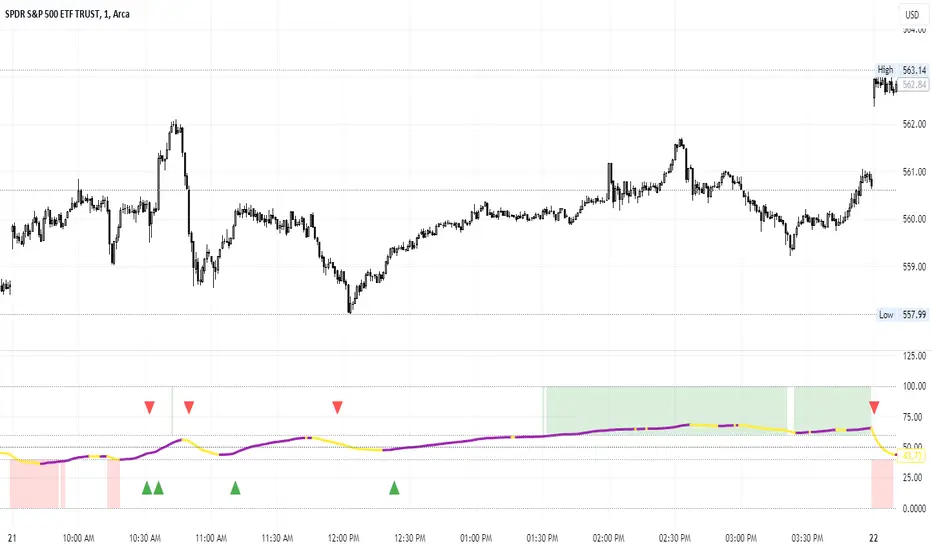
Percent of U.S. Stocks Above VWAPThis indicator plots a line reflecting the percentage of all U.S. stocks above or below their VWAP for the given candle. Horizontal lines have been placed at 40% (oversold), 50% (mid-line), and 60% (overbought). I recommend using this indicator as a market breadth indicator when trading individual stocks. In my experience, this indicator is best utilized while trading the major indices (SPX, SPY, QQQ, IWM) or their futures (ES, NQ, RTY) in the following manner:
- When the line crosses 50%, a green or red triangle is plotted indicating the majority of market momentum has turned bullish or bearish based on price positioning vs. VWAP. Look for longs when the line is rising (green) or above 50%, or shorts when the line is falling (red) or below 50%.
- When the line is below 40%, indicator shows red shading; I would not be long anything during this period. When the line exits this level, I begin looking for long entries. This line is adjustable in the indicator settings if you prefer to use a tighter or looser oversold level.
- When the line is above 60%, indicator shows green shading; I would not be short anything during this period. When the line exits this level, I begin looking for short entries. This line is adjustable in the indicator settings if you prefer to use a tighter or looser overbought level.
This indicator uses the TradingView ticker “PCTABOVEVWAP.US”, thus it only updates during NY market hours. If trading futures, I recommend applying VWAP to your chart and using that as the level to trade against in a similar manner, along with your personal price action analysis and other indicators you find useful.
Binance Auto Spot-Futures Premium/Discount -CheThis Script is based in the 2020 @Plumptoiletduck script
Special thanks to @tartigradia for the Auto Detect code for the Binance pair.
It tells us the difference in price between Spot and Perpetual Futures.
Now I incorporated the function that automatically detects the pair we are in to show the premium/discount of that pair.
You never need to select the currency you are in the script anymore!
It is specially designed for Binance coins, it includes all perpetuals.
How to use it?
Usually if the Futures are higher than the Spot it indicates that we are in an over exposure zone of longs in futures.
If the spot is cheaper than the futures it means that the futures are more fearful.
You can use this script with an Open Interest script to get an idea of what is going on.
Other examples:
Futures/Spot Ratiowhat is Futures /Spot Ratio?
Although futures and spot markets are separate markets, they are correlated. arbitrage bots allow this gap to be closed. But arbitrage bots also have their limits. so there are always slight differences between futures and spot markets. By analyzing these differences, the movements of the players in the market can be interpreted and important information about the price can be obtained. Futures /Spot Ratio is a tool that facilitates this analysis.
what it does?
it compresses the ratio between two selected spot and futures trading pairs between 0 and 100. its purpose is to facilitate use and interpretation. it also passes a regression (Colorful Regression) through the middle of the data for the same purpose.
about Colorful Regression:
how it does it?
it uses this formula:
how to use it?
use it to understand whether the market is priced with spot trades or leveraged positions. A value of 50 is the breakeven point where the ratio of the spot and leveraged markets are equal. Values above 50 indicate excess of long positions in the market, values below 50 indicate excess of short positions. I have explained how to interpret these ratios with examples below.

Pin Candle DetectionPin candles are a variation of hammer candles that are useful in technical analysis . In particular, when combined with volume profile studies, they can be a powerful set up for long entries or other decision making.
For example, when looking at volume profiles, a long entry would be a fair value area (i.e. 40%) below the close of a pin candle. When combined with a support level , the set up is stronger.
While most scripts look for hammer candles, pin candles are somewhat different in that the length of the wick is significant.
This script and its parameters was built for ES futures 15 min chart in mind.
This script is unique in that it allows for the below parameters to be adjusted to suit other instruments and timeframes:
1. Fib level: Candle must close within a certain retracement level). My preference is 0.55. Some traders like 0.5, while others prefer 0.33
2. Wick length: Pin candles differ from pure hammers in that the length of the wick must be significant. My preference is 7 points on ES (as in $ and not ticks)
Add this script to your alerts to no longer miss these set ups.

30 Second Futures Session Open RangeThis indicator displays 30 second opening ranges from Globex, Europe, and RTH sessions.
From the RTH session range, it also displays infinitely generating Price Targets based on a % of the opening range size.
I am retrieving the 30 second data using the new "request.security_lower_tf()" function.
The importance of these levels is based on the idea that when the market opens, algorithms establish their positions within the first 30 seconds.
These areas can also be seen as potential areas of support and resistance throughout the sessions.
Enjoy!

Baseline Cross Qualifier Volatility Strategy with HMA Trend BiasFor trading ES on 30min Chart
Trading Rules
Post Baseline Cross Qualifier (PBCQ): If price crosses the baseline but the trade is invalid due to additional qualifiers, then the strategy doesn't enter a trade on that candle. This setting allows you override this disqualification in the following manner: If price crosses XX bars ago and is now qualified by other qualifiers, then the strategy enters a trade.
Volatility: If price crosses the baseline, we check to see how far it has moved in terms of multiples of volatility denoted in price (ATR x multiple). If price has moved by at least "Qualifier multiplier" and less than "Range Multiplier", then the strategy enters a trade. This range is shown on the chart with yellow area that tracks price above/blow the baseline. Also, see the dots at the top of the chart. If the dots are green, then price passes the volatility test for a long. If the dots are red, then price passes the volatility test for a short.
Take Profit/Stoploss Quantity Removed
1 Take Profit: 100% of the trade is closed when the profit target or stoploss is reached.
2 Take Profits: Quantity is split 50/50 between Take Profit 1 and Take Profit 2
3 Take Profits: Quantify is split 50/25/25.
Stratgey Inputs
Baseline Length
37
Post Baseline Cross Qualifier Enabled
On
Post Baseline Cross Qualifier Bars Ago
9
ATR Length
9
Volatility Multiplier
0
Volatility Range Multiplier
10
Volatility Qualifier Multiplier
2
Take Profit Type
1 Take Profit
HMA Length
11

Failed Breakdown Detection'Failed Breakdowns' are a popular set up for long entries.
In short, the set up requires:
1) A significant low is made ('initial low')
2) Initial low is undercut with a new low
3) Price action then 'reclaims' the initial low by moving +8-10 points from the initial low
This script aims at detecting such set ups. It was coded with the ES Futures 15 minute chart in mind but may be useful on other instruments and time frames.
Business Logic:
1) Uses pivot lows to detect 'significant' initial lows
2) Uses amplitude threshold to detect a new low beneath the initial low; used /u/ben_zen script for this
3) Looks for a valid reclaim - a green candle that occurs within 10 bars of the new low
4) Price must reclaim at least 8 points for the set up to be valid
5) If a signal is detected, the initial low value (pivot low) is stored in array that prevents duplicate signals from being generated.
6) FBD Signal is plotted on the chart with "X"
7) Pivot low detection is plotted on the chart with "P" and a label
8) New lows are plotted on the chart with a blue triangle
Notes:
User input
- My preference is to use the defaults as is, but as always feel free to experiment
- Can modify pivot length but in my experience 10/10 work best for pivot lows
- New low detection - 55 bars and 0.05 amplitude work well based on visual checks of signals
- Can modify the number of points needed to reclaim a low, and the # of bars limit under which this must occur.
Alerts:
- Alerts are available for detection of new lows and detection of failed breakdowns
- Alerts are also available for these signals but only during 7:30PM-4PM EST - 'prime time' US trading hours
Limitations:
- Current version of the script only compares new lows to the most recent pivot low, does not look at anything prior to that
- Best used as a discretionary signal
Visit /u/ben_zen's Profile:
www.tradingview.com
Profile Link www.tradingview.com
