gain indicatorhe "Percentage Ruler" indicator is a custom technical analysis tool designed for the TradingView platform. Its primary function is to visually represent percentage-based price levels on a chart, relative to the closing price of the previous candle. This allows traders to quickly gauge potential support and resistance levels or to estimate possible price movements based on historical data.
Key features of the indicator include:
Dynamic Percentage Levels: The indicator automatically calculates and displays horizontal lines corresponding to predefined percentage levels, both positive and negative, ranging from -5% to +5%.
Previous Candle Close: The percentage calculations are anchored to the closing price of the previous candle, providing a consistent reference point for analysis.
Clear Visual Representation: The percentage levels are represented by horizontal lines extending to the right edge of the chart. The lines are color-coded (green for positive percentages, red for negative percentages) for easy interpretation.
Customizable Appearance: The indicator offers customization options, allowing users to adjust the line thickness and the display of percentage labels.
No Labels by Default: The indicator is designed to display only the horizontal lines by default, without any percentage labels, providing a clean and uncluttered chart view.
In summary, the "Percentage Ruler" indicator is a valuable tool for traders seeking a straightforward way to visualize percentage-based price levels relative to the previous candle's close. It aids in identifying potential support and resistance zones and estimating possible price movements based on historical data.
GAIN

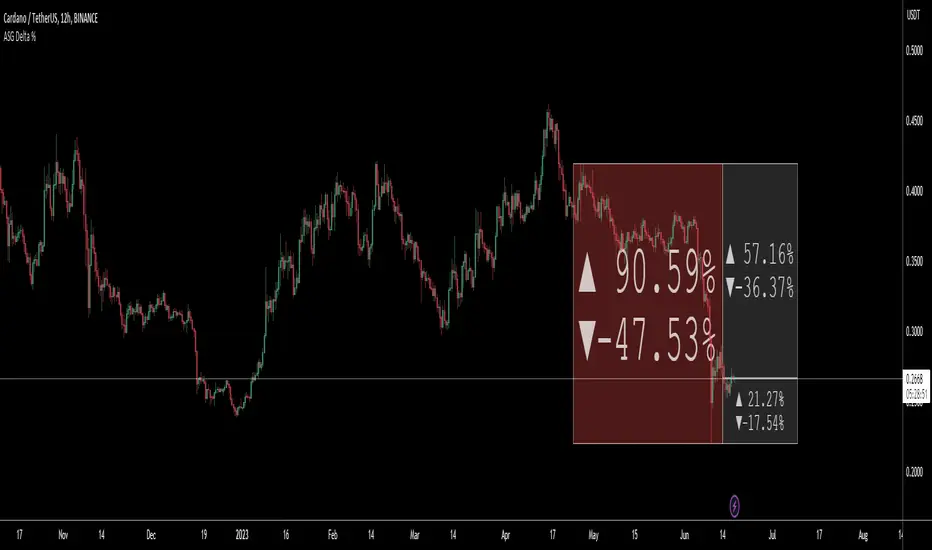
ASG Delta %This utility script provides a convenient way to calculate the percentage gain or drop of a token's price within a user-defined date range. It eliminates the need for manual measurement on individual charts, saving time and effort.
The script is particularly valuable when integrated into a daily token scanning routine for watchlists. By comparing the significant gains or drops among different tokens, traders can identify potential trading opportunities.
Simply select the desired date range, and the script will identify the highest and lowest price points achieved during that period. It then shows a visual representation in the form of a bullish or bearish box, displaying the percentage change (delta %). If the current price falls within the box's upper and lower bounds, additional percentage information can be shown in either the 'normal' or 'reverse' mode.
For instance, if a token experiences a -52.35% drop, enabling the 'Reverse' setting will reveal a potential 109.86% gain (from the low), or a 76.02% gain (from current price) or a potential drop of -16.5% (from current price) etc.. Having these basic statistics available, without having to manually chart them, especially during prolonged bear or bull markets, enables traders to make informed decisions and position themselves for more profitable trades.
I hope you find this script valuable. Your comments and recommendations are welcome as they will help improve the script's functionality further.
Kalman Gain Parameter MechanicsFrequently asked question is to explain how Gain parameter works in kalman funtion. This script serves as a visual representation of Gain parameter of Kalman function used in HMA-Kalman & Trendlines script. (The function creator's name was misspeled in that script as Kahlman)
To see better results set your Chart's timeframe to Daily.

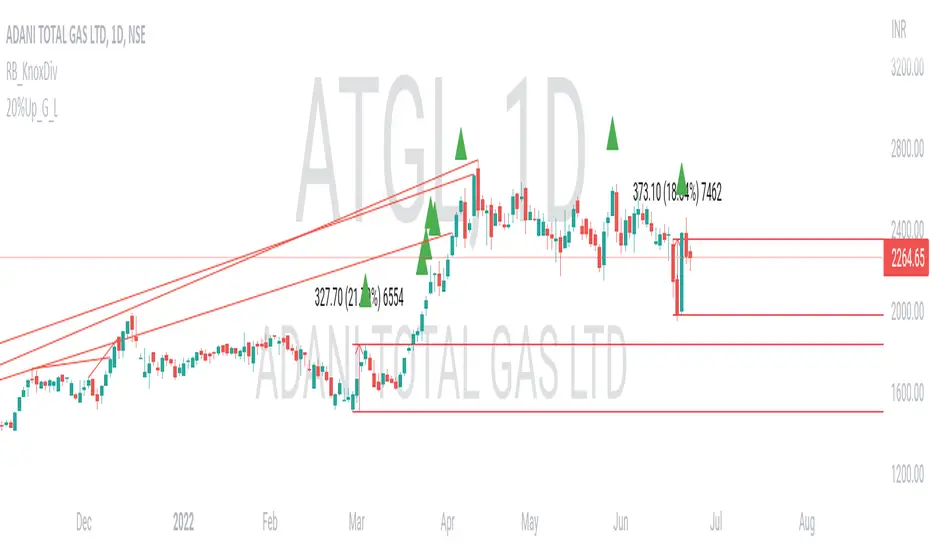
20% up with all continuously green candle: Lovevanshi It can be used to get the indication for 20% up movement among all continuously green candles formed in past. It is suitable for Indian company stock for short term trading plans.


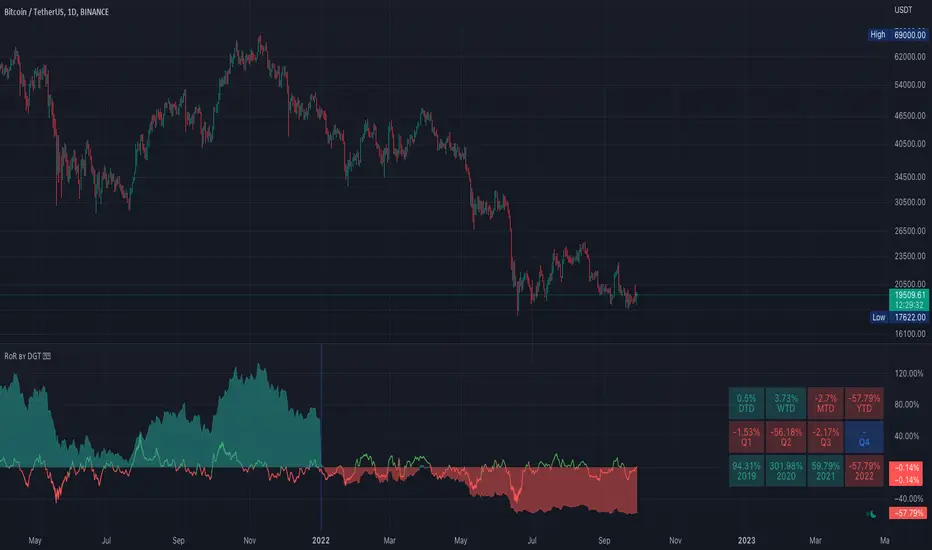
Rate of Return (RoR) by DGTA rate of return (RoR) is the net gain or loss of an investment over a specified time period, expressed as a percentage of the investment’s initial cost
Moving Gain Loss PercentTracks the percentage gain/loss in three ranges:
single candle (can be turned on or off)
custom range of candles
custom range of candles
For example, with a range of 3 candles, and the serie:
1 - close 10
2 - close 5
3 - close 20
The moving gain would be:
1 - close 10 - gain 10, infinite%
2 - close 5 - gain 5, infinite%
3 - close 18 - gain 8, 80%
Or, for example if the range is 12 candles on a monthly chart, then the result is the Year-To-Date gain/loss plotted as a percentage.

Percent Change per CandleThis indicator allows you to quickly view the true % change per candlestick (prev close > current close), but it also has 3 other customizable values for you to set your own % change conditions (such as open > high). Feel free to edit the script to suit your own needs as well.
Gain LossA very simple yet, very useful and lovely oscillator, most of the time, when we have a position in a trend and we want to take a look at percentage of our gain or loss, we need to use the "Price Range" tool time and time again, this, in some trades that you would buy and sell in less than an hour, can become a problem, also, if you have few different things going on in the chart, the price range tool will only add more to it.
Using this little oscillator, you can put the price of your position in the input section and close the settings window and watch your gain or loss percentage in real time.
