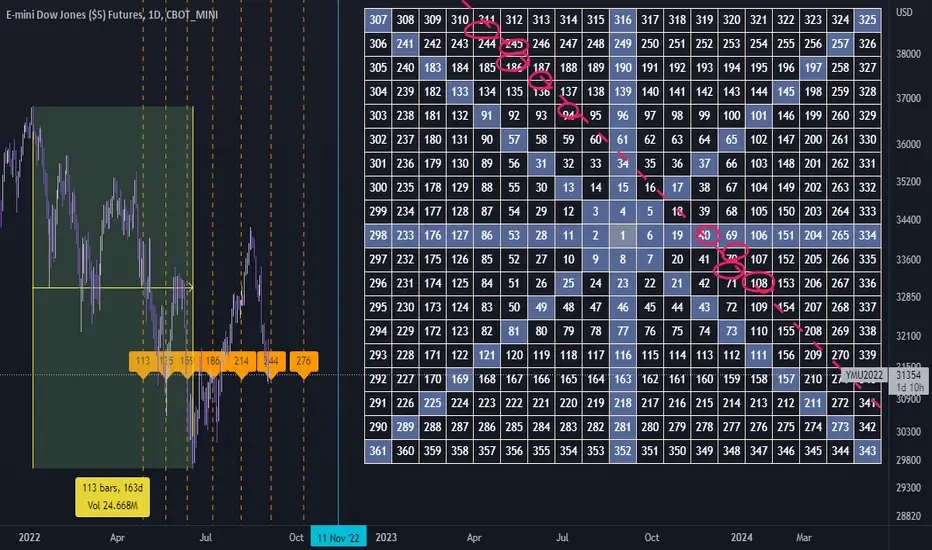
Gann Square This indicator build by Gann Square of 19.
you select start and end of big trend in daily timeframe and calculate date range.
by draw trend line in Gann square and enter the numbers cross by line in settings input you could recognize future pivot points
remember : first) this tool worked only in daily timeframe. second) better using this in dark theme :)
chart example :
Gann
Gann Square of 144This indicator will create lines on the chart based on W.D. Gann's Square of 144. All the inputs will be detailed below
Why create this indicator?
I didn't find it on Tradingview (at least with open source). But the main reason is to study the strategy and be able to draw it fast. Manually drawing the square is not hard, but moving all together to the right spots and scale was time-consuming.
It has a lot of inputs...
Yes, each square point divisible by 6 has information with some options, so the user can create any configuration he wants. Also, it has the advantage of having the square built in seconds and adjusting itself on each new calculation.
About the inputs
Starting Date
This input will be used when the "Set Upper/Lower Prices and Start Bar Automatically" checkbox is not selected. The indicator will calculate all the line locations on the chart using the selected start date. When selecting this input, change the Manual Max and Min Prices to the better calculation
Manual Max/Min Price
This input will be used when the "Set Upper/Lower Prices and Start Bar Automatically" checkbox is not selected. The indicator will calculate all the line's locations on the chart using these prices
Set Upper/Lower Prices and Start Bar Automatically
Selects if the starting date will be automatically selected by the system or based on the input data. When it's set, the indicator will use the most recent bar as the middle point of the square, using the higher price as the Upper Price and the lowest price as the Lower Price in the latest 72 bars (or more based on the Candles Per Division parameter)
Update at a new bar
When this option is market, the indicator will update all created lines to match the new bar position, together with all the possible new Upper/Lower prices. Let it unchecked to watch the progression of the price while the square remains fixed in the chart.
Top X-Axis
When checked, it will display the labels on the Top of the square
Bottom X-Axis
When checked, it will display the labels on the Bottom of the square
Left X-Axis
When checked, it will display the labels on the left of the square
Right X-Axis
When checked, it will display the labels on the right of the square
Show Prices on the Right Y-Axis
When checked, it will display the prices together with the labels on the right of the square
Show Vertical Divisions
Show the lines that will divide the square into 9 equal parts
Show Extra Lines
Show unique lines that will come from the Top and bottom middle of the square, connecting the center to the 36 and 108 levels
Show Grid
When selected, it will display a grid in the square
Line Patterns
A selector with some options of built-in lines configuration. When any option besides None is selected, it will override the lines inputs below
Numbers Color
Select the color of each number on the Axis
Vertical Lines Color
Select the color of the vertical lines
Grid Color
Select the grid line color
Connections from corners to N
Each corner is represented by 2 characters, so they all fit in a single line
It will indicate where the line starts and where it ends
┏ ↓ = Top Left to Bottom
┏ → = Top Left to Right
┗ ↑ = Bottom Left to Top
┗ → = Bottom Left to Right
┓ ← = Top Right to Left
┓ ↓ = Top Right to Bottom
┛ ← = Bottom Right to Left
┛ ↑ = Bottom Right to Top
Besides selecting what line will be created, it's possible to select the color, the style, and the extension
How to use this indicator
When you dig into Gann's books for more information about the square of 144, you find that it was part of his setup with multiple indicators (technical and fundamental, and astrological). It is not a "one indicator" setup, so it's hard to say that you will find entries, exits, stop loss, and take profit in this. Still, it will help see trendiness, support, and resistance levels.
Mixing this with other indicators is probably a good idea, but some may find this indicator the only one needed.
Some aspects of the square
The end of the square is important, so where it starts is crucial. The end is important because it is where the price and time expire. The other parts of the square are defined based on their start and end, so placing them right is essential.
So, where to set the start of the square?
The last major low is the most indicated. The minimum price will be the lowest, and the max price will be the last major Top. Note that the indicator uses 1 candle on each point.
After finding the start, the minimum, and the maximum prices for the square, it will draw all lines. Another essential part of the square is The Midpoint.
The midpoint is the most crucial part of the square and is the best way to see if you positioned the square correctly. When the price is inside the square, using the starting candle as the start, a second higher low or a lower high occurs in that spot. When using the Vertical lines in the indicator, it's the middle square inside Gann's square.
The other divisions will be opposing each other most of the time. So if the price is rising in the 1/3 of the square, it's common to see the price fall in the 3/3 of the square.
More information about these aspects here
Considerations
This indicator was meant for price targets and a time calculator for possible support/resistances in the chart. It was created by William Delbert Gann and was part of his setup for trading almost a century ago. The lines will form geometric figures, which Gann used with high accuracy to predict tops/bottoms and when they would occur.

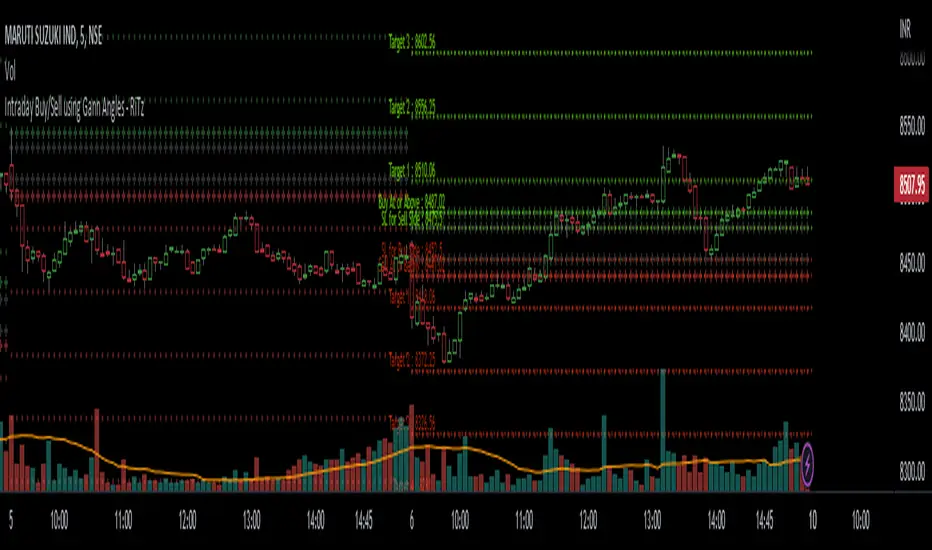
Intraday Buy/Sell using Gann Angles - RiTzIntraday Buy/Sell Levels using Gann Angles based on Todays Open/previous Day High/Low/Close prices
How to use this :
The Buy/Sell levels will be calculated on 1 of 4 things (you can choose any one which you prefer)
1. Todays Open price
2. Previous Day High
3. Previous Day Low
4. Previous Day Close
The Buy/Sell levels will be displayed in these ways
1. In a Table
2. on the Chart
You can turn them on/off according to your preference!
I can't seem to find the original documentation or a link to it.
i have it's excel file, in which we have to enter following data :
1. Todays Open price
2. Previous Day High
3. Previous Day Low
4. Previous Day Close
and the buy/sell levels are calculated by using the above data in following manner :
Based On Today's Opening Price
(lets call it TDO)
Degree's````````````````` Degree Factor```````````````````````` Buy````````````````````````` Sell
11.25```````````````````` =degree/180=11.25/180=0.0625````````` =(sqrt(TDO)-0.0625)^2``````` =(sqrt(TDO)+0.0625)^2````` SL
22.5````````````````````` =degree/180=22.5/180=0.125``````````` =(sqrt(TDO)+0.125)^2```````` =(sqrt(TDO)-0.125)^2`````` Buy/Sell At
45``````````````````````` =degree/180=45/180=0.25`````````````` =(sqrt(TDO)+0.25)^2````````` =(sqrt(TDO)-0.25)^2``````` Target-1
90``````````````````````` =degree/180=90/180=0.5``````````````` =(sqrt(TDO)+0.5)^2`````````` =(sqrt(TDO)-0.5)^2```````` Target-2
135`````````````````````` =degree/180=135/180=0.75````````````` =(sqrt(TDO)+0.75)^2````````` =(sqrt(TDO)-0.75)^2``````` Target-3
180`````````````````````` =degree/180=180/180=1```````````````` =(sqrt(TDO)+1)^2```````````` =(sqrt(TDO)-1)^2`````````` Target-4
225`````````````````````` =degree/180=225/180=1.25````````````` =(sqrt(TDO)+1.25)^2````````` =(sqrt(TDO)-1.25)^2``````` Target-5
270`````````````````````` =degree/180=270/180=1.5`````````````` =(sqrt(TDO)+1.5)^2`````````` =(sqrt(TDO)-1.5)^2```````` Target-6
315`````````````````````` =degree/180=315/180=1.75````````````` =(sqrt(TDO)+1.75)^2````````` =(sqrt(TDO)-1.75)^2``````` Target-7
360`````````````````````` =degree/180=360/180=2```````````````` =(sqrt(TDO)+2)^2```````````` =(sqrt(TDO)-2)^2`````````` Target-8
sqrt = square root
TDO = Today's Opening Price
PDH = Previous Days High
PDL = Previous Days Low
PDC = Previous Days Close
Based On Previous Days High Price
(lets call it PDH)
Degree's````````````````` Degree Factor```````````````````````` Buy````````````````````````` Sell
11.25```````````````````` =degree/180=11.25/180=0.0625````````` =(sqrt(PDH)-0.0625)^2``````` =(sqrt(PDH)+0.0625)^2````` SL
22.5````````````````````` =degree/180=22.5/180=0.125``````````` =(sqrt(PDH)+0.125)^2```````` =(sqrt(PDH)-0.125)^2`````` Buy/Sell At
45``````````````````````` =degree/180=45/180=0.25`````````````` =(sqrt(PDH)+0.25)^2````````` =(sqrt(PDH)-0.25)^2``````` Target-1
90``````````````````````` =degree/180=90/180=0.5``````````````` =(sqrt(PDH)+0.5)^2`````````` =(sqrt(PDH)-0.5)^2```````` Target-2
135`````````````````````` =degree/180=135/180=0.75````````````` =(sqrt(PDH)+0.75)^2````````` =(sqrt(PDH)-0.75)^2``````` Target-3
180`````````````````````` =degree/180=180/180=1```````````````` =(sqrt(PDH)+1)^2```````````` =(sqrt(PDH)-1)^2`````````` Target-4
225`````````````````````` =degree/180=225/180=1.25````````````` =(sqrt(PDH)+1.25)^2````````` =(sqrt(PDH)-1.25)^2``````` Target-5
270`````````````````````` =degree/180=270/180=1.5`````````````` =(sqrt(PDH)+1.5)^2`````````` =(sqrt(PDH)-1.5)^2```````` Target-6
315`````````````````````` =degree/180=315/180=1.75````````````` =(sqrt(PDH)+1.75)^2````````` =(sqrt(PDH)-1.75)^2``````` Target-7
360`````````````````````` =degree/180=360/180=2```````````````` =(sqrt(PDH)+2)^2```````````` =(sqrt(PDH)-2)^2`````````` Target-8
Based On Previous Days Low Price
(lets call it PDL)
Degree's````````````````` Degree Factor```````````````````````` Buy````````````````````````` Sell
11.25```````````````````` =degree/180=11.25/180=0.0625````````` =(sqrt(PDL)-0.0625)^2``````` =(sqrt(PDL)+0.0625)^2````` SL
22.5````````````````````` =degree/180=22.5/180=0.125``````````` =(sqrt(PDL)+0.125)^2```````` =(sqrt(PDL)-0.125)^2`````` Buy/Sell At
45``````````````````````` =degree/180=45/180=0.25`````````````` =(sqrt(PDL)+0.25)^2````````` =(sqrt(PDL)-0.25)^2``````` Target-1
90``````````````````````` =degree/180=90/180=0.5``````````````` =(sqrt(PDL)+0.5)^2`````````` =(sqrt(PDL)-0.5)^2```````` Target-2
135`````````````````````` =degree/180=135/180=0.75````````````` =(sqrt(PDL)+0.75)^2````````` =(sqrt(PDL)-0.75)^2``````` Target-3
180`````````````````````` =degree/180=180/180=1```````````````` =(sqrt(PDL)+1)^2```````````` =(sqrt(PDL)-1)^2`````````` Target-4
225`````````````````````` =degree/180=225/180=1.25````````````` =(sqrt(PDL)+1.25)^2````````` =(sqrt(PDL)-1.25)^2``````` Target-5
270`````````````````````` =degree/180=270/180=1.5`````````````` =(sqrt(PDL)+1.5)^2`````````` =(sqrt(PDL)-1.5)^2```````` Target-6
315`````````````````````` =degree/180=315/180=1.75````````````` =(sqrt(PDL)+1.75)^2````````` =(sqrt(PDL)-1.75)^2``````` Target-7
360`````````````````````` =degree/180=360/180=2```````````````` =(sqrt(PDL)+2)^2```````````` =(sqrt(PDL)-2)^2`````````` Target-8
Based On Previous Days Close Price
(lets call it PDC)
Degree's````````````````` Degree Factor```````````````````````` Buy````````````````````````` Sell
11.25```````````````````` =degree/180=11.25/180=0.0625````````` =(sqrt(PDC)-0.0625)^2``````` =(sqrt(PDC)+0.0625)^2````` SL
22.5````````````````````` =degree/180=22.5/180=0.125``````````` =(sqrt(PDC)+0.125)^2```````` =(sqrt(PDC)-0.125)^2`````` Buy/Sell At
45``````````````````````` =degree/180=45/180=0.25`````````````` =(sqrt(PDC)+0.25)^2````````` =(sqrt(PDC)-0.25)^2``````` Target-1
90``````````````````````` =degree/180=90/180=0.5``````````````` =(sqrt(PDC)+0.5)^2`````````` =(sqrt(PDC)-0.5)^2```````` Target-2
135`````````````````````` =degree/180=135/180=0.75````````````` =(sqrt(PDC)+0.75)^2````````` =(sqrt(PDC)-0.75)^2``````` Target-3
180`````````````````````` =degree/180=180/180=1```````````````` =(sqrt(PDC)+1)^2```````````` =(sqrt(PDC)-1)^2`````````` Target-4
225`````````````````````` =degree/180=225/180=1.25````````````` =(sqrt(PDC)+1.25)^2````````` =(sqrt(PDC)-1.25)^2``````` Target-5
270`````````````````````` =degree/180=270/180=1.5`````````````` =(sqrt(PDC)+1.5)^2`````````` =(sqrt(PDC)-1.5)^2```````` Target-6
315`````````````````````` =degree/180=315/180=1.75````````````` =(sqrt(PDC)+1.75)^2````````` =(sqrt(PDC)-1.75)^2``````` Target-7
360`````````````````````` =degree/180=360/180=2```````````````` =(sqrt(PDC)+2)^2```````````` =(sqrt(PDC)-2)^2`````````` Target-8
example based On Today's Opening Price = 4339
Degree's```````` Degree Factor```````` Buy`````````` Sell
11.25``````````` 0.0625``````````````` 4330.77`````` 4347.24```````` SL
22.5```````````` 0.125```````````````` 4355.48`````` 4322.55```````` Buy/Sell At
45`````````````` 0.25````````````````` 4372.00`````` 4306.13```````` Target-1
90`````````````` 0.5`````````````````` 4405.12`````` 4273.38```````` Target-2
135````````````` 0.75````````````````` 4438.37`````` 4240.76```````` Target-3
180````````````` 1```````````````````` 4471.74`````` 4208.26```````` Target-4
225````````````` 1.25````````````````` 4505.24`````` 4175.88```````` Target-5
270````````````` 1.5`````````````````` 4538.86`````` 4143.64```````` Target-6
315````````````` 1.75````````````````` 4572.61`````` 4111.51```````` Target-7
360````````````` 2```````````````````` 4606.48`````` 4079.52```````` Target-8
Note : ignore the '`' , inserted them to fill up the spaces , it was looking very weird!, tried to fix it as much as I can.
Note :- Please correct me if I'm wrong , as I've already mentioned I don't have it's original documentation.
if anyone can find it or already has it then please feel free to share it.
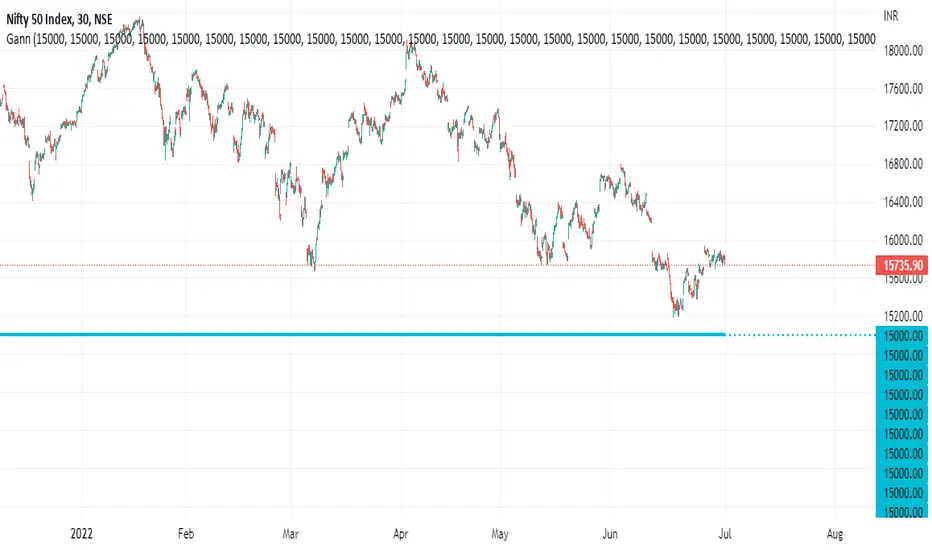
nifty gann & 100 levelsnifty gannlevels with 100 points defference
gann levels with manual entry of cuurent gann level
manual entry of diffeence between two gann levels

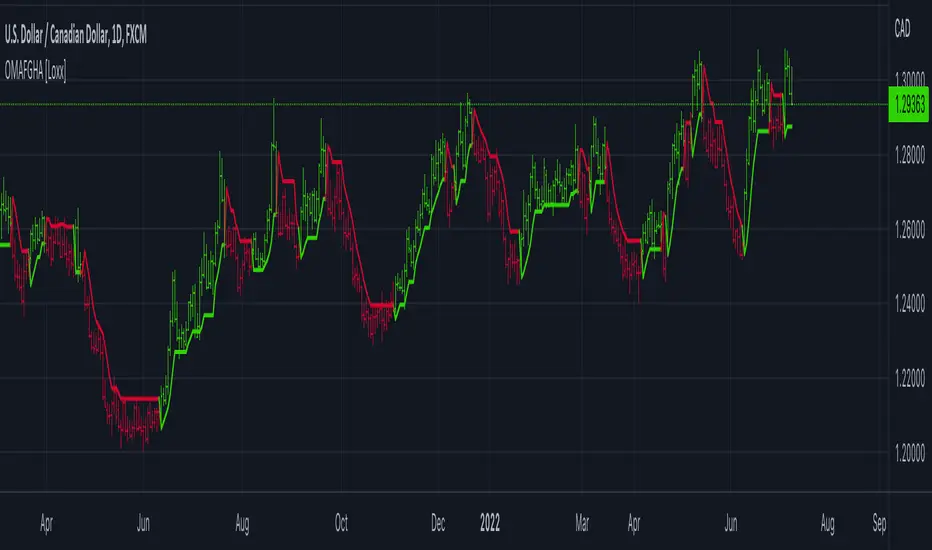
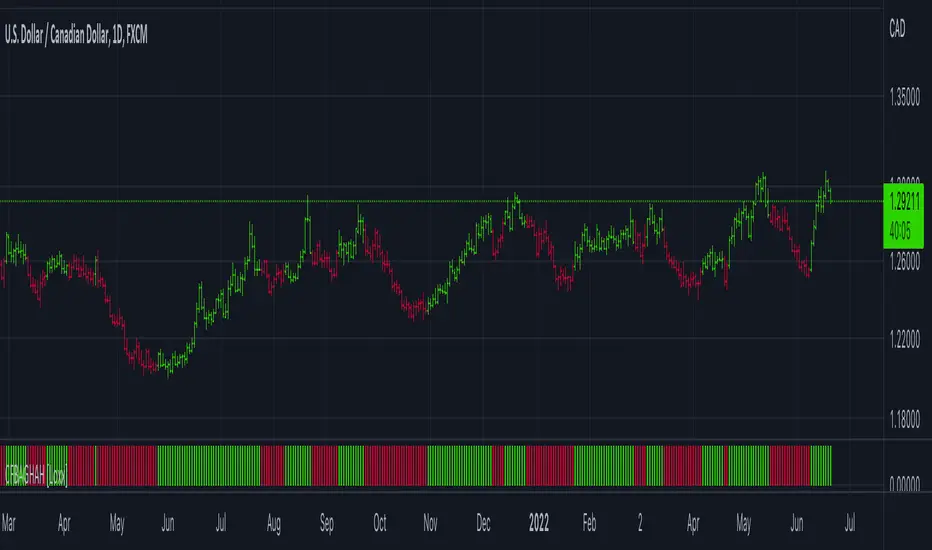
OMA-Filtered, Gann HiLo Activator [Loxx]OMA-Filtered, Gann HiLo Activator is a Gann HiLo activator that uses OMA filtering instead SMA filtering. This GHA calculation also includes a variable for close period to further tune the indicator.
What is Gann HiLo?
The HiLo Activator study is a trend-following indicator introduced by Robert Krausz as part of the Gann Swing trading strategy. In addition to indicating the current trend direction, this can be used as both entry signal and trailing stop.
Here is how the HiLo Activator is calculated:
1. The system calculates the moving averages of the high and low prices over the last several candles. By default, the average is calculated using the last three candles.
2. If the close price falls below the average low or rises above the average high, the system plots the opposite moving average. For example, if the price crosses above the average high, the system will plot the average low. If the price crosses below the average low afterward, the system will stop plotting the average low and will start plotting the average high, and so forth .
The plot of the HiLo Activator thus consists of sections on the top and bottom of the price plot. The sections on the bottom signify bullish trending conditions. Vice versa, those on the top signify the bearish conditions.
Included
-Toggle bar color on/off
Gann Levels For Nifty Gann Levels for nifty 50 is very important to trade in options. so i create 50 gann levels for intraday trading.
CFB Adaptive Gann HiLo Activator Histogram [Loxx]CFB Adaptive Gann HiLo Activator Histogram is a Composite-Fractal-Behavior-adaptive Gann HiLo activator in histogram form that has been smoothed using Jurik Filtering to reduce noise and better identify trending markets. This indicator is the CFB adaptive version of Jurik-Filtered, Gann HiLo Activator .
What is Gann HiLo
The HiLo Activator study is a trend-following indicator introduced by Robert Krausz as part of the Gann Swing trading strategy. In addition to indicating the current trend direction, this can be used as both entry signal and trailing stop.
Here is how the HiLo Activator is calculated:
1. The system calculates the moving averages of the high and low prices over the last several candles. By default, the average is calculated using the last three candles.
2. If the close price falls below the average low or rises above the average high, the system plots the opposite moving average. For example, if the price crosses above the average high, the system will plot the average low. If the price crosses below the average low afterward, the system will stop plotting the average low and will start plotting the average high, and so forth .
The plot of the HiLo Activator thus consists of sections on the top and bottom of the price plot. The sections on the bottom signify bullish trending conditions. Vice versa, those on the top signify the bearish conditions.
What is Composite Fractal Behavior ( CFB )?
All around you mechanisms adjust themselves to their environment. From simple thermostats that react to air temperature to computer chips in modern cars that respond to changes in engine temperature, r.p.m.'s, torque, and throttle position. It was only a matter of time before fast desktop computers applied the mathematics of self-adjustment to systems that trade the financial markets.
Unlike basic systems with fixed formulas, an adaptive system adjusts its own equations. For example, start with a basic channel breakout system that uses the highest closing price of the last N bars as a threshold for detecting breakouts on the up side. An adaptive and improved version of this system would adjust N according to market conditions, such as momentum, price volatility or acceleration.
Since many systems are based directly or indirectly on cycles, another useful measure of market condition is the periodic length of a price chart's dominant cycle, (DC), that cycle with the greatest influence on price action.
The utility of this new DC measure was noted by author Murray Ruggiero in the January '96 issue of Futures Magazine. In it. Mr. Ruggiero used it to adaptive adjust the value of N in a channel breakout system. He then simulated trading 15 years of D-Mark futures in order to compare its performance to a similar system that had a fixed optimal value of N. The adaptive version produced 20% more profit!
This DC index utilized the popular MESA algorithm (a formulation by John Ehlers adapted from Burg's maximum entropy algorithm, MEM). Unfortunately, the DC approach is problematic when the market has no real dominant cycle momentum, because the mathematics will produce a value whether or not one actually exists! Therefore, we developed a proprietary indicator that does not presuppose the presence of market cycles. It's called CFB (Composite Fractal Behavior) and it works well whether or not the market is cyclic.
CFB examines price action for a particular fractal pattern, categorizes them by size, and then outputs a composite fractal size index. This index is smooth, timely and accurate
Essentially, CFB reveals the length of the market's trending action time frame. Long trending activity produces a large CFB index and short choppy action produces a small index value. Investors have found many applications for CFB which involve scaling other existing technical indicators adaptively, on a bar-to-bar basis.
What is Jurik Volty used in the Juirk Filter?
One of the lesser known qualities of Juirk smoothing is that the Jurik smoothing process is adaptive. "Jurik Volty" (a sort of market volatility ) is what makes Jurik smoothing adaptive. The Jurik Volty calculation can be used as both a standalone indicator and to smooth other indicators that you wish to make adaptive.
What is the Jurik Moving Average?
Have you noticed how moving averages add some lag (delay) to your signals? ... especially when price gaps up or down in a big move, and you are waiting for your moving average to catch up? Wait no more! JMA eliminates this problem forever and gives you the best of both worlds: low lag and smooth lines.
Ideally, you would like a filtered signal to be both smooth and lag-free. Lag causes delays in your trades, and increasing lag in your indicators typically result in lower profits. In other words, late comers get what's left on the table after the feast has already begun.
Included
-Toggle bar color on/off
Jurik-Filtered, Gann HiLo Activator [Loxx]Jurik-Filtered, Gann HiLo Activator is a Gann HiLo activator that has been smoothed using Jurik Filtering to reduce noise and better identify trending markets.
What is Gann HiLo
The HiLo Activator study is a trend-following indicator introduced by Robert Krausz as part of the Gann Swing trading strategy. In addition to indicating the current trend direction, this can be used as both entry signal and trailing stop.
Here is how the HiLo Activator is calculated:
1. The system calculates the moving averages of the high and low prices over the last several candles. By default, the average is calculated using the last three candles.
2. If the close price falls below the average low or rises above the average high, the system plots the opposite moving average. For example, if the price crosses above the average high, the system will plot the average low. If the price crosses below the average low afterward, the system will stop plotting the average low and will start plotting the average high, and so forth.
The plot of the HiLo Activator thus consists of sections on the top and bottom of the price plot. The sections on the bottom signify bullish trending conditions. Vice versa, those on the top signify the bearish conditions.
What is Jurik Volty used in the Juirk Filter?
One of the lesser known qualities of Juirk smoothing is that the Jurik smoothing process is adaptive. "Jurik Volty" (a sort of market volatility ) is what makes Jurik smoothing adaptive. The Jurik Volty calculation can be used as both a standalone indicator and to smooth other indicators that you wish to make adaptive.
What is the Jurik Moving Average?
Have you noticed how moving averages add some lag (delay) to your signals? ... especially when price gaps up or down in a big move, and you are waiting for your moving average to catch up? Wait no more! JMA eliminates this problem forever and gives you the best of both worlds: low lag and smooth lines.
Ideally, you would like a filtered signal to be both smooth and lag-free. Lag causes delays in your trades, and increasing lag in your indicators typically result in lower profits. In other words, late comers get what's left on the table after the feast has already begun.
Included
-Toggle bar color on/off

Gann Swing Chart [One-Bar]"Gann used three types of swings chart.
One-Bar Swing Chart (1-Bar Swing Chart): The One-Bar Swing Chart, or Minor Trend Chart, follows the one-bar movements of the market. From a low price, each time the market makes a higher-high than the previous bar, a One-Bar trend line moves up from the recent low to the new high. This action makes the previous low price a One-Bar bottom. From a high price each time the market makes a lower-low than the previous bar, a One-Bar swing line moves down from the recent high to the new low. This action makes the previous high price a One-Bar top.
The combination of One-Bar tops and bottoms forms the One-Bar trend indicator chart. The crossing of a One-Bar swing top changes the One-Bar trend to up. The penetration of a One-Bar swing bottom changes the One-Bar trend to down."
This Indicator only show Gann Swing Chart use One-Bar type.

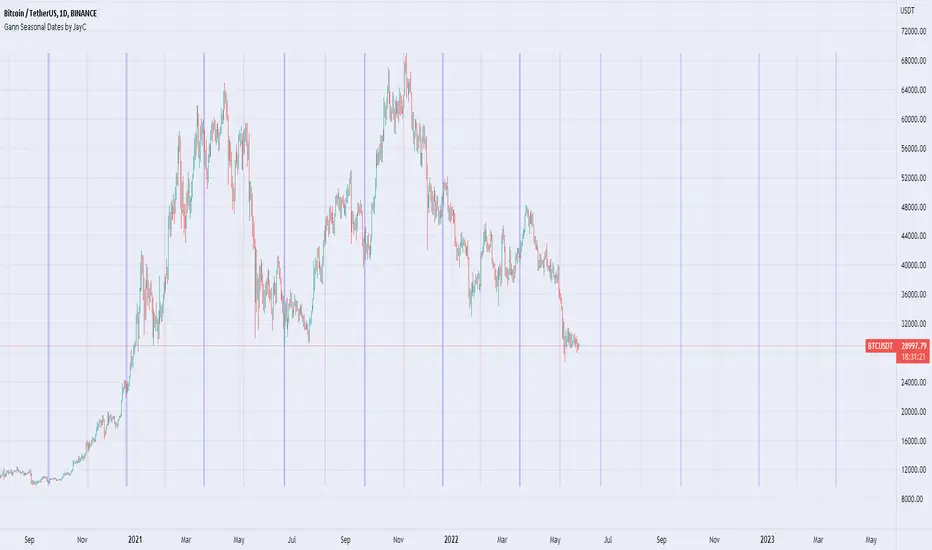
Gann Seasonal Dates by JayCThis script marks important seasonal dates with a vertical line that Gann used to watch for Trend changes.
March 21st
June 22nd
September 23rd
December 22nd
And 50% Levels - Minor seasonal dates.
February 4th
May 6th
August 8th
November 7th
In the settings you can change line colors and toggle the Offset. Offset is the way the script draws lines to show future dates, I offset by 365 so it will show incorrectly at some points in back testing.
GANN Square Of 9 PivotsGANN Square Of 9 Pivots
How to use for Intraday ?
Method 01 (From 9:05 am to 9:15 am or pre-open market)
Take the Weighted Average Price or Volume Weighted Average Price (VWAP) or Time Weighted Average Price (TWAP) of any stock or index.
You can use TWAP for Index as volume is not available.
Method 02 (From 9:05 am to 9:15 am or pre-open market)
Take the Last Traded Price (LTP) of index or stock
Method 03 (After 9:30 am or after 1st 15 min)
Only take Last Traded Price (LTP) of stock or index
Ideal Time
15min to 1hr after market opens
Indicator Features
Lines
Gray Dashed Line: Calculation Price
Teal Solid Line: Long Above
Red Solid Line: Short Below
3 Teal Dotted Lines: Bullish Targets 1, 2 & 3
3 Red Dotted Lines: Bearish Targets 1, 2 & 3
Labels
1st Numbers: Price
2nd Numbers in (): % change from LTP to that Level
For Index
As VWAP is not available for Index, TWAP (Time Weighted Average Price) values can be used for Index.
Custom Price Inputs
Price of your choice can be given manually by selecting:
Source > Custom
Enter Price > (type the price)
Timeframe
Higher timeframes like Weekly, Monthly can be changed using Timeframe Option
For More Reading
Reading: traderji.com/community/threads/intraday-trading-using-gann-calculator.39185/#post-419677
Calculator: stockmaniacs.net/freebies/free-tools/gann-square-of-9-calculator/

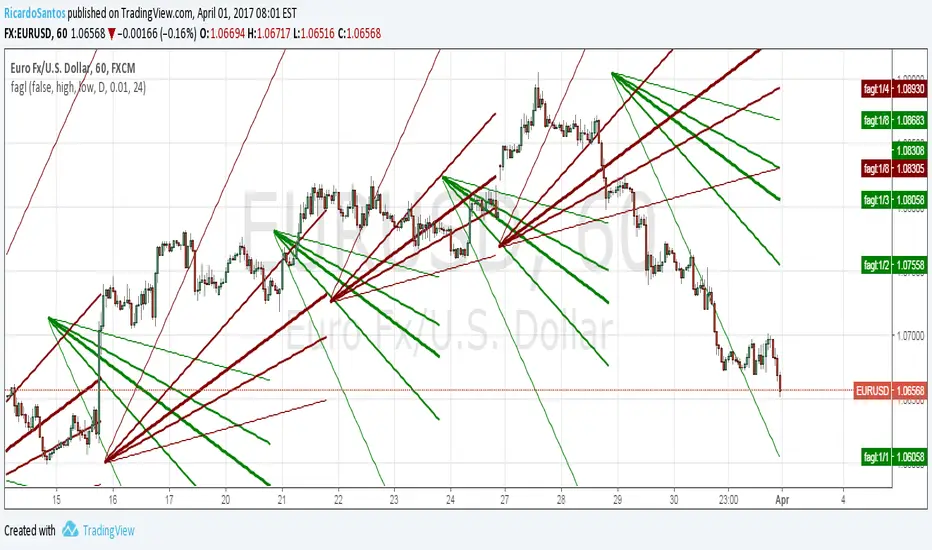
Gann Square TechniqueThis is the Gann Square Technique that i saw from the YT channel "WD Gann Price & Time Technical Analysis". The horizontal lines can act like Fibonnacci Retracement
This script display Gann Fann/trend lines that u can use like support and resistance.
There can be a problem if u try to display all the squares and lines, this for the limitation of line for part of TradingView but easily u can display:
-Three Gann Squares only with Gann lines
-Three Gann Squares only with 1/8 lines
-Two Gann Squares with 1/4 lines and Gann lines
-Two Gann Squares with 1/6 lines and Gann lines
-One Gann Squares with 1/8 lines and Gann lines
-etc
Probably if u choose some option the Gann Squares will automatically adjust to the last candle, idk how to prevent that

Gann Price VibrationsCurrently there is no Script available for drawing Price Vibrations based on Gann theory. I have attempted to fill this gap. This indicator will draw Cycle lines based on Gann Theory. This is vey basic one. It draws lines at start/end of every cycle. One cycle is 360 degrees. Based on feedback, it will be upgraded further with lower Angles 90/180/270 degrees movement.
How to use it ? Once you load the indicator on the chart, edit settings and give current market price of Stock you are watching.
Example: If you are watching Reliance share price on chart, go to indicators/Public/Gann Price Vibrations. Once indicator is loaded, edit input Price as 2200. Then indicator will draw cycle lines.
How to trade ? Generally, it is assumed that stock prices move in cycles. Prices spend more time near these lines. So, if you find UP or Down breakout from cycle lines, take entry. For Long trade, Target is next upper line and stop loss is one line below. Similarly, for short trade, Target is next below line and stop loss is upper line. Just notice, how RIL is moving exactly within these cycles.
If you want to study historical charts, you need to enter Price value closer to that date.
Please Like it/Share it

Gann Trend Oscillator Backtest The Gann Swing Oscillator has been adapted from Robert Krausz's book,
"A W.D. Gann Treasure Discovered". The Gann Swing Oscillator helps
define market swings.
You can change long to short in the Input Settings
Please, use it only for learning or paper trading. Do not for real trading.

Gann Trend Oscillator Strategy The Gann Swing Oscillator has been adapted from Robert Krausz's book,
"A W.D. Gann Treasure Discovered". The Gann Swing Oscillator helps
define market swings.

Gann Swing Oscillator The Gann Swing Oscillator has been adapted from Robert Krausz's book,
"A W.D. Gann Treasure Discovered". The Gann Swing Oscillator helps
define market swings.
You can change long to short in the Input Settings
Please, use it only for learning or paper trading. Do not for real trading.

Gann Swing Oscillator Strategy The Gann Swing Oscillator has been adapted from Robert Krausz's book,
"A W.D. Gann Treasure Discovered". The Gann Swing Oscillator helps
define market swings.

Gann Swing Oscillator The Gann Swing Oscillator has been adapted from Robert Krausz's book,
"A W.D. Gann Treasure Discovered". The Gann Swing Oscillator helps
define market swings.

[RS]Fractal Auto Gann LinesEXPERIMENTAL:
GANN lines projection based on zigzag tops/bottoms, use at your own risk.
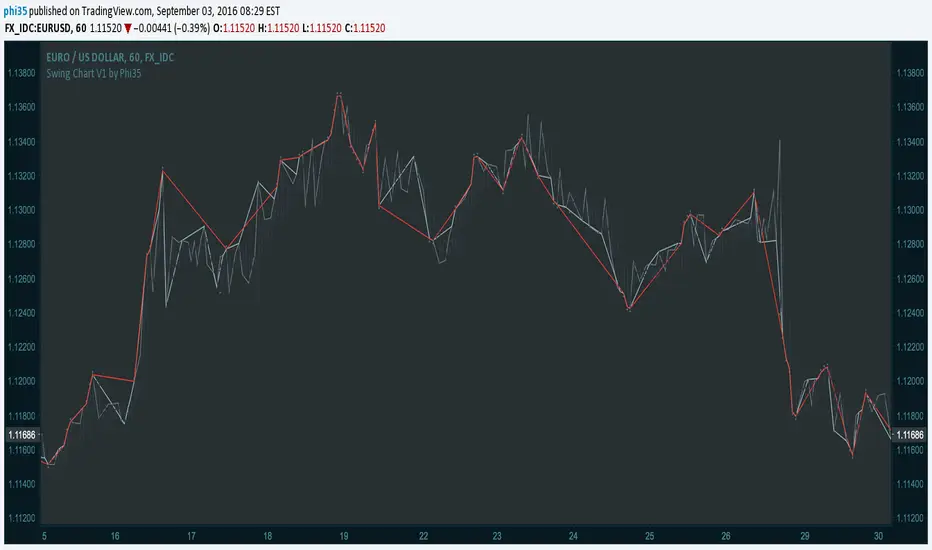
Swing Chart V1 by Phi35 © With this indicator, which plots the swing chart of the 3 degrees, swing traders can automate their work of tracking the right bars.
How it works:
Minor Degree (one bar) (gray)= If the current high is higher than the previous high or the current low is lower than the previous low.
Intermediate Degree (two bar) (baby blue)= If the current high is higher than previous and the penultimate high etc.
Main Degree (three bar) (red)= If the current high is higher than the previous, the penultimate and the high before penultimate high etc.
Alert:
On crossover there will be an alert (popup with a message) and in addition you will see "diamonds" on the place where the crossover took place
If there is an issue or any suggestions, feel free to contact me. Do not modify the code without permission.
Swing Chart V1 by Phi35 ©

CM Gann Swing High Low V2CM Gann Swing High Low V2
Added Improvements:
Used PineScript “linebr" code so solid lines plot only when condition = true.
Via Inputs Tab:
Ability to Turn On/Off Highlight Bars When Crossing Above/Below Swing High Low
Ability to Turn On/Off Back Ground Highlights When Crossing Above/Below Swing High Low
Ability to Turn On/Off linebr plots.
Other Features: All Available Via Inputs Tab
Ability to Adjust Moving Average Values to adjust Sensitivity.
Ability to Turn On/Off Triangles Above/Below Bars based on Indicator.
Ability to Turn On/Off Triangles at Top And Bottom Of Screen Showing Direction of Indicator.
***Basically you have Option to View Indicator about every way possible.
***Special Thanks to Glaz for Original Code.

CM_Gann_Swing_HighLowCustom Indicator - Gann Swing High Low
Uses New Plot Types
Inputs Tab Options:
Use Up/Down Arrows - Or Circles!
Turn Up/Down Arrows at Top and Bottom of Screen On/Off
New Top/Bottom of Screen Plot Types
New Up/Down Arrow Plot Types
Full Credit Goes to Glaz for Creating Code.
Created By Request for @dvk1970
