Ehlers Simple Cycle Indicator [LazyBear]One of the early cycle indicators from John Ehlers.
Ehlers suggests using this with ITrend (see linked PDF below). Osc/signal crosses identify entry/exit points.
Options page has the usual set of configurable params.
More info:
- Simple Cycle Indicator: www.mesasoftware.com
List of my public indicators: bit.ly
List of my app-store indicators: blog.tradingview.com
Indicators

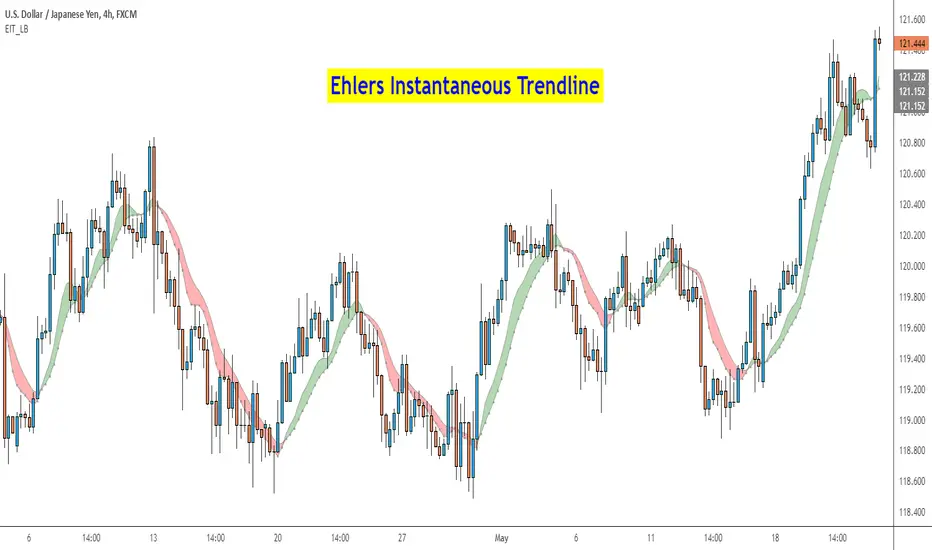
Ehlers Instantaneous Trend [LazyBear]One more to add to the Ehlers collection.
Ehlers Instantaneous Trendline, by John Ehlers, identifies the market trend by doing removing cycle component. I think, this simplicity is what makes it attractive :) To understand Ehlers's thought process behind this, refer to the PDF linked below.
There are atleast 6 variations of this ITrend. This version is from his early presentations.
Is this better than a simple HMA? May be, May be not. I will leave it to you to decide :)
I have added options to show this as a ribbon, and to color bars based on ITrend. Check out the options page.
More info:
- ITrend: www.mesasoftware.com
List of my public indicators: bit.ly
List of my app-store indicators: blog.tradingview.com
Ehlers Center of Gravity Oscillator [LazyBear]As part of my "Ehler's Indicators week", here's one more.
CG Oscillator, by John Ehlers, provides a smoothed, essentially zero lag oscillator for identifying market turning points. The "CG" in the name of the oscillator refers to "Center Of Gravity" of the prices over the window of observation.
Entry/Exit are based on the osc/signal crossovers. Enabling the "Color bars" options helps in easily identifying crossovers.
More info:
- CG osc (pdf): www.mesasoftware.com
- TASC Article: traders.com
- Cybernetic Analysis for Stocks and Futures (Ehlers, 2004)
List of my public indicators: bit.ly
List of my app-store indicators: blog.tradingview.com

Premier RSI Oscillator [LazyBear]This is a modified form of PSO (original idea by Lee Leibfarth), to use RSI as the input.
This provides a quick response to changes in market direction. This highly sensitive indicator allows for early anticipation of price turns and can be used to establish definitive trading zones that identify potential trading opportunities.
Entry/Exit rules are the same as PSO. Enabling bar colors makes it easy to identify the entry/exits too (Refer to my comment below for more points to keep in mind regarding colors)
Here's a comparison against normal RSI.
More info:
PSO:
List of my public indicators: bit.ly
List of my app-store indicators: blog.tradingview.com

Ehlers Cyber Cycle Indicator [LazyBear]The Cyber Cycle Indicator, developed by John Ehlers, is used for isolating the cycle component of the market from its trend counterpart. Unlike other oscillators like RSI, Cyber Cycle Indicator's wave has a variable amplitude.
Use the osc/signal crossover for entry/exit points. You can enable highlighting the crossovers by using region fills (via options page). I have also added an option to color the bars based on this.
Actually I have lot of Ehlers indicators in my to-publish backlog, will try to prioritize them over the others in the pipeline. Lets have an Ehlers week for indicators :)
More info:
Cybernetic Analysis for Stocks and Futures
List of my public indicators: bit.ly
List of my app-store indicators: blog.tradingview.com

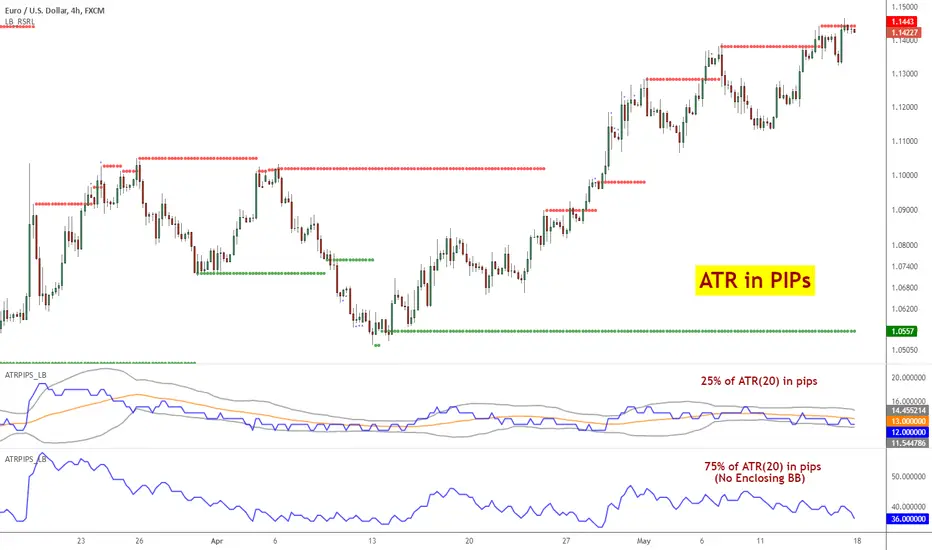
ATR Pips [LazyBear]This is ATR in pips. This was requested by user @ElixiumCapital. ATRPIPs in his words:
"ATR PIPs is useful for finding markets with your desired amount of volatility, for example I prefer to trade forex pairs with the highest amount of volatility in the past 5 days, setting the length parameter to 5 days. And setting my stop loss at 25% to 33% of the the indicators value."
I have added options to show a BB around ATR, as well as normal ATR (not in PIPs). All the parameters are configurable.
List of my public indicators: bit.ly
List of my app-store indicators: blog.tradingview.com
DiNapoli MACD & Stoch [LazyBear] --- Updated: May 19 2015 ----
Applicable only If you are setting up alerts:
I noticed I have switched the plot names. Histo shd be the MACD and DMACD shd be the Signal.
Replace lines 16 & 17 with these to get the correct names. NOTE that no functionality is affected, just the names.
plot(r, style=columns, color=r>0?green:red, transp=80, title="Dinapoli MACD")
plot(s, color=teal, linewidth=2, title="Trigger")
--- Original Description ---
These two indicators are from one of my favorite books - DiNapoli's Levels. These are custom MACD and Stoch used by him. There are more indicators - Detrended Osc, DisplacedMA - that he uses, will publish them all later.
The settings of normal MACD/Stoch can be tuned to obtain these DiNapoli indicators, or if you are lazy (like me!) just use these :)
DiNapoli Preferred Stoch source: pastebin.com
More info:
www.amazon.com
List of my public indicators: bit.ly
List of my app-store indicators: blog.tradingview.com

Absolute Strength Index Oscillator [LazyBear]This oscillator is derived from Absolute Strength Index, originally developed by Tudor Marcelin (Art Invest).
I made it an oscillator mainly to make it easy to identify the divergences and price-flows. There is not much documentation available online for Absolute Strength Index afaik, lets hope Mr.Tudor comes across this and provides us a detailed writeup :)
Quick testing showed lots of good signals (with minimal lag). Let me know what you guys find in your testing.
Indicator options support coloring bars based on the oscillator/signal values, and a histogram-only mode.
List of my public indicators: bit.ly
List of my app-store indicators: blog.tradingview.com

High-Low Index [LazyBear]-- Fixed ---
Source: pastebin.com
Fixes an issue with "Combined" mode, using wrong symbols.
--- Original ---
The High-Low Index is a breadth indicator based on Record High Percent, which is based on new 52-week highs and new 52-week lows.
Readings below 50 indicate that there were more new lows than new highs. Readings above 50 indicate that there were more new highs than new lows. 0 indicates there were zero new highs (0% new highs). 100 indicates there was at least 1 new high and no new lows (100% new highs). 50 indicates that new highs and new lows were equal (50% new highs).
Readings consistently above 70 usually coincide with a strong uptrend. Readings consistently below 30 usually coincide with a strong downtrend.
More info:
stockcharts.com
List of my public indicators: bit.ly
List of my app-store indicators: blog.tradingview.com
Just noticed @Greeny has already published this -> Linking it here.

Zweig Market Breadth Thrust Indicator [LazyBear]The Breadth Thrust (BT) indicator is a market momentum indicator developed by Dr. Martin Zweig. According to Dr. Zweig a Breadth Thrust occurs when, during a 10-day period, the Breadth Thrust indicator rises from below 40 percent to above 61.5 percent.
A "Thrust" indicates that the stock market has rapidly changed from an oversold condition to one of strength, but has not yet become overbought. This is very rare and has happened only a few times. Dr. Zweig also points out that most bull markets begin with a Breadth Thrust.
All parameters are configurable. You can draw BT for NYSE, NASDAQ, AMEX or based on combined data (i.e., AMEX+NYSE+NASD). There is also a "CUSTOM" mode supported, so you can enter your own ADV/DEC symbols.
More info:
Definition: www.investopedia.com
A Breadth Thrust Signal: www.mcoscillator.com
A Rare "Zweig" Buy Signal: www.moneyshow.com
Zweig Breadth Thrust: recessionalert.com
List of my public indicators: bit.ly
List of my app-store indicators: blog.tradingview.com

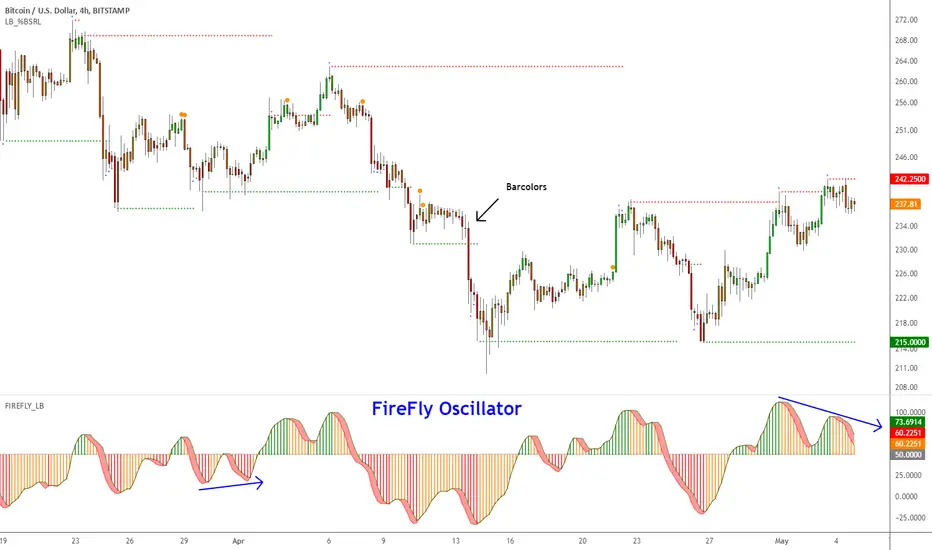
Firefly Oscillator [LazyBear]This is a modified version of a public Amibroker indicator, called Firefly.
I disabled the additional smoothing (you can enable it via options page) and updated the visual rendering (simple 3D look, histo, bar colors et al). Also, have added an option to show enclosing BB.
You can trade this like any other oscillator -- 80/20 OB/OS levels, divergences, ...
Here's a chart showing some possible customizations that are supported:
Do let me know what you guys think.
List of my public indicators: bit.ly
List of my app-store indicators: blog.tradingview.com
CCT StochRSI [LazyBear]CCT StochRSI, proposed by Steve Karnish of Cedar Creek Trading, reconfigures classic StochRSI using custom parameters and smoothing.
There are 6 types supported.
Common formula:
(rsi - lowest(rsi, x)) / (highest(rsi, y) - lowest(rsi, z)) * 100
Smoothed formula:
ema(common formula result, len)
Settings (values for x/y/z/len in the above formulae):
Type 1: RSILength=21, x=8, y=13, z=13, len=N/A
Type 2: RSILength=21, x=21, y=21, z=21, len=N/A
Type 3: RSILength=14, x=14, y=14, z=14, len=N/A
Type 4: RSILength=21, x=13, y=8, z=13, len=8
Type 5: RSILength=5, x=5, y=5, z=5, len=3
Type 6: RSILength=13, x=13, y=13, z=13, len=3
Apart from these default types, this also supports user-specified custom type (select "0" for "Type" option).
All 6 types:
CCT StochRSI compared against normal StochRSI:
List of my public indicators: bit.ly
List of my app-store indicators: blog.tradingview.com

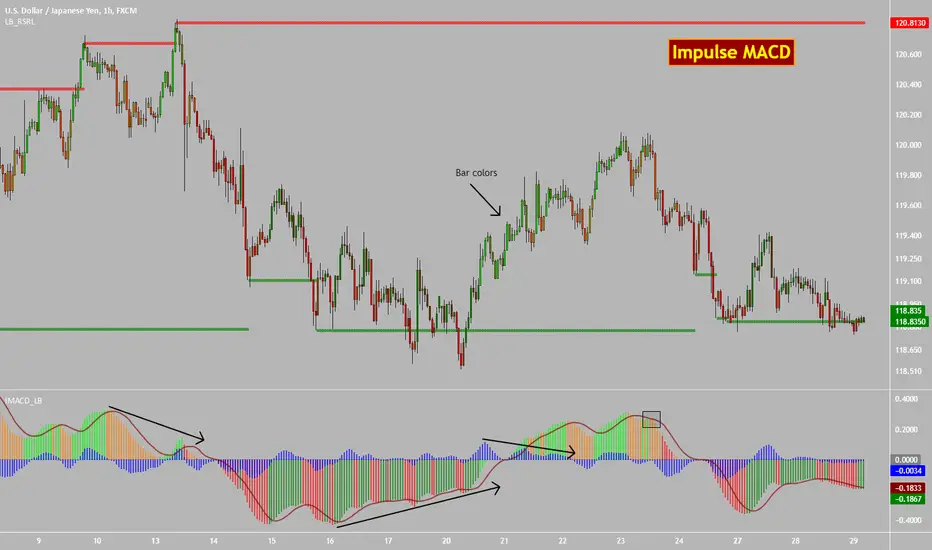
Impulse MACD [LazyBear]Impulse MACD is a modified MACD, formed by filtering out the values in a MA range (region between MAs of high and low), thereby reducing whipsaw typical in a sideways market. This is usually plotted as histogram. This also plots the traditional histogram (MACD - Signal), to help in finding entries/exits.
Use this like a traditional MACD (Zero line crossing or Signal crossing).
Colors legend:
Impulse MACD: Possible colors => Lime / Green / Orange / Red, based on the ImpulseMACD position with respect to MidLine and Signal.
Impulse MACD Signal: Maroon line.
Blue histogram: (ImpulseMACD - Signal).
List of my public indicators : bit.ly
List of my app-store indicators : blog.tradingview.com
Range Identifier [LazyBear] ---- May 05 2015 -----
Added support for filtered ranges:
RID V3 : pastebin.com
RIDv3 has full backward compatibility (!?), meaning all my descriptions below still apply for V3.
-- In addition, I have added a NON-OVERLAY mode, which can be put in its own pane, that shows the number of bars in the current range.
-- in Overlay mode, you can switch on/off filtering ranges based on the bar count.
Sample chart:
---- April 30 2015 -----
Updated the source to show a connected Midline only when ConnectRanges option is enabled.
Updated src: pastebin.com
Sample chart:
---- Original Desc ----
This is a simple indicator that highlights the price ranges. Very helpful in determining a breakout.
There are many ways to incorporate this in to your strategy. One simple idea could be to buy if the price breaks above a range, when above the specified EMA, and to SELL when it breaks down from a range below the EMA.
All options are configurable. Alerts can be setup using the specified plot names.
By default it shows only the ranges, but can be configured to show the full "channel". Chart below shows connected ranges with highlights ON.
Range highlighting can be turned OFF. Chart below shows that:
Note for the pine coders:
As you probably noticed in the charts above, single range is showing 2 colors(red/green). Fill() doesn't accept a series for colors, so I worked around this using two fill() statements with a moving DUMMY line, to get this mixed color effect.
List of my public indicators: bit.ly
List of my app-store indicators: blog.tradingview.com

JMA RSX Clone [LazyBear]RSX is a "noise free" version of RSI, with no added lag. This is a port of a clone to Pine.
Use this indicator just like RSI. I have set the default length to 14, feel free to experiment. You can reduce length with out worrying about jaggedness.
Options page has all the configurable parameters. You can use the plot names to setup alerts.
I have couple of more indicators built using this, will post them later. Let me know what you think about this indicator.
RSX Clone compared to normal RSI:
Smoothness helps a lot in identifying the divergences correctly:
More info:
www.jurikres.com
List of my public indicators: bit.ly
List of my app-store indicators: blog.tradingview.com

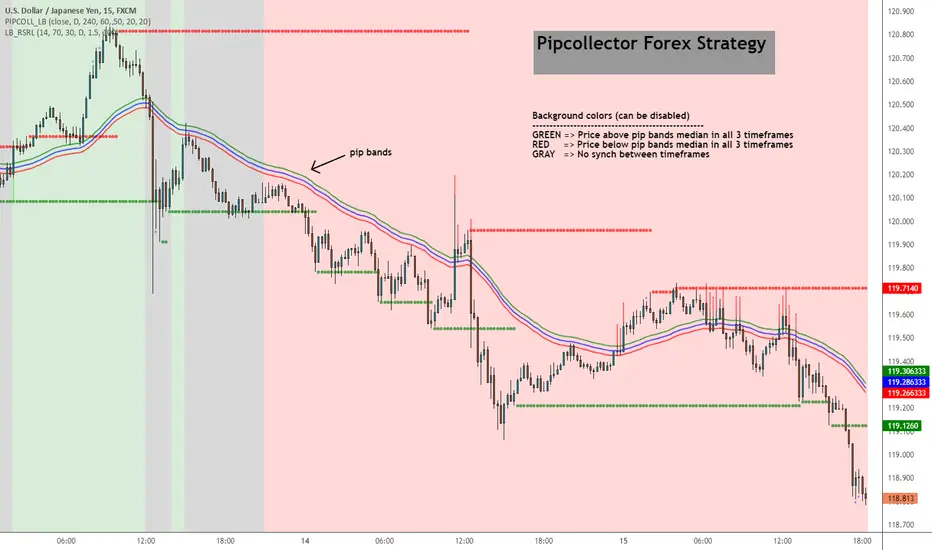
Pip collector [LazyBear]A simple but effective Forex strategy requested by user @pipcollector.
Suggested chart timeframe is 5mins.
Indicator marks potential long/short entries based on the following conditions:
LONG
------
Price above pip median ema on daily, 4 hour and 1 hour timeframe. These 3 timeframes and median EMA lengths are configurable.
Background color is set to GREEN (if option is enabled).
As soon as price touches or crosses the median ema, a GREEN arrow is shown to mark potential long.
SHORT
------
Price below pip median ema on daily, 4 hour and 1 hour timeframe. These 3 timeframes and median EMA lengths are configurable.
Background color is set to RED (if option is enabled).
As soon as price touches or crosses the median ema, a RED arrow is shown to mark potential short.
NO SETUP
-----------
Moving averages do not align on the 3 timeframes.
Background color is set to GRAY (if option is enabled)
I have noticed that this works well on other instruments too (anything trending), also on higher time frames. Feel free to leave any questions/comments on this below.
List of my public indicators: bit.ly
List of my app-store indicators: blog.tradingview.com
Belkhayate Timing [LazyBear]--- Update April 11, 2015 ----
I have merged in @TheMighyChicken's code (Thanks!) and added some more options. Updated source here - pastebin.com
Changes:
--------------
- Switch between plain candles and colored oscillator candles.
- Switch between candles and plain oscillator view.
--- Original Description ---
Belkhayate Timing, by Mostafa Belkhayate, is very famous in the Forex groups. This is a port from one of the MT4 versions available. If you have used this in other platforms, do let me know if this looks compared to those.
The usage is similar to that of ValueChart (). The middle area is the centroid or neutral area, the shaded regions (red/green) are extreme and beyond those are AlertZones. This seems to be used in conjunction with his other indicators, but, in my limited testing, I have seen this give a lot of good signals, especially on divergences.
Indicator allows coloring bars based on the oscillator position or show oscillator histogram (Check the options page).
Histogram=ON:
No Oscillator Smoothing:
@TheMightyChicken Can you do your candle magic on this oscillator too, just like you did for ValueChart? :)
More Info:
www.forexfactory.com
List of my public indicators: bit.ly
List of my app-store indicators: blog.tradingview.com

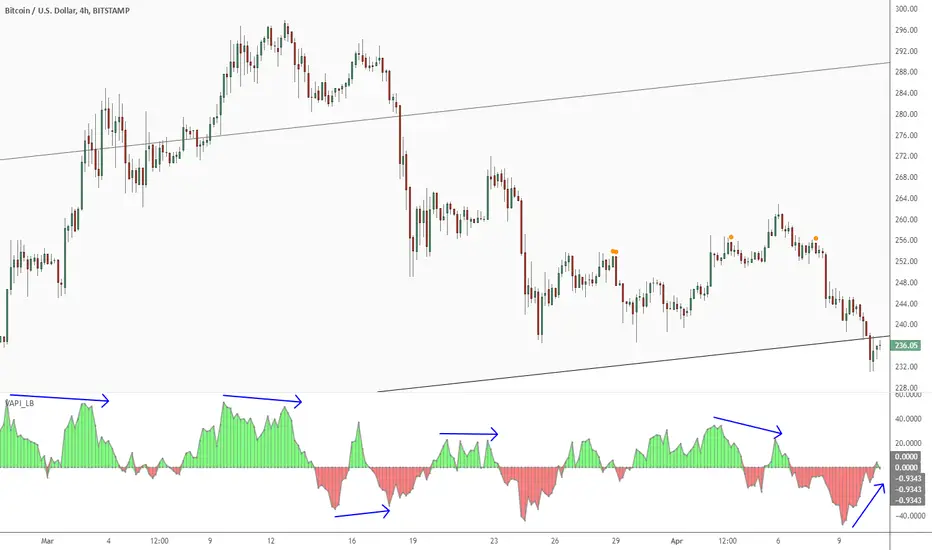
Volume Accumulation Percentage Indicator [LazyBear]Volume Accumulation Percentage Indicator (VAPI) is a variation of the classic volume-accumulation indicators. It uses volume the same way as OBV except that it assigns volume weights based on intraday volatility.
In a positive trend, if the stock price is close to a (local) new high, the VAPI should be at its maximum as well (and vice versa for a negative trend). If the market is looking for a direction, if the price is in the bottom side of his current trading range and if, at the same moment the VAPI osc slopes up, there is accumulation on the stock and that the prices should start to climb. The SELL signal is given when the VAPI decreases (distribution). Divergences are usually very effective too.
Tuning the "length" parameter may be needed for your instrument (default is 10), do let me know if you find a different value to be optimal for majority of instruments.
List of my public indicators: bit.ly
List of my app-store indicators: blog.tradingview.com
UCS_TTM - Reversion BandsOk, Here we go - Version 1 of TTM Reversion Band goes live.
Link to TTM Reversion Band - www.tradethemarkets.com
Link to TTM Reversion Band Guide - kb.simplertrading.com
John Carters Mastering the trade - www.amazon.com
For the amount of information this has, the price tag is not hefty.
John's RTM Chapter Synopsis - www.tradethemarkets.com
What did I modify?
1. Automated the Daily + and Intraday settings. So Switching to intraday will change the setting automatically.
2. Added text callouts for RTM condition
a. John Carter's Indicator
b. Slope Based (my addition).
Future Improvement Planned.
1. Will Convert this into a system based on John's Indicator from TS.
2. Custom Options for Slope and MA setting for Trade filter.

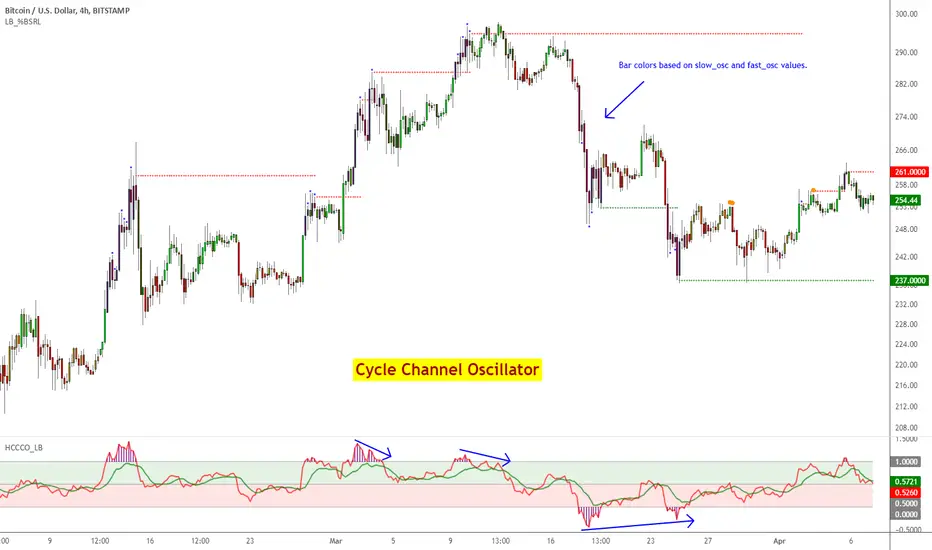
Cycle Channel Oscillator [LazyBear]Here's an oscillator derived from my previous script, Cycle Channel Clone ().
There are 2 oscillator plots - fast & slow. Fast plot shows the price location with in the medium term channel, while slow plot shows the location of short term midline of cycle channel with respect to medium term channel.
Usage of this is similar to %b oscillator. The slow plot can be considered as the signal line.
Bar colors can be enabled via options page. When short plot is above 1.0 or below 0, they are marked purple (both histo and the bar color) to highlight the extreme condition.
This makes use of the default 10/30 values of Cycle Channel, but may need tuning for your instrument.
More info:
List of my free indicators: bit.ly
List of my app-store indicators: blog.tradingview.com (More info: bit.ly)
Hurst Cycle Channel Clone [LazyBear]Cycle Channel is loosely based on Hurst's nested channels. Basic idea is to identify and highlight the shorter cycles, in the context of higher degree cycles.
This indicator plots the shorter term (red) & medium term (green) cycles as channels. Some things to note:
As you can see the red channel keeps moving with in the bounds of green channel. When green breaches red channel, it usually signifies extreme market condition.
Both red & green channels provide support/resistance levels. Also, the green channel provides S/R levels to the inner red channel.
Movement of red channel with reference to green highlights reversal points, reducing momentum et al. For ex., point "(x)" in the chart shows how red channel failed to reach the upper green channel line and highlighted the local top.
Use this just like other bands/channels. I have more indicators derived from this idea, will post them later.
Some more examples:
---------------------------------
MSFT 1M:
DXY 1M:
IWM 1M:
More info:
------------
cyclicwave.blogspot.com
List of my free indicators: bit.ly
List of my app-store indicators: blog.tradingview.com
(Support doc: bit.ly)

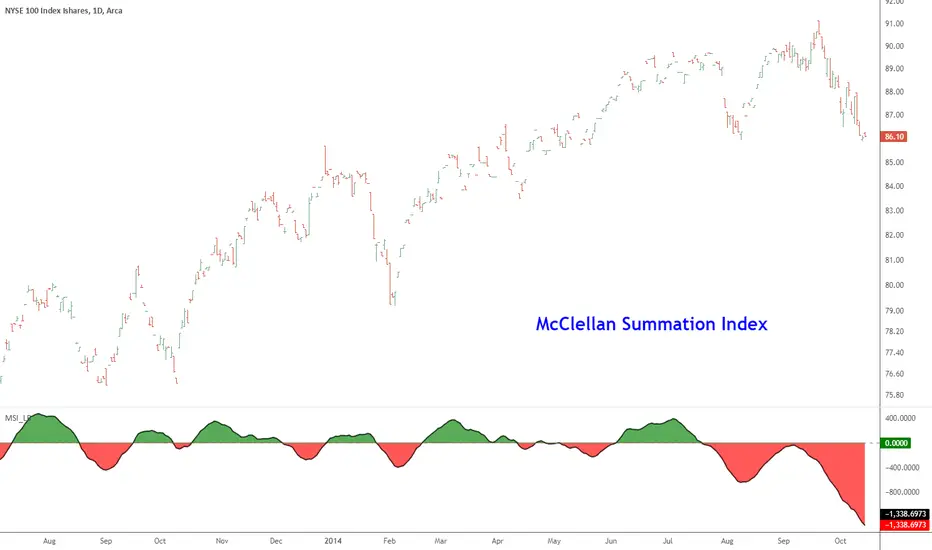
McClellan Summation Index [LazyBear]McClellan Summation Index is a breadth indicator derived from McClellan Oscillator ().
The Summation Index is simply a running total of the McClellan Oscillator values. Even though it is called a Summation Index, the indicator is really an oscillator that fluctuates above/below zero. As such, signals can be derived from bullish/bearish divergences, directional movement and centerline crossovers. A moving average can also be applied to identify upturns and downturns.
Indicator uses the advancing/declining stocks from NYSE by default, but you can change them to any market in the options dialog.
More info:
- www.mcoscillator.com
- stockcharts.com
Complete list of my indicators:
docs.google.com
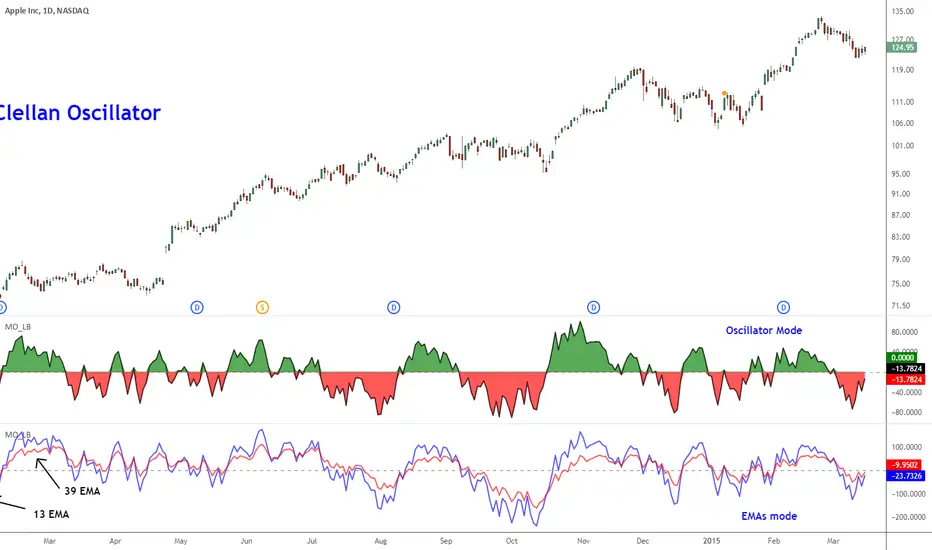
McClellan Oscillator [LazyBear]Developed by Sherman and Marian McClellan, the McClellan Oscillator is a breadth indicator derived from Net Advances, the number of advancing issues less the number of declining issues. Subtracting the 39-day exponential moving average of Net Advances from the 19-day exponential moving average of Net Advances forms the oscillator.
As the formula reveals, the McClellan Oscillator is a momentum indicator that works similar to MACD.
McClellan Oscillator signals can be generated with breadth thrusts, centerline crossovers, overall levels and divergences.
I have added the following options:
- Can choose Advancing/Declining issues of any market. Default is NYSE.
- Can show the EMAs and/or oscillator.
- Ratio Adjusted Calculation mode (as explained in the stockcharts link below) or default mode.
- Can use custom timeframe. Default is chart timeframe.
More info:
stockcharts.com
Complete list of my indicators:
docs.google.com
Thanks @mpinky for pointing out the StockCharts version of this oscillator.