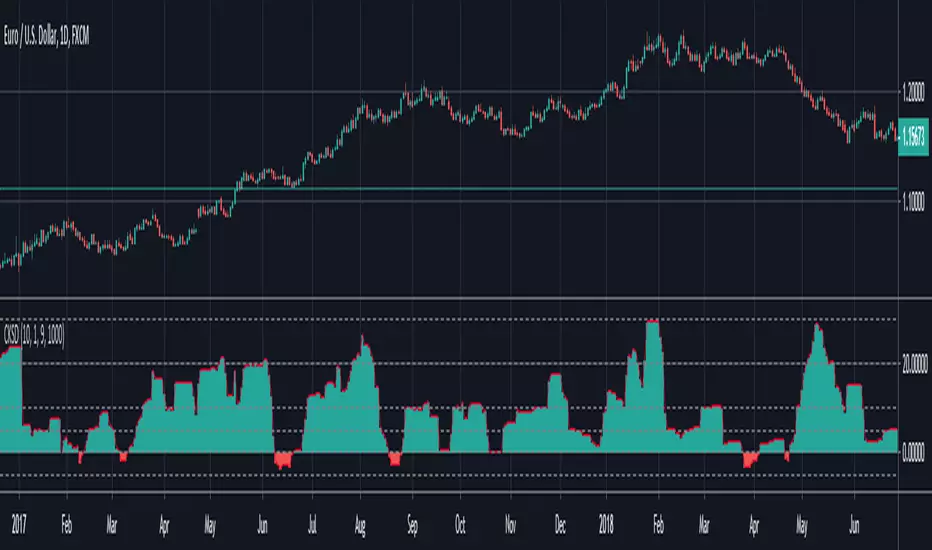
CKSDHi. It's simply histogram that shows divergence between the lines of the Chande Kroll Stop ind (built-in TradingView ind). I noticed that the lines intersect or are very close to each other if the volatility decreases. You can use MA like the main line or just 5, 10 lines how I do. Sorry for code Im not a programmer
Kroll
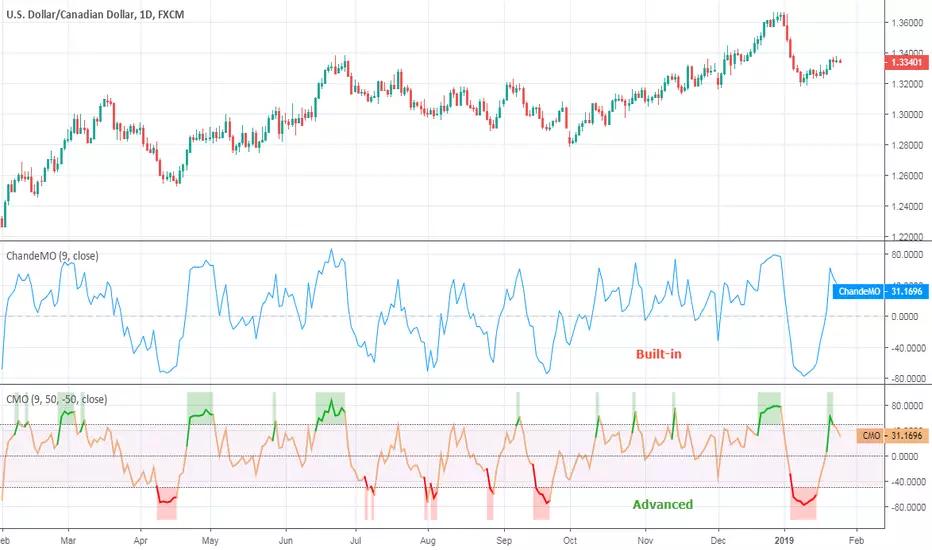
Chande Momentum OscillatorChande Momentum Oscillator script.
This indicator was developed and described by Tushar S. Chande and Stanley Kroll in their book "The New Technical Trader" (1994, Chapter 5: New Momentum Oscillators).
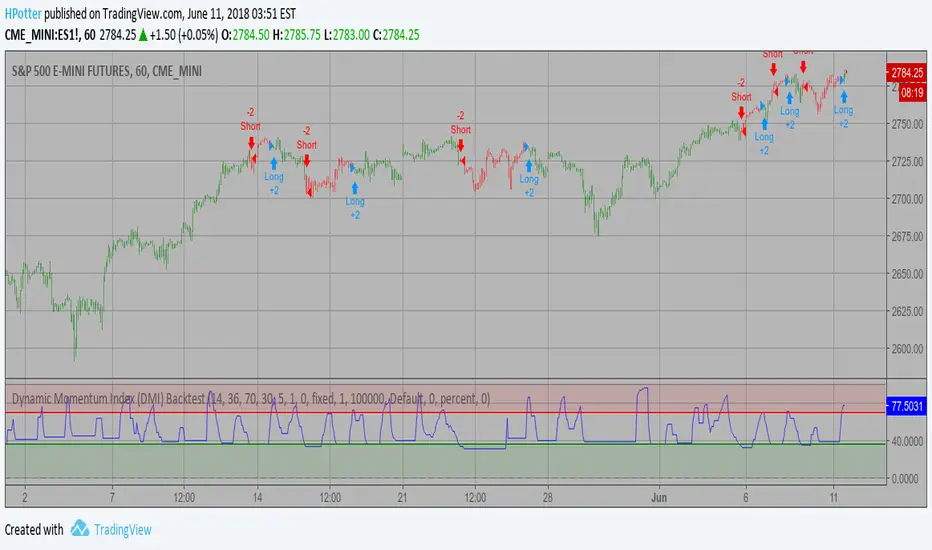
Dynamic Momentum Index (DMI) Backtest This indicator plots Dynamic Momentum Index indicator. The Dynamic Momentum
Index (DMI) was developed by Tushar Chande and Stanley Kroll. The indicator
is covered in detail in their book The New Technical Trader.
The DMI is identical to Welles Wilder`s Relative Strength Index except the
number of periods is variable rather than fixed. The variability of the time
periods used in the DMI is controlled by the recent volatility of prices.
The more volatile the prices, the more sensitive the DMI is to price changes.
In other words, the DMI will use more time periods during quiet markets, and
less during active markets. The maximum time periods the DMI can reach is 30
and the minimum is 3. This calculation method is similar to the Variable
Moving Average, also developed by Tushar Chande.
The advantage of using a variable length time period when calculating the RSI
is that it overcomes the negative effects of smoothing, which often obscure short-term moves.
The volatility index used in controlling the time periods in the DMI is based
on a calculation using a five period standard deviation and a ten period average
of the standard deviation.
You can change long to short in the Input Settings
WARNING:
- For purpose educate only
- This script to change bars colors.