UT Bot + LinReg Candles (Dual Sensitivity)
Script Description:
This indicator combines the popular UT Bot Alerts system with Linear Regression Candles (open source) for enhanced trend detection and trading signals in one singel script. The UT Bot features independent, then 2 x ATR sensitivity and periods controls for buy and sell signals, allowing you to fine-tune entries and exits to match your strategy. The script also overlays colored Linear Regression Candles with an optional signal line, helping you visually identify trend strength and direction. All calculations are performed on standard chart prices (no Heikin Ashi). Suitable for all asset classes and timeframes.
Eample setting for usdjpy 5 min chart for repeated buy and sell singnals based on trend:
BUY ATR period 300 multiplier 1
SELL ATR period 1 multiplier 2
Disclaimer:
This script is for informational and educational purposes only. It is not financial advice. Use at your own risk; the author assumes no responsibility for any trading results or losses.
Credits goes to to Ugurvu for linreg candles and quantnomad for UT Bot alerts that make this script possible.
Author: Patrick
Linreg

Multi-Anchored Linear Regression Channels [TANHEF]█ Overview:
The 'Multi-Anchored Linear Regression Channels ' plots multiple dynamic regression channels (or bands) with unique selectable calculation types for both regression and deviation. It leverages a variety of techniques, customizable anchor sources to determine regression lengths, and user-defined criteria to highlight potential opportunities.
Before getting started, it's worth exploring all sections, but make sure to review the Setup & Configuration section in particular. It covers key parameters like anchor type, regression length, bias, and signal criteria—essential for aligning the tool with your trading strategy.
█ Key Features:
⯁ Multi-Regression Capability:
Plot up to three distinct regression channels and/or bands simultaneously, each with customizable anchor types to define their length.
⯁ Regression & Deviation Methods:
Regressions Types:
Standard: Uses ordinary least squares to compute a simple linear trend by averaging the data and deriving a slope and endpoints over the lookback period.
Ridge: Introduces L2 regularization to stabilize the slope by penalizing large coefficients, which helps mitigate multicollinearity in the data.
Lasso: Uses L1 regularization through soft-thresholding to shrink less important coefficients, yielding a simpler model that highlights key trends.
Elastic Net: Combines L1 and L2 penalties to balance coefficient shrinkage and selection, producing a robust weighted slope that handles redundant predictors.
Huber: Implements the Huber loss with iteratively reweighted least squares (IRLS) and EMA-style weights to reduce the impact of outliers while estimating the slope.
Least Absolute Deviations (LAD): Reduces absolute errors using iteratively reweighted least squares (IRLS), yielding a slope less sensitive to outliers than squared-error methods.
Bayesian Linear: Merges prior beliefs with weighted data through Bayesian updating, balancing the prior slope with data evidence to derive a probabilistic trend.
Deviation Types:
Regressive Linear (Reverse): In reverse order (recent to oldest), compute weighted squared differences between the data and a line defined by a starting value and slope.
Progressive Linear (Forward): In forward order (oldest to recent), compute weighted squared differences between the data and a line defined by a starting value and slope.
Balanced Linear: In forward order (oldest to newest), compute regression, then pair to source data in reverse order (newest to oldest) to compute weighted squared differences.
Mean Absolute: Compute weighted absolute differences between each data point and its regression line value, then aggregate them to yield an average deviation.
Median Absolute: Determine the weighted median of the absolute differences between each data point and its regression line value to capture the central tendency of deviations.
Percent: Compute deviation as a percentage of a base value by multiplying that base by the specified percentage, yielding symmetric positive and negative deviations.
Fitted: Compare a regression line with high and low series values by computing weighted differences to determine the maximum upward and downward deviations.
Average True Range: Iteratively compute the weighted average of absolute differences between the data and its regression line to yield an ATR-style deviation measure.
Bias:
Bias: Applies EMA or inverse-EMA style weighting to both Regression and/or Deviation, emphasizing either recent or older data.
⯁ Customizable Regression Length via Anchors:
Anchor Types:
Fixed: Length.
Bar-Based: Bar Highest/Lowest, Volume Highest/Lowest, Spread Highest/Lowest.
Correlation: R Zero, R Highest, R Lowest, R Absolute.
Slope: Slope Zero, Slope Highest, Slope Lowest, Slope Absolute.
Indicator-Based: Indicators Highest/Lowest (ADX, ATR, BBW, CCI, MACD, RSI, Stoch).
Time-Based: Time (Day, Week, Month, Quarter, Year, Decade, Custom).
Session-Based: Session (Tokyo, London, New York, Sydney, Custom).
Event-Based: Earnings, Dividends, Splits.
External: Input Source Highest/Lowest.
Length Selection:
Maximum: The highest allowed regression length (also fixed value of “Length” anchor).
Minimum: The shortest allowed length, ensuring enough bars for a valid regression.
Step: The sampling interval (e.g., 1 checks every bar, 2 checks every other bar, etc.). Increasing the step reduces the loading time, most applicable to “Slope” and “R” anchors.
Adaptive lookback:
Adaptive Lookback: Enable to display regression regardless of too few historical bars.
⯁ Selecting Bias:
Bias applies separately to regression and deviation.
Positive values emphasize recent data (EMA-style), negative invert, and near-zero maintains balance. (e.g., a length 100, bias +1 gives the newest price ~7× more weight than the oldest).
It's best to apply bias to both (regression and deviation) or just the deviation. Biasing only regression may distort deviation visually, while biasing both keeps their relationship intuitive. Using bias only for deviation scales it without altering regression, offering unique analysis.
⯁ Scale Awareness:
Supports linear and logarithmic price scaling, the regression and deviations adjust accordingly.
⯁ Signal Generation & Alerts:
Customizable entry/exit signals and alerts, detailed in the dedicated section below.
⯁ Visual Enhancements & Real-World Examples:
Optional on-chart table display summarizing regression input criteria (display type, anchor type, source, regression type, regression bias, deviation type, deviation bias, deviation multiplier) and key calculated metrics (regression length, slope, Pearson’s R, percentage position within deviations, etc.) for quick reference.
█ Understanding R (Pearson Correlation Coefficient):
Pearson’s R gauges data alignment to a straight-line trend within the regression length:
Range: R varies between –1 and +1.
R = +1 → Perfect positive correlation (strong uptrend).
R = 0 → No linear relationship detected.
R = –1 → Perfect negative correlation (strong downtrend).
This script uses Pearson’s R as an anchor, adjusting regression length to target specific R traits. Strong R (±1) follows the regression channel, while weak R (0) shows inconsistency.
█ Understanding the Slope:
The slope is the direction and rate at which the regression line rises or falls per bar:
Positive Slope (>0): Uptrend – Steeper means faster increase.
Negative Slope (<0): Downtrend – Steeper means sharper drop.
Zero or Near-Zero Slope: Sideways – Indicating range-bound conditions.
This script uses highest and lowest slope as an anchor, where extremes highlight strong moves and trend lines, while values near zero indicate sideways action and possible support/resistance.
█ Setup & Configuration:
Whether you’re new to this script or want to quickly adjust all critical parameters, the panel below shows the main settings available. You can customize everything from the anchor type and maximum length to the bias, signal conditions, and more.
Scale (select Log Scale for logarithmic, otherwise linear scale).
Display (regression channel and/or bands).
Anchor (how regression length is determined).
Length (control bars analyzed):
• Max – Upper limit.
• Min – Prevents regression from becoming too short.
• Step – Controls scanning precision; increasing Step reduces load time.
Regression:
• Type – Calculation method.
• Bias – EMA-style emphasis (>0=new bars weighted more; <0=old bars weighted more).
Deviation:
• Type – Calculation method.
• Bias – EMA-style emphasis (>0=new bars weighted more; <0=old bars weighted more).
• Multiplier - Adjusts Upper and Lower Deviation.
Signal Criteria:
• % (Price vs Deviation) – (0% = lower deviation, 50% = regression, 100% = upper deviation).
• R – (0 = no correlation, ±1 = perfect correlation; >0 = +slope, <0 = -slope).
Table (analyze table of input settings, calculated results, and signal criteria).
Adaptive Lookback (display regression while too few historical bars).
Multiple Regressions (steps 2 to 7 apply to #1, #2, and #3 regressions).
█ Signal Generation & Alerts:
The script offers customizable entry and exit signals with flexible criteria and visual cues (background color, dots, or triangles). Alerts can also be triggered for these opportunities.
Percent Direction Criteria:
(0% = lower deviation, 50% = regression line, 100% = upper deviation)
Above %: Triggers if price is above a specified percent of the deviation channel.
Below %: Triggers if price is below a specified percent of the deviation channel.
(Blank): Ignores the percent‐based condition.
Pearson's R (Correlation) Direction Criteria:
(0 = no correlation, ±1 = perfect correlation; >0 = positive slope, <0 = negative slope)
Above R / Below R: Compares the correlation to a threshold.
Above│R│ / Below│R│: Uses absolute correlation to focus on strength, ignoring direction.
Zero to R: Checks if R is in the 0-to-threshold range.
(Blank): Ignores correlation-based conditions.
█ User Tips & Best Practices:
Choose an anchor type that suits your strategy, “Bar Highest/Lowest” automatically spots commonly used regression zones, while “│R│ Highest” targets strong linear trends.
Consider enabling or disabling the Adaptive Lookback feature to ensure you always have a plotted regression if your chart doesn’t meet the maximum-length requirement.
Use a small Step size (1) unless relying on R-correlation or slope-based anchors as the are time-consuming to calculate. Larger steps speed up calculations but reduce precision.
Fine-tune settings such as lookback periods, regression bias, and deviation multipliers, or trend strength. Small adjustments can significantly affect how channels and signals behave.
To reduce loading time , show only channels (not bands) and disable signals, this limits calculations to the last bar and supports more extreme criteria.
Use the table display to monitor anchor type, calculated length, slope, R value, and percent location at a glance—especially if you have multiple regressions visible simultaneously.
█ Conclusion:
With its blend of advanced regression techniques, flexible deviation options, and a wide range of anchor types, this indicator offers a highly adaptable linear regression channeling system. Whether you're anchoring to time, price extremes, correlation, slope, or external events, the tool can be shaped to fit a variety of strategies. Combined with customizable signals and alerts, it may help highlight areas of confluence and support a more structured approach to identifying potential opportunities.

LinearRegressionLibrary "LinearRegression"
Calculates a variety of linear regression and deviation types, with optional emphasis weighting. Additionally, multiple of slope and Pearson’s R calculations.
calcSlope(_src, _len, _condition)
Calculates the slope of a linear regression over the specified length.
Parameters:
_src (float) : (float) The source data.
_len (int) : (int) The length of the lookback period for the linear regression.
_condition (bool) : (bool) Flag to enable calculation. Set to true to calculate on every bar; otherwise, set to barstate.islast for efficiency.
Returns: (float) The slope of the linear regression.
calcReg(_src, _len, _condition)
Calculates a basic linear regression, returning y1, y2, slope, and average.
Parameters:
_src (float) : (float) The source data series.
_len (int) : (int) The length of the lookback period.
_condition (bool) : (bool) Flag to enable calculation (true = calculate).
Returns: (float ) An array of 4 values: .
calcRegStandard(_src, _len, _emphasis, _condition)
Calculates an Standard linear regression with optional emphasis.
Parameters:
_src (float) : (series float) The source data series.
_len (int) : (int) The length of the lookback period.
_emphasis (float) : (float) The emphasis factor: 0 for equal weight; >0 emphasizes recent bars; <0 emphasizes older bars.
_condition (bool) : (bool) Flag to enable calculation (true = calculate).
Returns: (float ) .
calcRegRidge(_src, _len, lambda, _emphasis, _condition)
Calculates a ridge regression with optional emphasis.
Parameters:
_src (float) : (float) The source data series.
_len (int) : (int) The length of the lookback period.
lambda (float) : (float) The ridge regularization parameter.
_emphasis (float) : (float) The emphasis factor: 0 for equal weight; >0 emphasizes recent bars; <0 emphasizes older bars.
_condition (bool) : (bool) Flag to enable calculation (true = calculate).
Returns: (float ) .
calcRegLasso(_src, _len, lambda, _emphasis, _condition)
Calculates a Lasso regression with optional emphasis.
Parameters:
_src (float) : (float) The source data series.
_len (int) : (int) The length of the lookback period.
lambda (float) : (float) The Lasso regularization parameter.
_emphasis (float) : (float) The emphasis factor: 0 for equal weight; >0 emphasizes recent bars; <0 emphasizes older bars.
_condition (bool) : (bool) Flag to enable calculation (true = calculate).
Returns: (float ) .
calcElasticNetLinReg(_src, _len, lambda1, lambda2, _emphasis, _condition)
Calculates an Elastic Net regression with optional emphasis.
Parameters:
_src (float) : (float) The source data series.
_len (int) : (int) The length of the lookback period.
lambda1 (float) : (float) L1 regularization parameter (Lasso).
lambda2 (float) : (float) L2 regularization parameter (Ridge).
_emphasis (float) : (float) Emphasis factor: 0 for equal weight; >0 emphasizes recent bars; <0 emphasizes older bars.
_condition (bool) : (bool) Flag to enable calculation (true = calculate).
Returns: (float ) .
calcRegHuber(_src, _len, delta, iterations, _emphasis, _condition)
Calculates a Huber regression using Iteratively Reweighted Least Squares (IRLS).
Parameters:
_src (float) : (float) The source data series.
_len (int) : (int) The length of the lookback period.
delta (float) : (float) Huber threshold parameter.
iterations (int) : (int) Number of IRLS iterations.
_emphasis (float) : (float) Emphasis factor: 0 for equal weight; >0 emphasizes recent bars; <0 emphasizes older bars.
_condition (bool) : (bool) Flag to enable calculation (true = calculate).
Returns: (float ) .
calcRegLAD(_src, _len, iterations, _emphasis, _condition)
Calculates a Least Absolute Deviations (LAD) regression via IRLS.
Parameters:
_src (float) : (float) The source data series.
_len (int) : (int) The length of the lookback period.
iterations (int) : (int) Number of IRLS iterations for LAD.
_emphasis (float) : (float) Emphasis factor: 0 for equal weight; >0 emphasizes recent bars; <0 emphasizes older bars.
_condition (bool) : (bool) Flag to enable calculation (true = calculate).
Returns: (float ) .
calcRegBayesian(_src, _len, priorMean, priorSpan, sigma, _emphasis, _condition)
Calculates a Bayesian linear regression with optional emphasis.
Parameters:
_src (float) : (float) The source data series.
_len (int) : (int) The length of the lookback period.
priorMean (float) : (float) The prior mean for the slope.
priorSpan (float) : (float) The prior variance (or span) for the slope.
sigma (float) : (float) The assumed standard deviation of residuals.
_emphasis (float) : (float) Emphasis factor: 0 for equal weight; >0 emphasizes recent bars; <0 emphasizes older bars.
_condition (bool) : (bool) Flag to enable calculation (true = calculate).
Returns: (float ) .
calcRFromLinReg(_src, _len, _slope, _average, _y1, _condition)
Calculates the Pearson correlation coefficient (R) based on linear regression parameters.
Parameters:
_src (float) : (float) The source data.
_len (int) : (int) The length of the lookback period.
_slope (float) : (float) The slope of the linear regression.
_average (float) : (float) The average value of the source data series.
_y1 (float) : (float) The starting point (y-intercept of the oldest bar) for the linear regression.
_condition (bool) : (bool) Flag to enable calculation. Set to true to calculate on every bar; otherwise, set to barstate.islast for efficiency.
Returns: (float) The Pearson correlation coefficient (R) adjusted for the direction of the slope.
calcRFromSource(_src, _len, _condition)
Calculates the correlation coefficient (R) using a specified length and source data.
Parameters:
_src (float) : (float) The source data.
_len (int) : (int) The length of the lookback period.
_condition (bool) : (bool) Flag to enable calculation. Set to true to calculate on every bar; otherwise, set to barstate.islast for efficiency.
Returns: (float) The correlation coefficient (R).
calcSlopeLengthZero(_src, _len, _minLen, _step, _condition)
Identifies the length at which the slope is flattest (closest to zero).
Parameters:
_src (float) : (float) The source data.
_len (int) : (int) The maximum lookback length to consider (minimum of 2).
_minLen (int) : (int) The minimum length to start from (cannot exceed the max length).
_step (int) : (int) The increment step for lengths.
_condition (bool) : (bool) Flag to enable calculation. Set to true to calculate on every bar; otherwise, set to barstate.islast.
Returns: (int) The length at which the slope is flattest.
calcSlopeLengthHighest(_src, _len, _minLen, _step, _condition)
Identifies the length at which the slope is highest.
Parameters:
_src (float) : (float) The source data.
_len (int) : (int) The maximum lookback length (minimum of 2).
_minLen (int) : (int) The minimum length to start from.
_step (int) : (int) The step for incrementing lengths.
_condition (bool) : (bool) Flag to enable calculation. Set to true to calculate on every bar; otherwise, set to barstate.islast.
Returns: (int) The length at which the slope is highest.
calcSlopeLengthLowest(_src, _len, _minLen, _step, _condition)
Identifies the length at which the slope is lowest.
Parameters:
_src (float) : (float) The source data.
_len (int) : (int) The maximum lookback length (minimum of 2).
_minLen (int) : (int) The minimum length to start from.
_step (int) : (int) The step for incrementing lengths.
_condition (bool) : (bool) Flag to enable calculation. Set to true to calculate on every bar; otherwise, set to barstate.islast.
Returns: (int) The length at which the slope is lowest.
calcSlopeLengthAbsolute(_src, _len, _minLen, _step, _condition)
Identifies the length at which the absolute slope value is highest.
Parameters:
_src (float) : (float) The source data.
_len (int) : (int) The maximum lookback length (minimum of 2).
_minLen (int) : (int) The minimum length to start from.
_step (int) : (int) The step for incrementing lengths.
_condition (bool) : (bool) Flag to enable calculation. Set to true to calculate on every bar; otherwise, set to barstate.islast.
Returns: (int) The length at which the absolute slope value is highest.
calcRLengthZero(_src, _len, _minLen, _step, _condition)
Identifies the length with the lowest absolute R value.
Parameters:
_src (float) : (float) The source data.
_len (int) : (int) The maximum lookback length (minimum of 2).
_minLen (int) : (int) The minimum length to start from.
_step (int) : (int) The step for incrementing lengths.
_condition (bool) : (bool) Flag to enable calculation. Set to true to calculate on every bar; otherwise, set to barstate.islast.
Returns: (int) The length with the lowest absolute R value.
calcRLengthHighest(_src, _len, _minLen, _step, _condition)
Identifies the length with the highest R value.
Parameters:
_src (float) : (float) The source data.
_len (int) : (int) The maximum lookback length (minimum of 2).
_minLen (int) : (int) The minimum length to start from.
_step (int) : (int) The step for incrementing lengths.
_condition (bool) : (bool) Flag to enable calculation. Set to true to calculate on every bar; otherwise, set to barstate.islast.
Returns: (int) The length with the highest R value.
calcRLengthLowest(_src, _len, _minLen, _step, _condition)
Identifies the length with the lowest R value.
Parameters:
_src (float) : (float) The source data.
_len (int) : (int) The maximum lookback length (minimum of 2).
_minLen (int) : (int) The minimum length to start from.
_step (int) : (int) The step for incrementing lengths.
_condition (bool) : (bool) Flag to enable calculation. Set to true to calculate on every bar; otherwise, set to barstate.islast.
Returns: (int) The length with the lowest R value.
calcRLengthAbsolute(_src, _len, _minLen, _step, _condition)
Identifies the length with the highest absolute R value.
Parameters:
_src (float) : (float) The source data.
_len (int) : (int) The maximum lookback length (minimum of 2).
_minLen (int) : (int) The minimum length to start from.
_step (int) : (int) The step for incrementing lengths.
_condition (bool) : (bool) Flag to enable calculation. Set to true to calculate on every bar; otherwise, set to barstate.islast.
Returns: (int) The length with the highest absolute R value.
calcDevReverse(_src, _len, _slope, _y1, _inputDev, _emphasis, _condition)
Calculates the regressive linear deviation in reverse order, with optional emphasis on recent data.
Parameters:
_src (float) : (float) The source data.
_len (int) : (int) The length of the lookback period.
_slope (float) : (float) The slope of the linear regression.
_y1 (float) : (float) The y-intercept (oldest bar) of the linear regression.
_inputDev (float) : (float) The input deviation multiplier.
_emphasis (float) : (float) Emphasis factor: 0 for equal weight; >0 emphasizes recent bars; <0 emphasizes older bars.
_condition (bool) : (bool) Flag to enable calculation (true = calculate).
Returns: A 2-element tuple: .
calcDevForward(_src, _len, _slope, _y1, _inputDev, _emphasis, _condition)
Calculates the progressive linear deviation in forward order (oldest to most recent bar), with optional emphasis.
Parameters:
_src (float) : (float) The source data array, where _src is oldest and _src is most recent.
_len (int) : (int) The length of the lookback period.
_slope (float) : (float) The slope of the linear regression.
_y1 (float) : (float) The y-intercept of the linear regression (value at the most recent bar, adjusted by slope).
_inputDev (float) : (float) The input deviation multiplier.
_emphasis (float) : (float) Emphasis factor: 0 for equal weight; >0 emphasizes recent bars; <0 emphasizes older bars.
_condition (bool) : (bool) Flag to enable calculation (true = calculate).
Returns: A 2-element tuple: .
calcDevBalanced(_src, _len, _slope, _y1, _inputDev, _emphasis, _condition)
Calculates the balanced linear deviation with optional emphasis on recent or older data.
Parameters:
_src (float) : (float) Source data array, where _src is the most recent and _src is the oldest.
_len (int) : (int) The length of the lookback period.
_slope (float) : (float) The slope of the linear regression.
_y1 (float) : (float) The y-intercept of the linear regression (value at the oldest bar).
_inputDev (float) : (float) The input deviation multiplier.
_emphasis (float) : (float) Emphasis factor: 0 for equal weight; >0 emphasizes recent bars; <0 emphasizes older bars.
_condition (bool) : (bool) Flag to enable calculation (true = calculate).
Returns: A 2-element tuple: .
calcDevMean(_src, _len, _slope, _y1, _inputDev, _emphasis, _condition)
Calculates the mean absolute deviation from a forward-applied linear trend (oldest to most recent), with optional emphasis.
Parameters:
_src (float) : (float) The source data array, where _src is the most recent and _src is the oldest.
_len (int) : (int) The length of the lookback period.
_slope (float) : (float) The slope of the linear regression.
_y1 (float) : (float) The y-intercept (oldest bar) of the linear regression.
_inputDev (float) : (float) The input deviation multiplier.
_emphasis (float) : (float) Emphasis factor: 0 for equal weight; >0 emphasizes recent bars; <0 emphasizes older bars.
_condition (bool) : (bool) Flag to enable calculation (true = calculate).
Returns: A 2-element tuple: .
calcDevMedian(_src, _len, _slope, _y1, _inputDev, _emphasis, _condition)
Calculates the median absolute deviation with optional emphasis on recent data.
Parameters:
_src (float) : (float) The source data array (index 0 = oldest, index _len - 1 = most recent).
_len (int) : (int) The length of the lookback period.
_slope (float) : (float) The slope of the linear regression.
_y1 (float) : (float) The y-intercept (oldest bar) of the linear regression.
_inputDev (float) : (float) The deviation multiplier.
_emphasis (float) : (float) Emphasis factor: 0 for equal weight; >0 emphasizes recent bars; <0 emphasizes older bars.
_condition (bool) : (bool) Flag to enable calculation (true = calculate).
Returns:
calcDevPercent(_y1, _inputDev, _condition)
Calculates the percent deviation from a given value and a specified percentage.
Parameters:
_y1 (float) : (float) The base value from which to calculate deviation.
_inputDev (float) : (float) The deviation percentage.
_condition (bool) : (bool) Flag to enable calculation (true = calculate).
Returns: A 2-element tuple: .
calcDevFitted(_len, _slope, _y1, _emphasis, _condition)
Calculates the weighted fitted deviation based on high and low series data, showing max deviation, with optional emphasis.
Parameters:
_len (int) : (int) The length of the lookback period.
_slope (float) : (float) The slope of the linear regression.
_y1 (float) : (float) The Y-intercept (oldest bar) of the linear regression.
_emphasis (float) : (float) Emphasis factor: 0 for equal weight; >0 emphasizes recent bars; <0 emphasizes older bars.
_condition (bool) : (bool) Flag to enable calculation (true = calculate).
Returns: A 2-element tuple: .
calcDevATR(_src, _len, _slope, _y1, _inputDev, _emphasis, _condition)
Calculates an ATR-style deviation with optional emphasis on recent data.
Parameters:
_src (float) : (float) The source data (typically close).
_len (int) : (int) The length of the lookback period.
_slope (float) : (float) The slope of the linear regression.
_y1 (float) : (float) The Y-intercept (oldest bar) of the linear regression.
_inputDev (float) : (float) The input deviation multiplier.
_emphasis (float) : (float) Emphasis factor: 0 for equal weight; >0 emphasizes recent bars; <0 emphasizes older bars.
_condition (bool) : (bool) Flag to enable calculation (true = calculate).
Returns: A 2-element tuple: .
calcPricePositionPercent(_top, _bot, _src)
Calculates the percent position of a price within a linear regression channel. Top=100%, Bottom=0%.
Parameters:
_top (float) : (float) The top (positive) deviation, corresponding to 100%.
_bot (float) : (float) The bottom (negative) deviation, corresponding to 0%.
_src (float) : (float) The source price.
Returns: (float) The percent position within the channel.
plotLinReg(_len, _y1, _y2, _slope, _devTop, _devBot, _scaleTypeLog, _lineWidth, _extendLines, _channelStyle, _colorFill, _colUpLine, _colDnLine, _colUpFill, _colDnFill)
Plots the linear regression line and its deviations, with configurable styles and fill.
Parameters:
_len (int) : (int) The lookback period for the linear regression.
_y1 (float) : (float) The starting y-value of the regression line.
_y2 (float) : (float) The ending y-value of the regression line.
_slope (float) : (float) The slope of the regression line (used to determine line color).
_devTop (float) : (float) The top deviation to add to the line.
_devBot (float) : (float) The bottom deviation to subtract from the line.
_scaleTypeLog (bool) : (bool) Use a log scale if true; otherwise, linear scale.
_lineWidth (int) : (int) The width of the plotted lines.
_extendLines (string) : (string) How lines should extend (none, left, right, both).
_channelStyle (string) : (string) The style of the channel lines (solid, dashed, dotted).
_colorFill (bool) : (bool) Whether to fill the space between the top and bottom deviation lines.
_colUpLine (color) : (color) Line color when slope is positive.
_colDnLine (color) : (color) Line color when slope is negative.
_colUpFill (color) : (color) Fill color when slope is positive.
_colDnFill (color) : (color) Fill color when slope is negative.

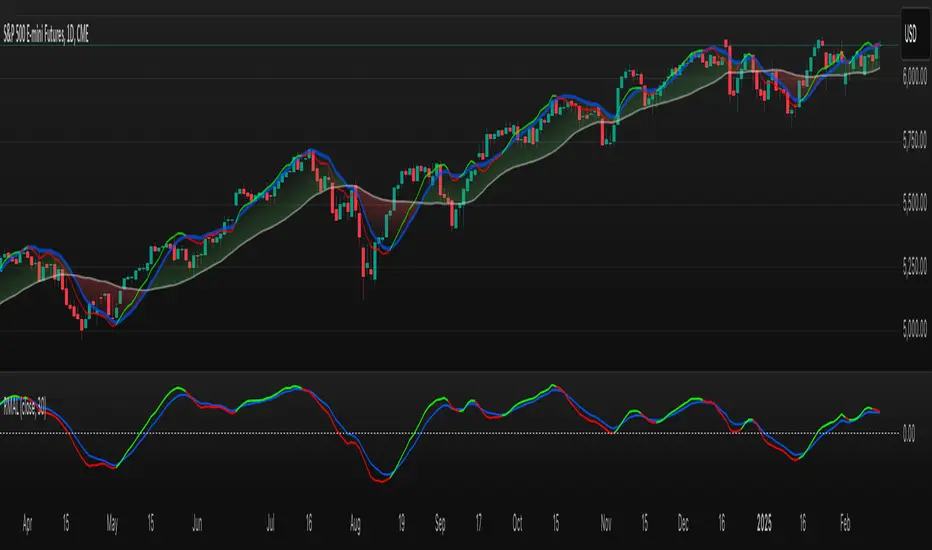
TASC 2025.03 A New Solution, Removing Moving Average Lag█ OVERVIEW
This script implements a novel technique for removing lag from a moving average, as introduced by John Ehlers in the "A New Solution, Removing Moving Average Lag" article featured in the March 2025 edition of TASC's Traders' Tips .
█ CONCEPTS
In his article, Ehlers explains that the average price in a time series represents a statistical estimate for a block of price values, where the estimate is positioned at the block's center on the time axis. In the case of a simple moving average (SMA), the calculation moves the analyzed block along the time axis and computes an average after each new sample. Because the average's position is at the center of each block, the SMA inherently lags behind price changes by half the data length.
As a solution to removing moving average lag, Ehlers proposes a new projected moving average (PMA) . The PMA smooths price data while maintaining responsiveness by calculating a projection of the average using the data's linear regression slope.
The slope of linear regression on a block of financial time series data can be expressed as the covariance between prices and sample points divided by the variance of the sample points. Ehlers derives the PMA by adding this slope across half the data length to the SMA, creating a first-order prediction that substantially reduces lag:
PMA = SMA + Slope * Length / 2
In addition, the article includes methods for calculating predictions of the PMA and the slope based on second-order and fourth-order differences. The formulas for these predictions are as follows:
PredictPMA = PMA + 0.5 * (Slope - Slope ) * Length
PredictSlope = 1.5 * Slope - 0.5 * Slope
Ehlers suggests that crossings between the predictions and the original values can help traders identify timely buy and sell signals.
█ USAGE
This indicator displays the SMA, PMA, and PMA prediction for a specified series in the main chart pane, and it shows the linear regression slope and prediction in a separate pane. Analyzing the difference between the PMA and SMA can help to identify trends. The differences between PMA or slope and its corresponding prediction can indicate turning points and potential trade opportunities.
The SMA plot uses the chart's foreground color, and the PMA and slope plots are blue by default. The plots of the predictions have a green or red hue to signify direction. Additionally, the indicator fills the space between the SMA and PMA with a green or red color gradient based on their differences:
Users can customize the source series, data length, and plot colors via the inputs in the "Settings/Inputs" tab.
█ NOTES FOR Pine Script® CODERS
The article's code implementation uses a loop to calculate all necessary sums for the slope and SMA calculations. Ported into Pine, the implementation is as follows:
pma(float src, int length) =>
float PMA = 0., float SMA = 0., float Slope = 0.
float Sx = 0.0 , float Sy = 0.0
float Sxx = 0.0 , float Syy = 0.0 , float Sxy = 0.0
for count = 1 to length
float src1 = src
Sx += count
Sy += src
Sxx += count * count
Syy += src1 * src1
Sxy += count * src1
Slope := -(length * Sxy - Sx * Sy) / (length * Sxx - Sx * Sx)
SMA := Sy / length
PMA := SMA + Slope * length / 2
However, loops in Pine can be computationally expensive, and the above loop's runtime scales directly with the specified length. Fortunately, Pine's built-in functions often eliminate the need for loops. This indicator implements the following function, which simplifies the process by using the ta.linreg() and ta.sma() functions to calculate equivalent slope and SMA values efficiently:
pma(float src, int length) =>
float Slope = ta.linreg(src, length, 0) - ta.linreg(src, length, 1)
float SMA = ta.sma(src, length)
float PMA = SMA + Slope * length * 0.5
To learn more about loop elimination in Pine, refer to this section of the User Manual's Profiling and optimization page.
Catalyst TrendCatalyst Trend – A Comprehensive Trend and Regime Analyzer
The Catalyst Trend indicator was designed to dynamically and intuitively merge various classic analytical techniques. The goal is to filter out short-term market noise and reveal reliable trend phases or potential turning points. Below is a detailed explanation of its core elements and practical usage.
1. Concept and Idea
Multidimensional Trend Detection
This indicator goes beyond a simple momentum or volatility focus. It factors in multiple measurements to provide a more well-rounded market perspective.
Versatile Indicator Fusion
Linear Regression (LinReg): Multiple LinReg calculations are combined to smooth out price fluctuations and produce a robust trendline—known here as the “Cycle Reduced Line.”
ADX (Average Directional Index): Measures trend strength.
RSI (Relative Strength Index): Flags potential overbought or oversold conditions, in both the current timeframe and a higher timeframe.
ATR (Average True Range): Assesses volatility; used to dynamically adjust calculation lengths.
By weaving these elements together, the indicator adds value beyond simply stacking multiple indicators. It adapts to real-time market conditions, aiming to highlight genuine trends and reduce false signals.
2. Key Functions and Calculations
Dynamic Length & Smoothing
A blend of volatility (ATR), ADX values, and RSI inputs determines how many candles are used in the LinReg calculations and how heavily the data is smoothed.
This allows the indicator to respond promptly during periods of high volatility, while automatically adjusting to filter out unnecessary noise in quieter phases.c
Cycle Reduced Line
The script averages several offset LinReg calculations to produce a cleaner overall signal. Random outliers are thus minimized, making the trend path more visually consistent.
An additional EMA smoothing (“Final Smoothing”) further stabilizes this trendline, reducing the impact of minor price fluctuations.
Channel Bands (Optional)
These bands are derived from the standard deviation of the price residual (the difference between the smoothed price and the trendline).
They highlight potential over-extension zones: the upper band can mark short-term overbought areas, while the lower band might indicate oversold conditions.
Trend and Sideways Determination
Slope Calculation: The slope of the trendline (comparing the current bar to the previous one) helps identify short-term directional shifts.
DX Threshold: Once the ADX surpasses a user-defined threshold and the slope is positive, it may indicate a developing uptrend. Similarly, if the slope is negative and ADX > threshold, it could signal a potential downtrend.
Multi-Level Color Coding
Original Mode: Interpolated colors reflect uptrends, downtrends, and sideways phases, factoring in metrics like ADX and RSI.
Single Color: For a neutral look, the indicator can be displayed in one uniform color.
HTF RSI: This mode uses the higher-timeframe RSI to color the trendline (Long/Short/Neutral), offering a quick gauge of overarching market pressure.
3. Use Cases and Interpretation
Timeframes & Markets
The indicator is versatile and adapts well to different intervals, from 5-minute charts to weekly views.
It can be applied to various markets—crypto, forex, stocks—since volatility and trend strength are universal concepts.
Signal Recognition
Color Swings into a more pronounced upward hue (e.g., green) may signal mounting strength.
Neutral or mixed tones often point to sideways phases, which breakout traders might watch for potential price surges.
A shift to downward colors (e.g., red) may indicate a growing bearish trend.
Channel Bands & Volatility
When the bands spread widely, it’s wise to proceed with caution: abrupt spikes above the upper band or below the lower band can flag rapid short-term extremes.
These bands are more of a reference for potential overextension than a strict buy or sell trigger.
Additional Confirmations
Not a standalone panacea: The Catalyst Trend indicator is an analytical tool, best used alongside other methods such as volume analysis or price action (candlestick patterns, support/resistance levels) to bolster confidence in trading decisions.
4. Practical Tips
Parameter Adjustments
Depending on the market—crypto vs. traditional currency pairs—different ADX, RSI, or smoothing periods may be more effective. Experiment with the settings to tailor the indicator to your preferred timeframe.
Strategic Integration
Trailing Stops: For those riding a trend, the trendline or the channel bands may serve as a reference to trail stop-loss orders.
Trend Confirmation: Using RSI and ADX filters can help traders avoid sideways markets or stay the course when the trend is strong.
5. Important Final Notes
No Guarantee of Profits
No indicator can predict the future. Markets are inherently volatile and often unpredictable.
Responsible Risk Management
Test the indicator in a demo environment or with smaller positions before committing to large trades.

Linear Regression Channel [TradingFinder] Existing Trend Line🔵 Introduction
The Linear Regression Channel indicator is one of the technical analysis tool, widely used to identify support, resistance, and analyze upward and downward trends.
The Linear Regression Channel comprises five main components : the midline, representing the linear regression line, and the support and resistance lines, which are calculated based on the distance from the midline using either standard deviation or ATR.
This indicator leverages linear regression to forecast price changes based on historical data and encapsulates price movements within a price channel.
The upper and lower lines of the channel, which define resistance and support levels, assist traders in pinpointing entry and exit points, ultimately aiding better trading decisions.
When prices approach these channel lines, the likelihood of interaction with support or resistance levels increases, and breaking through these lines may signal a price reversal or continuation.
Due to its precision in identifying price trends, analyzing trend reversals, and determining key price levels, the Linear Regression Channel indicator is widely regarded as a reliable tool across financial markets such as Forex, stocks, and cryptocurrencies.
🔵 How to Use
🟣 Identifying Entry Signals
One of the primary uses of this indicator is recognizing buy signals. The lower channel line acts as a support level, and when the price nears this line, the likelihood of an upward reversal increases.
In an uptrend : When the price approaches the lower channel line and signs of upward reversal (e.g., reversal candlesticks or high trading volume) are observed, it is considered a buy signal.
In a downtrend : If the price breaks the lower channel line and subsequently re-enters the channel, it may signal a trend change, offering a buying opportunity.
🟣 Identifying Exit Signals
The Linear Regression Channel is also used to identify sell signals. The upper channel line generally acts as a resistance level, and when the price approaches this line, the likelihood of a price decrease increases.
In an uptrend : Approaching the upper channel line and observing weakness in the uptrend (e.g., declining volume or reversal patterns) indicates a sell signal.
In a downtrend : When the price reaches the upper channel line and reverses downward, this is considered a signal to exit trades.
🟣 Analyzing Channel Breakouts
The Linear Regression Channel allows traders to identify price breakouts as strong signals of potential trend changes.
Breaking the upper channel line : Indicates buyer strength and the likelihood of a continued uptrend, often accompanied by increased trading volume.
Breaking the lower channel line : Suggests seller dominance and the possibility of a continued downtrend, providing a strong sell signal.
🟣 Mean Reversion Analysis
A key concept in using the Linear Regression Channel is the tendency for prices to revert to the midline of the channel, which acts as a dynamic moving average, reflecting the price's equilibrium over time.
In uptrends : Significant deviations from the midline increase the likelihood of a price retracement toward the midline.
In downtrends : When prices deviate considerably from the midline, a return toward the midline can be used to identify potential reversal points.
🔵 Settings
🟣 Time Frame
The time frame setting enables users to view higher time frame data on a lower time frame chart. This feature is especially useful for traders employing multi-time frame analysis.
🟣 Regression Type
Standard : Utilizes classical linear regression to draw the midline and channel lines.
Advanced : Produces similar results to the standard method but may provide slightly different alignment on the chart.
🟣 Scaling Type
Standard Deviation : Suitable for markets with stable volatility.
ATR (Average True Range) : Ideal for markets with higher volatility.
🟣 Scaling Coefficients
Larger coefficients create broader channels for broader trend analysis.
Smaller coefficients produce tighter channels for precision analysis.
🟣 Channel Extension
None : No extension.
Left: Extends lines to the left to analyze historical trends.
Right : Extends lines to the right for future predictions.
Both : Extends lines in both directions.
🔵 Conclusion
The Linear Regression Channel indicator is a versatile and powerful tool in technical analysis, providing traders with support, resistance, and midline insights to better understand price behavior. Its advanced settings, including time frame selection, regression type, scaling options, and customizable coefficients, allow for tailored and precise analysis.
One of its standout advantages is its ability to support multi-time frame analysis, enabling traders to view higher time frame data within a lower time frame context. The option to use scaling methods like ATR or standard deviation further enhances its adaptability to markets with varying volatility.
Designed to identify entry and exit signals, analyze mean reversion, and assess channel breakouts, this indicator is suitable for a wide range of markets, including Forex, stocks, and cryptocurrencies. By incorporating this tool into your trading strategy, you can make more informed decisions and improve the accuracy of your market predictions.

Linear Regression ChannelLinear Regression Channel Indicator
Overview:
The Linear Regression Channel Indicator is a versatile tool designed for TradingView to help traders visualize price trends and potential reversal points. By calculating and plotting linear regression channels, bands, and future projections, this indicator provides comprehensive insights into market dynamics. It can highlight overbought and oversold conditions, identify trend direction, and offer visual cues for future price movements.
Key Features:
Linear Regression Bands:
Input: Plot Linear Regression Bands
Description: Draws bands based on linear regression calculations, representing overbought and oversold levels.
Customizable Parameters:
Length: Defines the look-back period for the regression calculation.
Deviation: Determines the width of the bands based on standard deviations.
Linear Regression Channel:
Input: Plot Linear Regression Channel
Description: Plots a channel using linear regression to visualize the main trend.
Customizable Parameters:
Channel Length: Defines the look-back period for the channel calculation.
Deviation: Determines the channel's width.
Future Projection Channel:
Input: Plot Future Projection of Linear Regression
Description: Projects a linear regression channel into the future, aiding in forecasting potential price movements.
Customizable Parameters:
Length: Defines the look-back period for the projection calculation.
Deviation: Determines the width of the projected channel.
Arrow Direction Indicator:
Input: Plot Arrow Direction
Description: Displays directional arrows based on future projection, indicating expected price movement direction.
Color-Coded Price Bars:
Description: Colors the price bars based on their position within the regression bands or channel, providing a heatmap-like visualization.
Dynamic Visualization:
Colors: Uses a gradient color scheme to highlight different conditions, such as uptrend, downtrend, and mid-levels.
Labels and Markers: Plots visual markers for significant price levels and conditions, enhancing interpretability.
Usage Notes
Setting the Length:
Adjust the look-back period (Length) to suit the timeframe you are analyzing. Shorter lengths are responsive to recent price changes, while longer lengths provide a broader view of the trend.
Interpreting Bands and Channels:
The bands and channels help identify overbought and oversold conditions. Price moving above the upper band or channel suggests overbought conditions, while moving below the lower band or channel indicates oversold conditions.
Using the Future Projection:
Enable the future projection channel to anticipate potential price movements. This can be particularly useful for setting target prices or stop-loss levels based on expected trends.
Arrow Direction Indicator:
Use the arrow direction indicator to quickly grasp the expected price movement direction. An upward arrow indicates a potential uptrend, while a downward arrow suggests a potential downtrend.
Color-Coded Price Bars:
The color of the price bars changes based on their relative position within the regression bands or channel. This heatmap visualization helps quickly identify bullish, bearish, and neutral conditions.
Dynamic Adjustments:
The indicator dynamically adjusts its visual elements based on user settings and market conditions, ensuring that the most relevant information is always displayed.
Visual Alerts:
Pay attention to the labels and markers on the chart indicating significant events, such as crossovers and breakouts. These visual alerts help in making informed trading decisions.
The Linear Regression Channel Indicator is a powerful tool for traders looking to enhance their technical analysis. By offering multiple regression-based visualizations and customizable parameters, it helps identify key market conditions, trends, and potential reversal points. Whether you are a day trader or a long-term investor, this indicator can provide valuable insights to improve your trading strategy.

Multiple Non-Linear Regression [ChartPrime]This indicator is designed to perform multiple non-linear regression analysis using four independent variables: close, open, high, and low prices. Here's a breakdown of its components and functionalities:
Inputs:
Users can adjust several parameters:
Normalization Data Length: Length of data used for normalization.
Learning Rate: Rate at which the algorithm learns from errors.
Smooth?: Option to smooth the output.
Smooth Length: Length of smoothing if enabled.
Define start coefficients: Initial coefficients for the regression equation.
Data Normalization:
The script normalizes input data to a range between 0 and 1 using the highest and lowest values within a specified length.
Non-linear Regression:
It calculates the regression equation using the input coefficients and normalized data. The equation used is a weighted sum of the independent variables, with coefficients adjusted iteratively using gradient descent to minimize errors.
Error Calculation:
The script computes the error between the actual and predicted values.
Gradient Descent: The coefficients are updated iteratively using gradient descent to minimize the error.
// Compute the predicted values using the non-linear regression function
predictedValues = nonLinearRegression(x_1, x_2, x_3, x_4, b1, b2, b3, b4)
// Compute the error
error = errorModule(initial_val, predictedValues)
// Update the coefficients using gradient descent
b1 := b1 - (learningRate * (error * x_1))
b2 := b2 - (learningRate * (error * x_2))
b3 := b3 - (learningRate * (error * x_3))
b4 := b4 - (learningRate * (error * x_4))
Visualization:
Plotting of normalized input data (close, open, high, low).
The indicator provides visualization of normalized data values (close, open, high, low) in the form of circular markers on the chart, allowing users to easily observe the relative positions of these values in relation to each other and the regression line.
Plotting of the regression line.
Color gradient on the regression line based on its value and bar colors.
Display of normalized input data and predicted value in a table.
Signals for crossovers with a midline (0.5).
Interpretation:
Users can interpret the regression line and its crossovers with the midline (0.5) as signals for potential buy or sell opportunities.
This indicator helps users analyze the relationship between multiple variables and make trading decisions based on the regression analysis. Adjusting the coefficients and parameters can fine-tune the model's performance according to specific market conditions.

Linear Regression Oscillator [ChartPrime]Linear Regression Oscillator Indicator
Overview:
The Linear Regression Oscillator is a custom TradingView indicator designed to provide insights into potential mean reversion and trend conditions. By calculating a linear regression on the closing prices over a user-defined period, this oscillator helps identify overbought and oversold levels and highlights trend changes. The indicator also offers visual cues and color-coded price bars to aid in quick decision-making.
Key Features:
◆ Customizable Look-Back Period:
Input: Length
Default: 20
Description: Determines the period over which the linear regression is calculated. A longer period smooths the oscillator but may lag, while a shorter period is more responsive but may be noisier.
◆ Overbought and Oversold Thresholds:
Inputs: Upper Threshold and Lower Threshold
Default: 1.5 and -1.5 respectively
Description: Define the upper and lower bounds for identifying overbought and oversold conditions. Values outside these thresholds suggest potential reversals.
◆ Candlestick Color Plotting:
Input: Plot Bar Color
Default: false
Description: Option to color the price bars based on the oscillator's value, providing a visual representation of market conditions. Bars turn cyan for positive oscillator values and blue for negative.
◆ Mean Reversion and Trend Signals:
Visual markers and labels indicate when the oscillator suggests mean reversion or trend changes, aiding in identifying key market turning points.
◆ Invalidation Levels:
Tracks the highest and lowest prices over a recent period to set levels where the current trend signal would be considered invalidated.
◆ Gradient Color Coding:
Utilizes gradient color coding to enhance the visualization of oscillator values, making it easier to interpret overbought and oversold conditions.
◆ Usage Notes:
Setting the Look-Back Period:
Adjust the "Length" input based on the timeframe and the type of trading you are conducting. Shorter periods are more suited for intraday trading, while longer periods can be used for swing trading.
Interpreting Thresholds:
Use the upper and lower threshold inputs to fine-tune the sensitivity of the overbought and oversold signals. Higher absolute values reduce the number of signals but increase their reliability.
Candlestick Coloring:
Enabling the "Plot Bar Color" option can help quickly identify the current state of the oscillator in relation to the zero line. This visual aid can be particularly useful in fast-moving markets.
Mean Reversion and Trend Signals:
Pay attention to the symbols and labels on the chart indicating mean reversion and trend changes. These signals are designed to highlight potential entry and exit points.
Invalidation Levels:
Use the plotted invalidation levels as stop-loss or signal invalidation points. If the price moves beyond these levels, the current trend signal is likely invalid.
This indicator helps traders identify overbought and oversold conditions, potential mean reversions, and trend changes based on the linear regression of the closing prices over a specified look-back period.

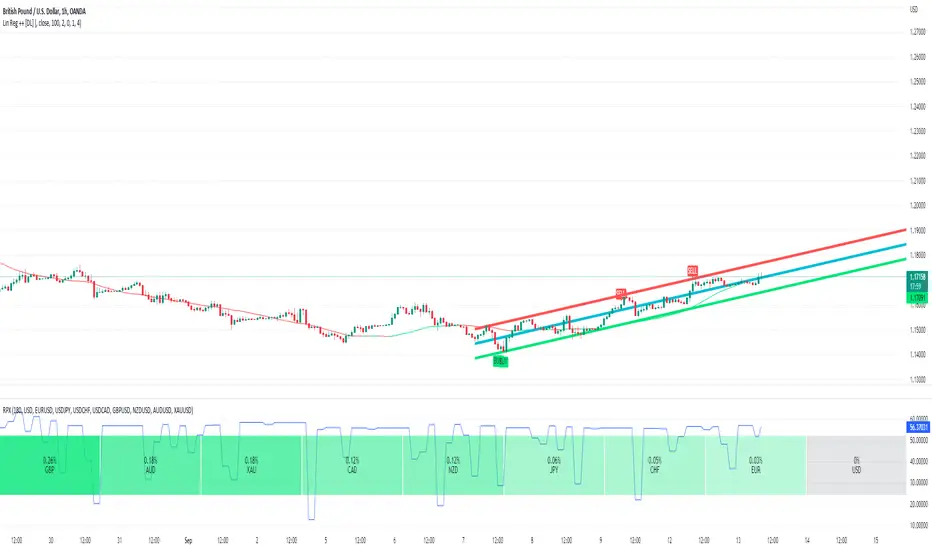
Lin Reg (Linear Regression) Support and Resistance by xxMargauxLin Reg (Linear Regression) Support & Resistance by xxMargaux 💸
This indicator plots three linear regression lines (Lin Reg) on the price chart, providing insights into potential support and resistance levels. It calculates Lin Reg lines based on user-defined lengths and sources.
This indicator's settings were initially configured for MNQ1! (E-Mini Nasdaq 100 futures contracts). But works as intended on any security and on any timeframe.
When price is below a given Lin Reg line, that line will be red and may serve as resistance as price moves up towards the line. That is, it may be a potential short entry opportunity. When price is above a given Lin Reg line, that line will be green and may serve as support as price continues up from the line. That is, it may be a potential long entry opportunity.
When price starts to break sideways or down through the Lin Reg lines, this may signal a reversal from uptrend to downtrend. When price starts to break sideways or up through the Lin Reg Lines, this may signal a reversal from downtrend to uptrend. In very strong trends, breaking through the lines briefly may provide an entry opportunity, but be cautious because a trend reversal may also be possible.
Inputs:
Length of Price Lin Reg Lines: Customize the lengths of the three Lin Reg lines.
Source for Price Lin Reg Lines: Choose the source for each Lin Reg line.
Source for Security Price: Select the price source for the security.
Features:
Trend Analysis: Assists in visualizing price trends based on the relationship between the security price and Lin Reg lines, which will be colored according to whether price is above or below each Lin Reg line.
Customizable Colors: When price is above a Lin Reg line that line will be green. When price is below a Lin Reg line, that line will be red.
Here's a beginner-friendly explanation of linear regression lines 💡
Best-Fit Line: Imagine you have a scatter plot of closing prices on a chart. Linear regression aims to find the straight line that best fits the overall trend of these data points. It's like drawing a line through the center of the data that minimizes the distance between the line and each data point.
Trend Identification: Once the linear regression line is plotted on a price chart, it provides a visual representation of the trend. If the price is generally rising, the linear regression line will slope upwards. If the price is falling, the line will slope downwards. This helps traders identify whether the trend is bullish (upward) or bearish (downward).
Support and Resistance: Linear regression lines can also act as dynamic support and resistance levels. When the price is above the linear regression line, it may act as support, meaning the price tends to bounce off the line and continue higher. Conversely, when the price is below the line, it may act as resistance, with the price encountering selling pressure and potentially reversing lower.
Reversal Signals: Changes in the slope or direction of the linear regression line can signal potential trend reversals. For example, if the price breaks above a downward-sloping linear regression line, it may indicate a shift from a downtrend to an uptrend, and vice versa.
Adjustable Parameters: Traders can customize the length of the linear regression line by adjusting the period over which it's calculated. Shorter periods may be more sensitive to recent price changes, while longer periods may provide a smoother trend line.
series_collectionLibrary "series_collection"
A personal collection of commonly used series types like moving averages that are supported directly by
the pinescript library ('ALMA', 'DEMA', 'EMA', 'HMA', 'RMA', 'SMA', 'SWMA', 'VWMA', 'WMA'), highest and lowest source,
median and pivots. One single function (with overloads) that can be configured easily by the user input and can be
used as a core piece of functionality for many user cases. This library was created to abstract away and re-use this
commonly used functionality in my "Two MA Signal Indicator" script and the "Template Trailing Strategy" script. Both
of them use the "two_ma_logic" for defining entry and exit signals. While this piece of work does not contain any
novel mathematical expressions and just adds a convinient (and configurable) way to do things, I hope that might add
value to other scripts as well and future projects.
cust_series(length, seriesType, source)
cust_series - Calculate the custom series of the given source for the given length and type
Parameters:
length (simple int) : - The length of the custom series
seriesType (simple string) : - The type of the custom series
source (float) : - The source of the values
Returns: - The resulting value of the calculations of the custom series
cust_series(length, seriesType, source)
cust_series - Calculate the custom series of the given source for the given length and type
Parameters:
length (simple float) : - The length of the custom series (ceiled)
seriesType (simple string) : - The type of the custom series
source (float) : - The source of the values
Returns: - The resulting value of the calculations of the custom series

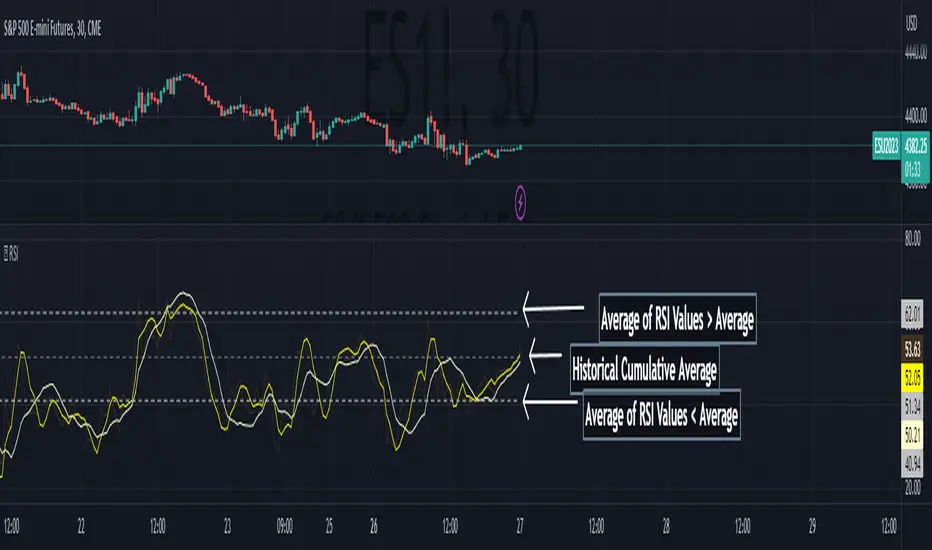
Banana RSIBanana RSI is not just ap-PEAL-ing to the eyes!
This simple little indicator provides a New Approach to determining Overbought and Oversold levels, as well as taking advantage of a non-typical smoothing method for this type of indicator.
Banana RSI uses a Cumulative High and Low Average to draw the upper, lower, and midline.
The High and Low Averages use the data only from above or below the Cumulative Average to calculate their respective line.
In simpler terms:
The High average is an average of every value ABOVE the full average.
The Low average is an average of every value BELOW the full average.
This creates an automated method to determine overbought and oversold territory based on the charts historical movement.
Since every chart can be different, these levels change with the chart.
Banana RSI also uses a linear regression smoothing method , by taking advantage of the built-in Least Squares Moving Average, we are able to view a better reacting/less-lagging moving average.
Included are 2 Length-Adjustable LSMA lines to use however needed.
Using the Regression Lines along with the High & Low Averages provides a new view on the classic RSI indicator.
Enjoy!
Trend Finder++ (by Alex L.)This indicator seeks for a short term trend within a bigger long term trend and displays both in a channel with an extension lines (optional).
Use of this indicator is quite simple: when the stock is near the trend line bottom (default RED) it can be a good time to buy and when the stock is near the trend line top (default GREEN) it can be a good time to sell.
What new ideas and cool stuff this indicator offers:
- 'Trend (Months)' -
Trend channels will always be displayed over the period: last 'X' months (regardless of the 'Time Interval' set in your chart)
This allows you to go into a larger or smaller resolution and still see the same trend lines!
- ' Trend (Bars)' -
Optional. You can choose to display the Trend channel based on bars instead of months.
This can be useful for advanced traders, or in case a security is new and there isn't even 1 month of data.
- 'Show long-term trend' -
Optional. Displays a larger 3rd (even more long-term) trend in addition to the two current trends.
This is for advanced traders who want to see an even more bigger picture. It is best viewed on a weekly time interval.
- Customizable channel size, channel colors and channel style.
- 'Extend lines' -
Optional (default: yes). Trend channels' can be displayed with extension or without using this option.
- Internal Feature -
When trend channel goes below zero (can happen if stock's price falls sharply) - its below-zero portion will be drawn as 'extension' instead.
This is useful if such occurs, and we're in an auto-scaled chart - the lines will take less space on screen (for cleaner view).
Based on an idea/indicator by @ DevLucem called "Linear Regression ++"
Open Source.
Enjoy!

Buy Sell Calendar [LuxAlgo]The Buy Sell Calendar indicator displays a calendar showing the sentiment for the current day/month. Three different methods can be used to determine this sentiment.
The calendar can also highlight the percentage of bullish days/months for a month/year.
🔶 SETTINGS
Frequency: Calendar frequency, options include "Daily" and "Monthly"
Sentiment Method: Method used to determine the sentiment for the day/month, options include: "Linreg", "Accumulated Deltas", and "Max/Min"
Timezone Offset: UTC time zone offset.
Limit Date: Limit date used by the calendar, the sentiment of days/months outside this limit will not be returned.
🔹 Calendar
Show Calendar: Determines whether to display or hide the calendar.
Location: Location of the calendar on the chart.
Size: Calendar size.
🔶 USAGE
The proposed script can allow users to quickly determine if a specific day/month is considered bullish or bearish. A green cell is used for bullish days/months, while a red one is used for bearish days/months.
Additionally vertical lines are displayed on new days/months with a color highlighting the current sentiment for this specific day/month. Note that this is done retrospectively, the color of a line set at time t might differ at time t+n .
🔶 SENTIMENT METHODS
Determining whether a day/month is bullish or bearish can be done using three different methods. Note that each method makes use of the closing price as the input, and as such can eventually return different results depending on the selected timeframe. Each method is described below:
🔹 Linreg
The Linreg method fit lines between each day/month using the method of least squares and determines if that particular day is bullish or bearish based on the line slope sign. For example, a rising line would indicate a bullish day/month.
🔹 Accumulated Deltas
The method of accumulated deltas simply accumulates bullish and bearish price changes for the current day/month, the result with the highest magnitude determines the sentiment for that day/month.
🔹 Max/Min
The max/min method computes a trailing maximum and a trailing minimum for the current day/month. The sentiment is determined by the price position relative to the average between the obtained maximum/minimum, with a bullish sentiment being determined if price is above the average.

Strategy LinReg ST@RLStrategy LinReg ST@RL
Strategy LinReg ST@RL is a visual trend following indicator.
It is compiled in PINE Script Version V5 language.
This indicator/strategy, based on Linear Regression Calculation, is intended to help beginners (and also the more experienced ones) to trade in the right direction of the market trend and test strategy. It allows you to avoid the mistakes of always trading against the trend.
Strategy based on an original idea of @KivancOzbilgic (SuperTrend) and DevLucem (@LucemAnb) (Lin Reg ++)
A special credit goes to - KivancOzbilgic and @LucemAnb which inspired me a lot to improve this indicator/Strategy.
This indicator can be configured to your liking,according to your needs or your tastes.
The indicator/Strategy works in multi time frame.
The settings (length, offset, deviation, smoothing) are identical for all time frames if “Conf Auto” is not checked.
In this case the default settings (time frame=H1 settings) apply for all time frames.
The choice of source setting is common for all time frames.
If “Auto Conf” is checked,
then the settings will be optimized for each selected time frame (1m-3m H2 H3 H1 H4 & Daily). Time frames, other than 1m-3m H2 H3 H1 H4 & Daily will be affected with the default settings corresponding to the H1 time frame and will therefore not be optimized! The default setting values of each time frame (1m-3m H2 H3 H1 H4 & Daily) can be configured differently and optimized by you.
REVERSAL mode: Signal Buy=Sell and Signal Sell=Buy.
This option may be better than the regular strategy. Default mode is Reversal option.
Note that only for 1m (1 minute) Time frame, the option REVERSAL is opposite as default choice in configuration. (If reversal option is checked, then option for time frame 1m is not reversal!)
Trend indications (potential sell or buy areas) are displayed as a background color (bullish: green or bearish: red), assume that the market is moving in one direction.
You can tune the input, style and visibility settings to match your own preferences or habits.
Label Info (Simple or Full) gives trend info for each Exit (or current trade)
The choice of indicator colors is suitable for a graph with a "dark" theme, which you will probably need to modify for visual comfort, if you are using a "Light" mode or a custom mode.
This script is an indicator that you can run on standard chart types. It also works on non-standard chart types but the results will be skewed and different.
Non-standard charts are:
• Heikin Ashi (HA)
• Renko
• Kagi
• Point & Figure
• Range
As a reminder: No indicator is capable of providing accurate signals 100% of the time. Every now and then, even the best will fail, leaving you with a losing deal. Whichever indicator you base yourself on, remember to follow the basic rules of risk management and capital allocation.
BINANCE:BTCUSDT
! Français !
Strategy LinReg ST@RL
Stratégie LinReg ST@RL est un indicateur visuel de suivi de tendance.
Il est compilé en langage PINE Script Version V5.
Stratégie basée sur une idée originale de @KivancOzbilgic (SuperTrend) et DevLucem (@LucemAnb) (Lin Reg ++) Un crédit spécial va à - KivancOzbilgic et @LucemAnb qui m'ont beaucoup inspiré pour améliorer cet indicateur/stratégie.
Cet indicateur/strategie, basé sur le calcul de régression linéaire, est destiné à aider les débutants (et aussi les plus expérimentés) à trader dans le bon sens de la tendance du marché et à tester la stratégie. Cela vous permet d'éviter les erreurs de toujours négocier à contre-courant.
Cet indicateur peut être configuré à votre guise, selon vos besoins ou vos goûts.
L'indicateur/Stratégie fonctionne sur plusieurs bases de temps.
Les réglages (longueur, décalage, déviation, lissage) sont identiques pour toutes les bases de temps si
« Conf Auto » n'est pas coché. Dans ce cas, les paramètres par défaut (intervalle de temps=paramètres H1) s'appliquent à toutes les bases de temps.
Le choix du réglage de la source est commun à toutes les bases de temps.
Si "Auto Conf" est coché, alors les paramètres seront optimisés pour chaque base de temps sélectionnée (1m-3m H2 H3 H1 H4 & Daily). Les bases de temps, autres que 1m-3m H2 H3 H1 H4 & Daily seront affectées par les paramètres par défaut correspondant à la base de temps H1 et ne seront donc pas optimisées ! Les valeurs de réglage par défaut de chaque période (1m-3m H2 H3 H1 H4 & Daily) peuvent être configurées différemment et optimisées par vous.
Mode REVERSAL : Signal Achat=Vente et Signal Vente=Achat. Cette option peut être meilleure que la stratégie habituelle. Le mode par défaut est l'option REVERSAL.
Notez que seulement pour la base de temps de 1m (1 minute), l'option REVERSAL est l’opposée du choix par défaut dans la configuration. (Si l'option REVERSAL est cochée, alors l'option pour la base de temps 1 m n'est pas REVERSAL !)
Les indications de tendance (zones potentielles de vente ou d'achat) sont affichées en couleur de fond (haussier : vert ou baissier : rouge), supposons que le marché évolue dans une direction. Vous pouvez ajuster les paramètres d'entrée, de style et de visibilité en fonction de vos propres préférences ou habitudes.
Les informations sur l'étiquette (simples ou complètes) donnent des informations sur de chaque clôture (ou position en cours)
Le choix des couleurs des indicateurs est adapté à un graphique avec un thème "sombre", qu'il vous faudra probablement modifier pour le confort visuel, si vous utilisez un mode "Clair" ou un mode personnalisé.
Ce script est un indicateur que vous pouvez exécuter sur des types de graphiques standard. Cela fonctionne également sur les types de graphiques non standard, mais les résultats seront faussés et différents.
Les graphiques non standard sont :
• Heikin Ashi (HA)
• Renko
• Kagi
• Point & Figure
• Range
Pour rappel : Aucun indicateur n'est capable de fournir des signaux précis 100% du temps. De temps en temps, même les meilleurs échoueront, vous laissant avec une affaire perdante. Quel que soit l'indicateur sur lequel vous vous basez, rappelez-vous de suivre les règles de base de la gestion des risques et de l'allocation du capital.

Trendlines with Breaks [LuxAlgo]The trendlines with breaks indicator return pivot point based trendlines with highlighted breakouts. Users can control the steepness of the trendlines as well as their slope calculation method.
Trendline breakouts occur in real-time and are not subject to backpainting. Trendlines can however be subject to repainting unless turned off from the user settings.
The indicator includes integrated alerts for trendline breakouts.
🔶 USAGE
Any valid trendlines methodology can be used with the indicator, users can identify breakouts in order to infer future price movements.
The calculation method of the slope greatly affects the trendline's behaviors. By default, an average true range is used, returning a more constant slope amongst trendlines. Other methods might return trendlines with significantly different slopes.
Stdev makes use of the standard deviation for the slope calculation, while Linreg makes use of the slope of a linear regression.
The above chart shows the indicator using "Stdev" as a slope calculation method. The chart below makes use of the "Linreg" method.
By default trendlines are subject to backpainting, and as such are offset by length bars in the past. Disabling backpainting will not offset the trendlines.
🔶 SETTINGS
Length: Pivot points period
Slope: Slope steepness, values greater than 1 return a steeper slope. Using a slope of 0 would be equivalent to obtaining levels.
Slope Calculation Method: Determines how the slope is calculated.
Backpaint: Determine whether trendlines are backpainted, that is offset to past.

Linear trendSimple way how to use Linear Regression for trading.
What we use:
• Linear Regression
• EMA 200 as a trend filter
Logic:
Firstly we make two different linear regression movings as oscillator. For this we need to subtract slow moving from fast moving, so we get the single moving around zero. This is the green/red line which appears on the chart.
The trade open when LR cross over the threshold. The trade close when LR cross under the threshold below. Crossing over the threshold is the same as faster moving cross over slower moving.
Also we use EMA as a filter. The trades would be only when the price is over than EMA 200.

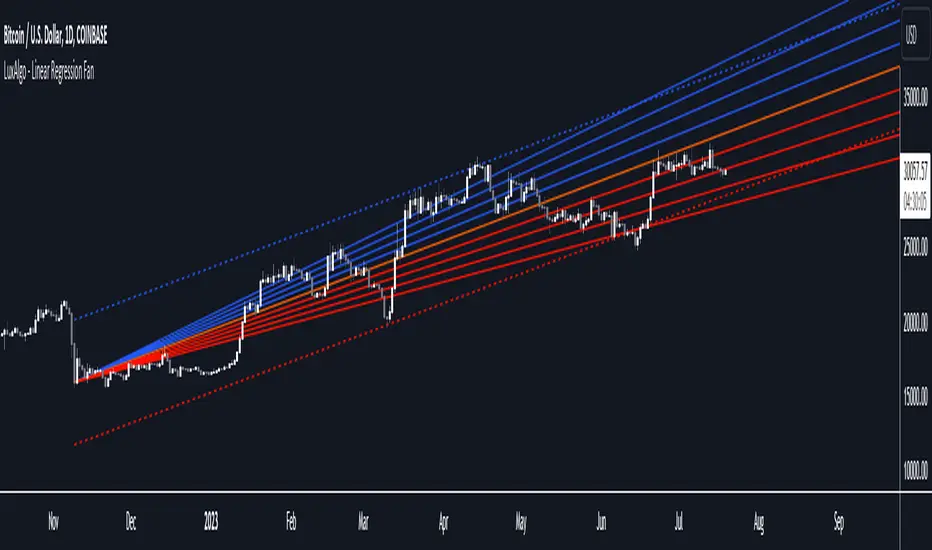
Linear Regression Fan [LuxAlgo]This indicator displays a fan using a linear regression fit to the price as a base. All lines are equidistant and are drawn from the first point of the linear regression to the most recent point of the linear regression plus the root-mean-square deviation (RMSD) multiplied by a certain factor.
Settings
Length: Lookback period for the linear regression.
Mult: Multiplier for the RMSD, allows returning wider fans.
Lines Per Side: Number of lines on each side of the fan.
Src: Input source of the indicator.
Usage
Traders often use the lines of fans to determine significant points of support or resistance at which they might expect price variations to reverse.
The length can be adjusted so that the starting point of the linear regression is located at a pivot high/low.
Some technical analysts use the measure rule of broadening wedges with fans when price breaks one of the extremities. This allows setting precise take-profits/stop-losses.
To learn more about the measure rule see:
Linear SSL ShortThis script consist of two parts: linear SSL and DEMA. The difference between original SSL and current is that it calculated by linear regression. The logic is simple: when SSL "crossunder" and DEMA is above the price - we get short signal. When price became above DEMA and SSL "crossover" - close short.

Natural Market Slope [CC]The Natural Market Slope was created by Jim Sloman and this is one of his many Ocean Indicators which I'm publishing thanks to receiving source materials from @altcoinz and @tmac87. I did completely rewrite the formula for this indicator but I commented out the original calculation so you can compare or just for study purposes. I like this version better because it is very smooth and the original formula is a bit faster with response but is very choppy in comparison.
This indicator was the basis for his Natural Market Combo which I will be publishing very soon so stay tuned for that. The idea behind all of his Natural indicators was to use the natural log of the current price in different ways. This indicator obviously focuses on the slope and it essentially becomes another momentum indicator which peaks when the upward momentum is gone and vice versa. Buy when the line turns green and sell when it turns red. I have added strong buy and sell signals in addition to the normal ones and strong signals are darker in color in comparison to the original lighter colors.
Let me know if there are any other indicators you would like to see me publish!

Raff Regression Channel by DGTRᴀꜰꜰ Rᴇɢʀᴇꜱꜱɪᴏɴ Cʜᴀɴɴᴇʟ (RRC)
This study aims to automate Raff Regression Channel drawing either based on ZigZag Indicator or optionally User Preference
The Raff Regression Channel , developed by Gilbert Raff, is based on a linear regression, which is the least-squares line-of-best-fit for a price series, with evenly spaced trend lines above and below . The width of the channel is set by determining the high or low that is the furthest from the linear regression.
Because the channel distance is based off the largest pullback or highest peak within a trend, for effectively drawing and using a Raff Regression Channel it is recommend/required that a Raff Regression Channel is applied to “mature” trends. Knowing this requirement, for better automated drawing results this study benefits from the Zig Zag Indicator, where the Zig Zag indicator is used to help identify price trends and changes in price trends. Option to manually adjust lengths for drawing a Raff Regression Channel is also made available.
Using a Raff Regression Channel
Once The Raff Regression Channel is drawn, covering an existing trend, Exᴛᴇɴꜱɪᴏɴ Lɪɴᴇꜱ are drawn to identify ᴛʜᴇ ꜱᴜᴘᴘᴏʀᴛ﹐ʀᴇꜱɪꜱᴛᴀɴᴄᴇ ᴏʀ ʀᴇᴠᴇʀꜱᴀʟ ᴘᴏɪɴᴛꜱ
The trend is up as long as prices rise within this channel. An uptrend may be reversing (not always, but likely) when price breaks below the channel extension . The trend is down as long as prices decline within the channel. Similarly, a downtrend may be reversing (not always, but likely) when price breaks above the channel extension . Moves outside the channel extensions can be indication of a reversal or can denote overbought or oversold conditions
For further details please refer to education post Raff Regression Channel
█ FEATURES
- AUTO or MANUALLY adjusted Raff Regression Channel and Channel Extentions drawing
- ALERTs, for Linear Regression Line, Raff Regression Upper and Lower Channel Extentions
- LSMA , Least Squares Moving Average, in other words Linear Regression Curve
█ SETTINGS
Setting Loopback and Number of Bars are the most important part for The Raff Regression Channel, where ;
- Lookback, defines where the Raff Regression Channel is starting, it is recommended to set to a trend begining
- Number of Bars, defines how many bars to be assumed for calculation, or simply stated the end of the Raff Regression Channel drawing (not extentions but the main channel, extentions by default will be drawn till the last bar)
Setting of Loopback and Number of Bars is performed eigher automatically based on Zig Zag indicator or users may prefer to set them manually. If selected automatically then
- Deviation and Depth values of Zig Zag indicator are used for calculations (enabling visually plotting of ZigZag Lines will help to identify better visually the points), where ;
Deviation, is a multiplier that affects how much the price should deviate from the previous pivot in order for the bar to become a new pivot.
Depth, affects the minimum number of bars that will be taken into account when building
Short-term traders may wish to apply the channel to small waves of a trend so they can reduce the value of the Deviation and Depth
█ OTHER CHANNEL CONSEPTS
Linear Regression Channels, , what linear regression channels are? and linear regression channel/curve/slope study
Fibonacci Channels, how to apply fibonacci channels and automated fibonacci channels study
Andrews’ Pitchfork, how to apply pitchfork and automated pitchfork study
Special Thanks to @Kiss66000 for his kind suggestion, je vous remercie beaucoup @Kiss66000
Disclaimer :
Trading success is all about following your trading strategy and the indicators should fit within your trading strategy, and not to be traded upon solely
The script is for informational and educational purposes only. Use of the script does not constitute professional and/or financial advice. You alone have the sole responsibility of evaluating the script output and risks associated with the use of the script. In exchange for using the script, you agree not to hold dgtrd TradingView user liable for any possible claim for damages arising from any decision you make based on use of the script
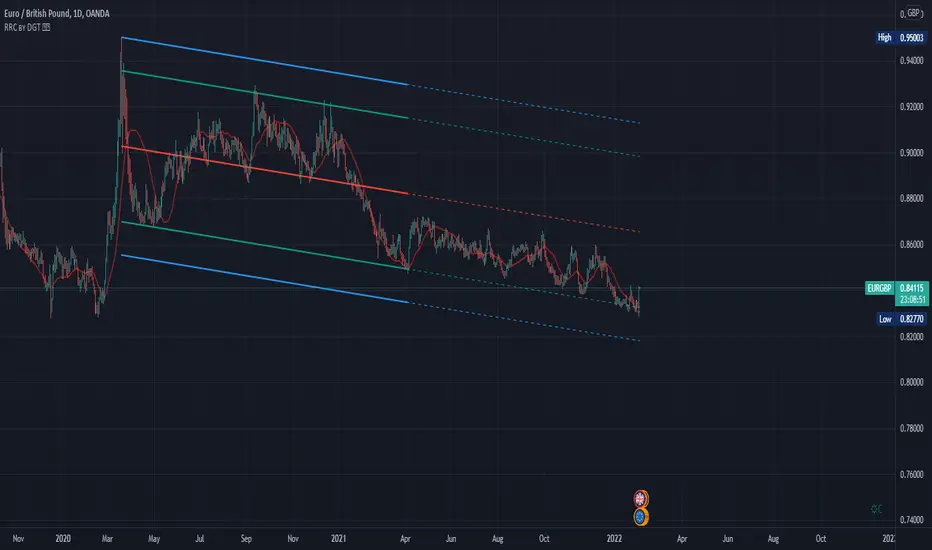
Squeeze Momentum Indicator [LazyBear] vX by DGTModified version of Squeeze Momentum Indicator visualizing on Price Chart
author: LazyBear, modified by KıvançÖZBİLGİÇ
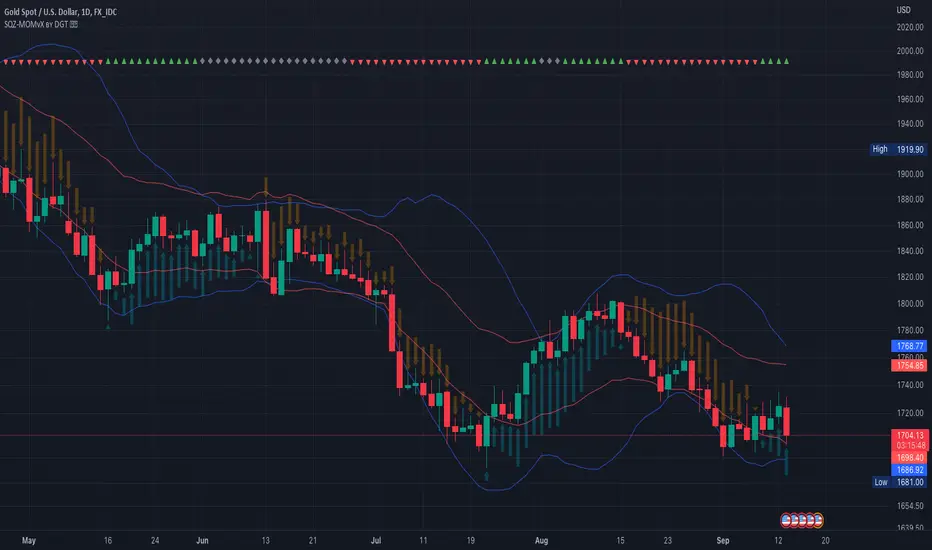
Linear Regression ++Due to public demand
Linear Regression Formula
Scraped Calculation With Alerts
Here is the Linear Regression Script For traders Who love rich features
Features
++ Multi time frame -> Source Regression from a different Chart
++ Customized Colors -> This includes the pine lines
++ Smoothing -> Allow Filtered Regression; Note: Using 1 Defaults to the original line. The default is 1
++ Alerts On Channel/Range Crossing
Usage
++ Use this for BreakOuts and Reversals
++ This Script is not to be used Independently
Risks
Please note, this script is the likes of Bollinger bands and poses a risk of falling in a trend range.
Signals may Keep running on the same direction while the market is reversing.
Requests
If you have any feature requests, comment below or dm me. I will answer when i can.
Feel free to utilize this on your chart and share your ideas
For developers who want to use this on their chart, Please use this script
The original formula for calculation is posted there
❤❤❤ I hope you love this. From my heart! ❤❤❤