Double MACD StrategyDouble MACD Strategy (Default Settings)
This automated strategy uses two independent MACD indicators to flip between long and short positions.
How It Works
• Fast MACD (MACD 1) captures rapid micro-trends
• Slow MACD (MACD 2) confirms broader momentum
• Long Entry when both MACD lines cross above their signal lines
• Short Entry when both MACD lines cross below their signal lines
• Existing opposing trades are closed before opening new ones
Default Input Settings
• Fast MACD (MACD 1)
• Fast Length 1: 12
• Slow Length 1: 26
• Signal Length 1: 9
• MA Type 1: EMA
• Slow MACD (MACD 2)
• Fast Length 2: 24
• Slow Length 2: 52
• Signal Length 2: 9
• MA Type 2: EMA
• Position Sizing: 100 % of equity
• Pyramiding: 1 concurrent entry per direction
Usage
1. Apply to any chart on your desired timeframe.
2. Monitor background shading (green for bullish, red for bearish bias).
3. Manage risk with your own stop loss, take profit, and position-sizing rules.
Disclaimer
This script is provided for educational purposes only. It is not financial advice or a recommendation to buy or sell any instrument. All trading involves risk, and any losses incurred are the sole responsibility of the trader.
Moving Average Convergence / Divergence (MACD)

RSI and MACD Divergence IndicatorThe RSI and MACD Divergence Indicator is a custom Pine Script v6 indicator designed for TradingView that identifies and visualizes divergences between price movements and two technical indicators: the Relative Strength Index (RSI) and the Moving Average Convergence Divergence (MACD). Here's a brief explanation of its functionality:
Divergence Detection: The indicator detects both regular and hidden divergences for RSI, MACD (MACD Line), and Histogram. Regular bullish divergences occur when price makes a lower low but the indicator makes a higher low (suggesting a potential reversal upward), while regular bearish divergences occur when price makes a higher high but the indicator makes a lower high (suggesting a potential reversal downward). Hidden divergences indicate continuation patterns (e.g., higher low in price with a lower low in the indicator for bullish continuation).
Customizable Inputs:
Pivot Bars: Sets the number of bars used to confirm pivot highs and lows (default: 5).
RSI and MACD Parameters: Allows adjustment of RSI length (default: 14) and MACD settings (fast: 12, slow: 26, signal: 9).
Toggle Options: Enables/disables detection of regular and hidden divergences for RSI, MACD, and Histogram individually.
Confirmation: Option to wait for pivot confirmation (default: true), delaying divergence display until the pivot is fully formed.
Show Only Last Divergence: Toggles between showing only the most recent divergence (default: true) or all detected divergences (false), with previous lines and labels cleared when true.
Minimum Divergences: Sets the minimum number of divergence types required at a pivot to display (default: 1, max: 6).
Maximum Pivot Points: Limits the number of historical pivot points to check (default: 10).
Maximum Bars to Check: Restricts analysis to the last specified number of bars (default: 500).
Visualization:
Draws lines connecting the price pivot points where divergences are detected, with customizable colors, widths, and styles (solid, dashed, dotted) for RSI and MACD.
Displays a single label per pivot with vertically stacked text listing all detected divergence types (e.g., "RSI Bull Div MACD Bull Div"), using semi-transparent backgrounds (green for bullish, red for bearish) and white text.

MACD-RSI Divergence OscillatorMACD-RSI Divergence Oscillator: Dual Confirmation with Momentum + Divergence Signals
This powerful oscillator combines MACD and RSI into a single normalized visual tool, enriched with automatic divergence detection and smart signal alerts. It’s designed to give traders advanced insights into momentum shifts and trend reversals.
Key Features:
• MACD + RSI Combo: Both indicators are scaled and merged into one oscillator for clearer interpretation.
• Automatic Divergence Detection:
• Bullish & Bearish divergences on both MACD and RSI
• Highlights strong divergences when both confirm
• Trading Signals:
• Detects MACD crossovers and RSI reversals
• Smart buy/sell signals based on momentum + divergence
• Custom Oscillator View:
• Plots MACD and RSI on the same scale
• Visual zero-line, overbought/oversold levels, and customizable colors
• Optional Dashboard Table:
• Displays live indicator values, signal states, and divergence status
Ideal For:
• Spotting early trend reversals
• Confirming trade entries/exits
• Avoiding false signals using dual indicator logic
Highly customizable and suitable for all timeframes and asset types.

Combined and Count of Bull Bear Alerts for OBV, TDI, CCI, MACDCombined and Count of Bull Bear Alerts for OBV, TDI, CCI, MACD
Description
This powerful indicator combines four popular technical analysis tools (On-Balance Volume, Traders Dynamic Index, Commodity Channel Index, and MACD) into a single comprehensive divergence detection system. It monitors all four indicators simultaneously and provides real-time alerts when bullish or bearish divergences occur across multiple indicators, helping traders identify high-probability reversal opportunities.
Key Features
Multi-Indicator Divergence Detection: Simultaneously tracks divergences in OBV, TDI, CCI, and MACD
Comprehensive Signal Counting: Displays real-time count of bullish (1-4) and bearish (1-4) divergences
Four Customizable Alert Conditions:
Alert 1: 1-4 indicators showing bullish divergence
Alert 2: 3-4 indicators showing strong bullish divergence
Alert 3: 1-2 indicators showing bearish divergence
Alert 4: 3-4 indicators showing strong bearish divergence
Visual Signal Display: Clear numerical indicators showing how many tools are signaling divergence
Customizable Parameters: Adjustable settings for each indicator's sensitivity and display preferences
Overlay Display: All signals shown directly on the price chart for easy analysis
How It Works
The indicator continuously monitors each technical tool for both regular and hidden divergences using pivot point analysis. When a divergence pattern is detected, it increments the appropriate counter (bullish or bearish). The system then displays the total count as colored numbers on the chart and can trigger alerts based on your preferred signal strength thresholds.
Trading Applications
Strong Reversal Signals: Look for 3-4 indicator confirmations for high-probability trades
Early Trend Detection: Use 1-2 indicator signals for early entry opportunities
Confirmation Tool: Validate your trading signals with multi-indicator divergence confirmation
Risk Management: Avoid trading against multiple indicator divergences
Customization Options
Adjustable lookback periods for each indicator
Toggle visibility of bullish/bearish counters
Customizable colors, positions, and display styles
Option to show individual indicator signals
Configurable divergence detection parameters
This indicator is particularly valuable for traders who want to combine multiple technical analysis approaches into a single, easy-to-monitor system that highlights confluence opportunities across different market perspectives (volume, momentum, cycle, and trend).

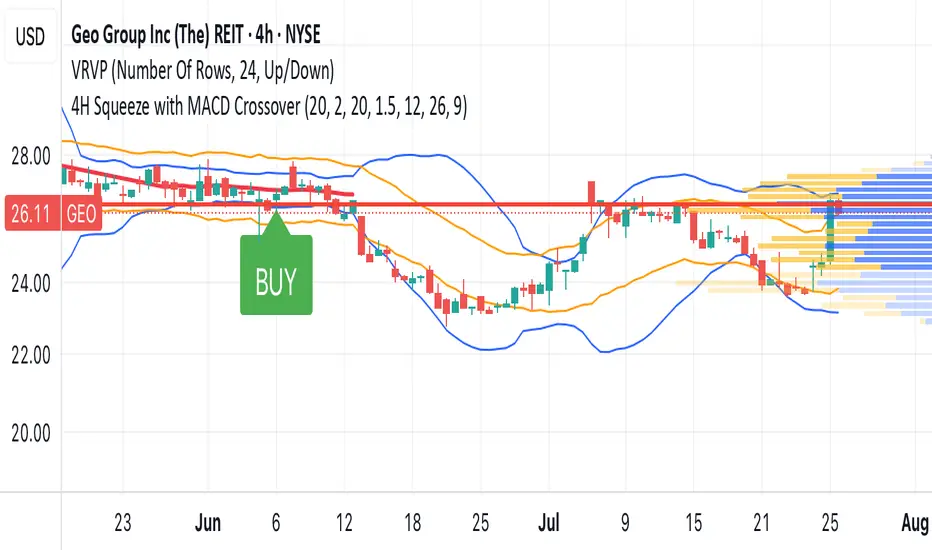
MACD Liquidity Tracker Strategy [Quant Trading]MACD Liquidity Tracker Strategy
Overview
The MACD Liquidity Tracker Strategy is an enhanced trading system that transforms the traditional MACD indicator into a comprehensive momentum-based strategy with advanced visual signals and risk management. This strategy builds upon the original MACD Liquidity Tracker System indicator by TheNeWSystemLqtyTrckr , converting it into a fully automated trading strategy with improved parameters and additional features.
What Makes This Strategy Original
This strategy significantly enhances the basic MACD approach by introducing:
Four distinct system types for different market conditions and trading styles
Advanced color-coded histogram visualization with four dynamic colors showing momentum strength and direction
Integrated trend filtering using 9 different moving average types
Comprehensive risk management with customizable stop-loss and take-profit levels
Multiple alert systems for entry signals, exits, and trend conditions
Flexible signal display options with customizable entry markers
How It Works
Core MACD Calculation
The strategy uses a fully customizable MACD configuration with traditional default parameters:
Fast MA : 12 periods (customizable, minimum 1, no maximum limit)
Slow MA : 26 periods (customizable, minimum 1, no maximum limit)
Signal Line : 9 periods (customizable, now properly implemented and used)
Cryptocurrency Optimization : The strategy's flexible parameter system allows for significant optimization across different crypto assets. Traditional MACD settings (12/26/9) often generate excessive noise and false signals in volatile crypto markets. By using slower, more smoothed parameters, traders can capture meaningful momentum shifts while filtering out market noise.
Example - DOGE Optimization (45/80/290 settings) :
• Performance : Optimized parameters yielding exceptional backtesting results with 29,800% PnL
• Why it works : DOGE's high volatility and social sentiment-driven price action benefits from heavily smoothed indicators
• Timeframes : Particularly effective on 30-minute and 4-hour charts for swing trading
• Logic : The very slow parameters filter out noise and capture only the most significant trend changes
Other Optimizable Cryptocurrencies : This parameter flexibility makes the strategy highly effective for major altcoins including SUI, SEI, LINK, Solana (SOL) , and many others. Each crypto asset can benefit from custom parameter tuning based on its unique volatility profile and trading characteristics.
Four Trading System Types
1. Normal System (Default)
Long signals : When MACD line is above the signal line
Short signals : When MACD line is below the signal line
Best for : Swing trading and capturing longer-term trends in stable markets
Logic : Traditional MACD crossover approach using the signal line
2. Fast System
Long signals : Bright Blue OR Dark Magenta (transparent) histogram colors
Short signals : Dark Blue (transparent) OR Bright Magenta histogram colors
Best for : Scalping and high-volatility markets (crypto, forex)
Logic : Leverages early momentum shifts based on histogram color changes
3. Safe System
Long signals : Only Bright Blue histogram color (strongest bullish momentum)
Short signals : All other colors (Dark Blue, Bright Magenta, Dark Magenta)
Best for : Risk-averse traders and choppy markets
Logic : Prioritizes only the strongest bullish signals while treating everything else as bearish
4. Crossover System
Long signals : MACD line crosses above signal line
Short signals : MACD line crosses below signal line
Best for : Precise timing entries with traditional MACD methodology
Logic : Pure crossover signals for more precise entry timing
Color-Coded Histogram Logic
The strategy uses four distinct colors to visualize momentum:
🔹 Bright Blue : MACD > 0 and rising (strong bullish momentum)
🔹 Dark Blue (Transparent) : MACD > 0 but falling (weakening bullish momentum)
🔹 Bright Magenta : MACD < 0 and falling (strong bearish momentum)
🔹 Dark Magenta (Transparent) : MACD < 0 but rising (weakening bearish momentum)
Trend Filter Integration
The strategy includes an advanced trend filter using 9 different moving average types:
SMA (Simple Moving Average)
EMA (Exponential Moving Average) - Default
WMA (Weighted Moving Average)
HMA (Hull Moving Average)
RMA (Running Moving Average)
LSMA (Least Squares Moving Average)
DEMA (Double Exponential Moving Average)
TEMA (Triple Exponential Moving Average)
VIDYA (Variable Index Dynamic Average)
Default Settings : 50-period EMA for trend identification
Visual Signal System
Entry Markers : Blue triangles (▲) below candles for long entries, Magenta triangles (▼) above candles for short entries
Candle Coloring : Price candles change color based on active signals (Blue = Long, Magenta = Short)
Signal Text : Optional "Long" or "Short" text inside entry triangles (toggleable)
Trend MA : Gray line plotted on main chart for trend reference
Parameter Optimization Examples
DOGE Trading Success (Optimized Parameters) :
Using 45/80/290 MACD settings with 50-period EMA trend filter has shown exceptional results on DOGE:
Performance : Backtesting results showing 29,800% PnL demonstrate the power of proper parameter optimization
Reasoning : DOGE's meme-driven volatility and social sentiment spikes create significant noise with traditional MACD settings
Solution : Very slow parameters (45/80/290) filter out social media-driven price spikes while capturing only major momentum shifts
Optimal Timeframes : 30-minute and 4-hour charts for swing trading opportunities
Result : Exceptionally clean signals with minimal false entries during DOGE's characteristic pump-and-dump cycles
Multi-Crypto Adaptability :
The same optimization principles apply to other major cryptocurrencies:
SUI : Benefits from smoothed parameters due to newer coin volatility patterns
SEI : Requires adjustment for its unique DeFi-related price movements
LINK : Oracle news events create price spikes that benefit from noise filtering
Solana (SOL) : Network congestion events and ecosystem developments need smoothed detection
General Rule : Higher volatility coins typically benefit from very slow MACD parameters (40-50 / 70-90 / 250-300 ranges)
Key Input Parameters
System Type : Choose between Fast, Normal, Safe, or Crossover (Default: Normal)
MACD Fast MA : 12 periods default (no maximum limit, consider 40-50 for crypto optimization)
MACD Slow MA : 26 periods default (no maximum limit, consider 70-90 for crypto optimization)
MACD Signal MA : 9 periods default (now properly utilized, consider 250-300 for crypto optimization)
Trend MA Type : EMA default (9 options available)
Trend MA Length : 50 periods default (no maximum limit)
Signal Display : Both, Long Only, Short Only, or None
Show Signal Text : True/False toggle for entry marker text
Trading Applications
Recommended Use Cases
Momentum Trading : Capitalize on strong directional moves using the color-coded system
Trend Following : Combine MACD signals with trend MA filter for higher probability trades
Scalping : Use "Fast" system type for quick entries in volatile markets
Swing Trading : Use "Normal" or "Safe" system types for longer-term positions
Cryptocurrency Trading : Optimize parameters for individual crypto assets (e.g., 45/80/290 for DOGE, custom settings for SUI, SEI, LINK, SOL)
Market Suitability
Volatile Markets : Forex, crypto, indices (recommend "Fast" system or smoothed parameters)
Stable Markets : Stocks, ETFs (recommend "Normal" or "Safe" system)
All Timeframes : Effective from 1-minute charts to daily charts
Crypto Optimization : Each major cryptocurrency (DOGE, SUI, SEI, LINK, SOL, etc.) can benefit from custom parameter tuning. Consider slower MACD parameters for noise reduction in volatile crypto markets
Alert System
The strategy provides comprehensive alerts for:
Entry Signals : Long and short entry triangle appearances
Exit Signals : Position exit notifications
Color Changes : Individual histogram color alerts
Trend Conditions : Price above/below trend MA alerts
Strategy Parameters
Default Settings
Initial Capital : $1,000
Position Size : 100% of equity
Commission : 0.1%
Slippage : 3 points
Date Range : January 1, 2018 to December 31, 2069
Risk Management (Optional)
Stop Loss : Disabled by default (customizable percentage-based)
Take Profit : Disabled by default (customizable percentage-based)
Short Trades : Disabled by default (can be enabled)
Important Notes and Limitations
Backtesting Considerations
Uses realistic commission (0.1%) and slippage (3 points)
Default position sizing uses 100% equity - adjust based on risk tolerance
Stop-loss and take-profit are disabled by default to show raw strategy performance
Strategy does not use lookahead bias or future data
Risk Warnings
Past performance does not guarantee future results
MACD-based strategies may produce false signals in ranging markets
Consider combining with additional confluences like support/resistance levels
Test thoroughly on demo accounts before live trading
Adjust position sizing based on your risk management requirements
Technical Limitations
Strategy does not work on non-standard chart types (Heikin Ashi, Renko, etc.)
Signals are based on close prices and may not reflect intraday price action
Multiple rapid signals in volatile conditions may result in overtrading
Credits and Attribution
This strategy is based on the original "MACD Liquidity Tracker System" indicator created by TheNeWSystemLqtyTrckr . This strategy version includes significant enhancements:
Complete strategy implementation with entry/exit logic
Addition of the "Crossover" system type
Proper implementation and utilization of the MACD signal line
Enhanced risk management features
Improved parameter flexibility with no artificial maximum limits
Additional alert systems for comprehensive trade management
The original indicator's core color logic and visual system have been preserved while expanding functionality for automated trading applications.

Momentum-Reversal System Signals Pro
Momentum-Reversal System Signals Pro
Overview
A sophisticated signaling system designed to identify high-probability trend-following entries after a price pullback. This indicator is optimized for index futures like the S&P 500 (ES/SPX) on a 5-minute timeframe .
It performs best during periods of established trends and lower volatility. To aid in this, the indicator includes a customizable "No-Trade Zone" highlighter, which is pre-set to the often volatile 8:30 AM - 11:30 AM EST market open. While the default settings are robust and effective in most conditions, the indicator is fully customizable to suit your specific trading style.
How It Works
The core logic is based on a three-step process to filter for high-quality setups:
Trend Confirmation: The script first establishes the overall market direction using an EMA on a higher timeframe (15-minute by default). This ensures you are only looking for trades that align with the dominant trend.
Pullback Detection: Once the trend is confirmed, the script waits for the price to pull back to a dynamic area of value on the main chart (5-minute by default). This "pullback zone" is defined by the 5m EMA and an ATR-based channel around it, which adapts to current market volatility.
Momentum Entry: After a valid pullback occurs, the script waits for a clear sign that momentum is returning in the direction of the primary trend. This is confirmed by a combination of a MACD crossover and a strong RSI reading, signaling that the pullback has likely ended and the trend is ready to resume.
Advanced Quality Filters
What makes this indicator powerful is its multi-layered filtering system designed to weed out low-probability signals and avoid choppy market conditions.
Trend Strength: It doesn't just check the trend direction; it measures the slope of the 15m EMA to ensure the trend has sufficient strength. This is a key filter for avoiding flat, sideways markets.
Momentum Confirmation: An RSI "Dead Zone" around the 50-level ensures that the RSI shows decisive momentum before a signal is generated.
Signal Cooldown: A built-in timer ( Min Bars Between Signals ) prevents the same signal from firing repeatedly in a short period, reducing noise and over-trading.
RSI Volatility: The script checks that the RSI itself is not flat, which is often a sign of market indecision and a precursor to chop.
Pullback Quality: An optional filter ensures that by the time the signal fires, the price has already moved back to the "correct" side of the 5m EMA, confirming the reversal's strength.
Volatility Filter: A crucial risk management filter that blocks signals on abnormally large, high-risk "gasoline" bars that could lead to immediate stops.
How To Use
For Long Signals (Green 'Long' Tag):
Look for the 15m EMA to be green and trending upwards.
Wait for price to pull back towards the orange 5m EMA.
A "Long" signal appears when momentum indicators confirm a reversal back in the direction of the trend.
For Short Signals (Red 'Short' Tag):
Look for the 15m EMA to be red and trending downwards.
Wait for price to pull back towards the orange 5m EMA.
A "Short" signal appears when momentum indicators confirm a reversal back in the direction of the trend.
This tool provides high-probability signals, not guarantees. It is designed to be a core component of a complete trading plan. Always use proper risk management and confluence from your own analysis.
Fine-Tuning & Customization
All settings are fully adjustable in the script's "Inputs" tab to match your risk tolerance and market conditions.
Timeframe & EMA Settings: Adjust the core moving averages that define the trend and pullback zones.
Pullback Settings: Define what constitutes a valid pullback by adjusting the lookback period and the size of the ATR-based "near" zone.
Quality Filters: This is the most important section for tailoring the script's strictness. Increase the EMA Slope, RSI Dead Zone, or Signal Cooldown to receive fewer but potentially higher-quality signals.
Advanced Filters: Enable or disable the Pullback Quality and Volatility filters for an extra layer of confirmation or risk management.
No-Trade Zone Highlighter: Adjust the session and timezone to highlight periods you wish to avoid, such as news events or low-liquidity hours.
Happy trading, and please use this tool responsibly.

Strategy with DI+/DI-, ADX, RSI, MACD, EMA + Time Stop [EXP. 1]Strategy Overview
This is an experimental trend-following strategy combining directional movement indicators, momentum filters, and time-based exits. Built for low timeframes like BTCUSDT 5m, it aims to detect clean directional setups while managing risk tightly.
Indicator Components
• DI+/DI- + ADX – Confirms trend direction and strength
• RSI (14) – Momentum filter (entries only if RSI > 55 or < 45)
• MACD Histogram – Confirms momentum shift in signal direction
• Candle Body % Filter – Screens for strong price commitment bars
• EMA 600 & EMA 2400 – Defines long-term trend alignment
• Time-Based Stop – Closes trade if it doesn’t move 0.75% in 85 bars
• Reward:Risk – 1% stop-loss, 7.5:1 reward-to-risk
• One Trade per EMA Cross – Only trades first valid signal per trend shift
Entry Logic
Long Entry:
• DI+ crosses above DI−
• RSI > 55
• MACD histogram > 0
• Strong bullish candle
• EMA600 > EMA2400
• Occurs within 25 bars of an EMA crossover
Short Entry:
• DI+ crosses below DI−
• RSI < 45
• MACD histogram < 0
• Strong bearish candle
• EMA2400 > EMA600
• Occurs within 25 bars of an EMA crossover
Exit Logic
• Stop-loss: 1% from entry
• Take-profit: 7.5x risk
• Time-stop: Trade closed if price doesn’t move 0.75% in 85 bars
Testing Parameters
• Initial Capital: $10,000
• Commission: 0.04% per trade
• Timeframe: 5-minute
• Tested on: BTCUSDT
• ⚠️ Early-stage strategy — trade count may be low depending on market context. This is shared for educational use and community feedback.
Notes
• This script is experimental and educational
• Please forward-test in a demo environment before using it live
• Open-source for learning and improvement — contributions welcome!

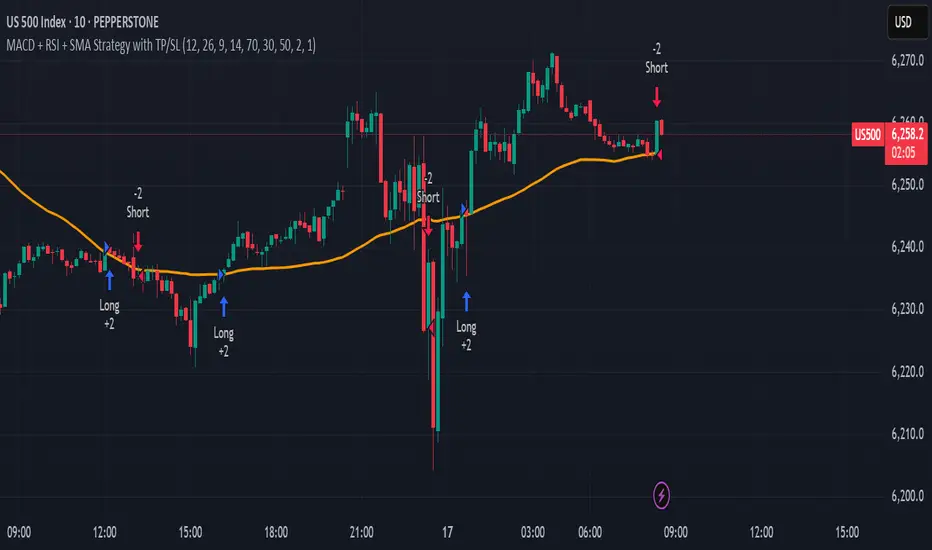
MACD + RSI + SMA Strategy with TP/SLThis strategy combines three technical indicators: MACD, RSI, and Simple Moving Average (SMA) to identify high-probability entry points. It enters trades in the direction of the trend (filtered by SMA), confirms momentum shifts (via MACD crossover), and validates signals with RSI to avoid overbought/oversold conditions.
Key Features:
Directional filter using SMA to align trades with the broader trend.
Momentum validation with MACD crossovers.
Risk control through RSI thresholds and fixed percentage-based Take Profit and Stop Loss levels.
Works for both long and short positions.
Disclaimer: This is a sample strategy for educational purposes only.
Trading involves risk. Use at your own discretion.
You bear full responsibility for any profit or loss.
day trading check indicatorDay Trading Check Indicator
By Trades per Minute · Creator: Trader Malik
Overview
The Day Trading Check Indicator is an on‐chart status panel that gives you a quick “go/no-go” snapshot of four key metrics—MACD, VWAP, Float, and Bearish Sell-Off—directly in TradingView’s top-right corner. It’s designed for fast decision-making during high-velocity intraday sessions, letting you instantly see whether each metric is “bullish” (green) or “bearish” (red), plus live float data.
What It Shows
Column Description
Metric The name of each metric: MACD, VWAP, Float, Bearish Sell-Off
Status/Value A color-coded status (“GREEN”/“RED” or “YES”/“NO”) or the float value formatted in K/M/B
Metrics & Calculations
MACD (1-Minute)
Calculation: Standard MACD using EMA (12) – EMA (26) with a 9-period signal line, all fetched from the 1-minute timeframe via request.security().
Status:
GREEN if MACD ≥ Signal
RED if MACD < Signal
VWAP (Session-Anchored)
Calculation: Built-in session VWAP (ta.vwap(close)) resets each new trading session.
Status:
GREEN if current price ≥ VWAP
RED if current price < VWAP
Float
Calculation: Retrieves syminfo.shares_outstanding_float (total float), then scales it into thousands (K), millions (M), or billions (B), e.g. “12.3 M.”
Display: Always shown as the absolute float value, white on semi-transparent black.
Bearish Sell-Off
Calculation: Checks the last five 1-minute bars for any “high-volume down” candle (volume above its 20-bar SMA and close < open).
Status:
YES if at least one such bar occurred in the past 5 minutes
NO otherwise
Key Features
Dynamic Table: Automatically shows only the metrics you enable via the Display Options group.
Size Selector: Choose Small, Medium, or Large text for easy visibility.
Clean Styling: Distinct header row with custom background, consistent row shading, centered status text, and a subtle gray border.
Lightweight Overlay: No cluttering plots—just a concise status panel in the corner.
Published by Trader Malik / Trades per Minute
Version: Pine Script v5

MACD Trend StatusOverview:
The Dynamic MACD Trend Status indicator is a sophisticated yet easy-to-interpret tool designed to provide instant, color-coded insights into the current MACD momentum and trend strength directly on your chart. Unlike traditional MACD indicators that clutter your main price panel, this indicator distills complex MACD calculations into a single, prominent text label, ideal for quick confirmations and fast-paced trading.
It features two distinct logic modes, allowing you to customize its sensitivity and confirmation level, making it adaptable to various market conditions and trading styles.
Key Features & How It Works:
Two Selectable Logic Modes:
This indicator offers a unique dropdown setting (Logic Selection) to switch between two powerful MACD interpretation algorithms:
a) Option 3 (Robust) - (Default)
This is the most stringent and reliable mode, designed to filter out market noise and highlight only strong, accelerating trends. It declares a "Bullish" or "Bearish" status when ALL of the following conditions are met:
Bullish: MACD Line is above Signal Line AND MACD Histogram is positive AND MACD Histogram is increasing (momentum is accelerating) AND both MACD Line and Signal Line are above the Zero Line (confirming an overall uptrend).
Bearish: MACD Line is below Signal Line AND MACD Histogram is negative AND MACD Histogram is decreasing (momentum is accelerating) AND both MACD Line and Signal Line are below the Zero Line (confirming an overall downtrend).
Neutral: If none of the above strong conditions are met, indicating sideways movement, weakening momentum, or a transition phase.
b) Option 4 (Simplified + Enhanced)
This mode offers a more responsive signal while still providing a clear distinction for exceptionally strong moves. It determines status based on:
"MACD Bullish +" (Super Bullish): If all the rigorous conditions of "Option 3 (Robust) - Bullish" are met. This provides an immediate visual cue of extreme bullish strength within the simpler logic.
"MACD Bearish +" (Super Bearish): If all the rigorous conditions of "Option 3 (Robust) - Bearish" are met. This highlights exceptional bearish strength.
"MACD Bullish": MACD Line is above Signal Line AND MACD Histogram is positive (basic bullish momentum).
"MACD Bearish": MACD Line is below Signal Line AND MACD Histogram is negative (basic bearish momentum).
"MACD Neutral": If none of the above conditions are met.
Instant Color-Coded Status:
The indicator provides clear visual feedback through dynamic text colors:
Green: "MACD Bullish" (Standard Bullish)
Red: "MACD Bearish" (Standard Bearish)
Gray: "MACD Neutral" (Choppy/Unclear)
Blue: "MACD Bullish +" (Enhanced Strong Bullish - when using Option 4)
Fuchsia/Purple: "MACD Bearish +" (Enhanced Strong Bearish - when using Option 4)
(Note: Colors for "+" signals are customizable in the code if you wish)
Unobtrusive Display:
The status is displayed in a transparent, discreet table positioned at the middle-right of your main chart panel. This avoids cluttering the top corners or the indicator sub-panel, keeping your price action clear.
Ideal Use Cases:
Quick Confirmation: Rapidly confirm your trade ideas with a glance at the MACD's underlying momentum.
Scalping & Day Trading: The instant visual feedback is invaluable for fast-paced short-term strategies.
Momentum Filtering: Use it to filter trades, ensuring you're entering when MACD momentum is in your favor.
Complementary Tool: Designed to work hand-in-hand with your primary analysis (price action, support/resistance, other indicators). It's not intended as a standalone signal but as a powerful re-confirmation tool.
Customization Options:
MACD Settings: Adjust Fast Length, Slow Length, and Signal Length.
Logic Selection: Toggle between "Option 3 (Robust)" and "Option 4 (Simplified)" for different sensitivities.
Show Status Text: Toggle the visibility of the status text On/Off.
Text Size: Choose from "tiny", "small", "normal", "large", "huge" for optimal visibility.
Important Disclaimer:
This indicator is a technical analysis tool and should be used as part of a comprehensive trading strategy. It is not financial advice. Trading in financial markets involves substantial risk, and you could lose money. Always perform your own research and risk management.
Better MACD📘 Better MACD – Adaptive Momentum & Divergence Suite
Better MACD is a comprehensive momentum-trend tool that evolves the traditional MACD into a multi-dimensional, divergence-aware oscillator. It leverages exponential smoothing across logarithmic rate-of-change of OHLC data, adaptive signal processing, and intelligent divergence detection logic to provide traders with earlier, smoother, and more reliable momentum signals.
This indicator is built for professional-level analysis, suitable for scalping, swing trading, and trend-following systems.
🧬 Core Concept
Unlike the classic MACD which subtracts two EMAs of price, Better MACD constructs a signal by:
Applying logarithmic transformation on the change between OHLC components (Close, High, Low, Open).
Using double EMA smoothing to filter noise and volatility, Triangular method. 1st to 2nd Smoothing.
Averaging and de-biasing the results through a custom linear regression model, 4th Smoothing.
Subtracting a fast SMA and slow SMA response to yield a dynamic MACD value, 3rd Smoothing.
The result is a smooth, adaptive, and high-resolution MACD-style oscillator that responds more naturally to trend conditions and price geometry.
🧠 Features Breakdown
1. 📈 Multi-Layer MACD Engine
Src1: Smoothed Log Rate-of-Change on Close
Src2: Smoothed Log Rate-of-Change on High
Src3: Smoothed Log Rate-of-Change on Low
Src4: Smoothed Log Rate-of-Change on Open
These are blended using highest high, lowest low, and average Close price over a configurable window for more complete trend detection. The open-based Src4 is subtracted using SMA.
2. 🧮 Signal Line
A fast EMA (signalLength) of the Better MACD value is used for crossover logic.
Crossovers of MACD and Signal line signal potential entries or exits.
3. 📊 MACD Histogram
Visualizes the difference between MACD and Signal line.
Dynamically color-coded:
Green/Light Green for bullish impulse
Red/Pink for bearish impulse
Width and color intensity reflect strength and momentum slope.
🎨 Visual Enhancements
Feature Description
✅ Ribbon Fill Optional fill between MACD and Signal line, colored by trend direction
✅ Zero-Line Background Background highlights above/below 0 to easily read bullish/bearish bias
✅ Crossover Highlights Tiny circles plotted when MACD crosses Signal line
🔍 Divergence Detection Suite
The script includes a full Divergence Engine to detect:
🔼 Bullish Regular Divergence (Price lower lows + Indicator higher lows)
🔽 Bearish Regular Divergence (Price higher highs + Indicator lower highs)
🟢 Bullish Hidden Divergence (Price higher lows + Indicator lower lows)
🔴 Bearish Hidden Divergence (Price lower highs + Indicator higher highs)
🧩 Divergence Modes:
Supports both Regular, Hidden, or Both simultaneously
Detects from either Close Price or Heikin Ashi-derived candles
Uses dynamic pivot tracking with configurable lookback and divergence sensitivity
Divergence lines are labeled, colored, and plotted in real-time
🔁 Styling & Customization:
Choose from Solid, Dashed, or Dotted line styles
Configure separate colors and widths for all divergence types
Control number of divergence lines visible or only show the most recent
Divergences update live without repainting
⚠️ Alerts
Alerts are built-in for real-time notification:
MACD Histogram reversals (rising → falling, or vice versa)
Divergence signals (all 4 types, grouped and individually)
Combines seamlessly with TradingView alerts for actionable triggers
🔧 Input Controls (Grouped by Purpose)
Better MACD Group
1st–4th Smoothing Lengths: Controls responsiveness of MACD core engine
Signal Length: Smoothness of signal line
Toggles for crossover highlights, zero cross fills, and ribbon fills
Divergence Settings
Enable/disable divergence lines
Choose divergence type (Regular, Hidden, Both)
Set confirmation requirements
Customize pivot detection and bar search depth
Styling Options
Colors, line widths, and line styles for each divergence type
Heikin Ashi Mode for smoother pivots and divergences
🧠 How to Use
✅ For Trend Traders:
Use MACD > Signal + Histogram > 0 → Bullish confirmation
MACD < Signal + Histogram < 0 → Bearish confirmation
Wait for pullbacks with hidden divergences to enter in trend direction
✅ For Reversal Traders:
Look for Regular Divergences at trend exhaustion points
Combine with price action (e.g., support/resistance or candle pattern)
✅ For Swing & Day Traders:
Enable Heikin Ashi Mode for smoother divergence pivots
Use zero line background + histogram color to time entries
📌 Summary
Feature Description
🚀 Advanced MACD Core Smoother, more reliable, multi-source-based MACD
🔍 Divergence Engine Detects 4 divergence types with pivot logic
🎯 Real-Time Alerts Alerts for histogram slope and divergences
🎛️ Deep Customization Full styling, smoothing, and detection controls
📉 Heikin Ashi Support Improved signal quality in trend-based markets

ANDROMEDA - TrendSyncANDROMEDA - TrendSync
Pedro Canto - Portfolio Manager | CGA/CGE
OVERVIEW
Trend Sync is a multi-layered trend-following indicator designed to help traders identify high-probability trend continuation setups while avoiding low-quality entries caused by overbought or oversold market conditions.
This indicator combines the power of Moving Averages (MA), MACD , and a visual RSI-based filter to validate both trend direction and timing for entries. It's goal is simple: filter out noise and highlight only the most technically relevant buy and sell signals based on objective momentum and trend criteria.
---
WALKTHROUGH
This indicator is built for traders seeking to operate in the direction of established trends. It's core principle is to identify and validate current trend conditions, and then signal entry opportunities during pullbacks to key moving averages.
Trend identification is achieved through the alignment of two moving averages. When these MAs are crossed and angled in the same direction, they confirm that a trend is in progress. To double-confirm trend direction, the MACD histogram is used—only. When both the MAs and MACD are aligned in the same direction, then the trend is considered valid.
Once all trend criteria are met, a dynamic coloring system is activated to visually reinforce the trend across the candles and moving averages.
To avoid poor entries during market exhaustion, an RSI-based filter is used. This short-term RSI highlights overbought or oversold zones, helping traders filter trades in extreme price conditions.
Only when the trend is validated and price pulls back to one of the MAs will a buy/sell signal be triggered, aligning momentum, price action and timing into a single actionable setup.
This combination ensures that each component plays a specific role:
i) Moving Averages define the trend
ii) MACD validates it
iii) RSI filters noise
iv) Intrabar price action triggers entries
This synchronism helps improve decision-making and entry timing, especially for swing and intraday traders.
---
USE CASES
- Identifying trend continuation setups
- Filtering false signals during consolidation phases
- Avoiding trades in overbought or oversold zones
- Enhancing entry timing for both swing and intraday strategies
- Providing visual confirmation of trend strength and momentum alignment
---
KEY FEATURES
1. Dual Moving Average Setup
The indicator allows full customization of two moving averages (MA1 and MA2), supporting both EMA and SMA types. The slope of the longer MA (MA2) acts as an essential trend filter, ensuring signals are only generated when the market shows clear directional bias.
2. MACD Histogram Trend Confirmation
A classic MACD Histogram calculation is used to validate the momentum of the prevailing trend.
- Bullish Trend: Histogram > 0
- Bearish Trend: Histogram < 0
This step filters out counter-trend signals and ensures trades are aligned with momentum.
3. Intrabar Price Trigger
Unlike standard crossover systems, this indicator waits for intrabar price action to trigger entries:
- Buy Signal: Price crosses below one of the MAs during an uptrend (dip-buy logic)
- Sell Signal: Price crosses above one of the MAs during a downtrend (rally-sell logic)
This intrabar trigger improves entry timing and helps capture retracement-based opportunities.
4. RSI Visual Filter
A short-term RSI is plotted and color-coded to visually highlight overbought and oversold conditions, acting as a discretionary filter for users to avoid low-probability trades during exhaustion points.
5. Dynamic Coloring System
Bar Colors:
- Blue: Bullish trend
- Red: Bearish trend
- Orange: RSI Overbought/Oversold zones
MA Colors:
- Blue for bullish conditions
- Red for bearish conditions
- Gray for neutral/no-trend phases
6. Signal Markers and Alerts
Clear visual buy and sell markers are plotted directly on the chart.
Additionally, the indicator includes real-time alerts for both Buy and Sell signals, helping traders stay informed even when away from the screen.
---
INPUTS AND CUSTOMIZATION OPTIONS
- Moving Average Types: EMA or SMA for both MA1 and MA2.
- MACD Settings: Customizable fast, slow, and signal periods.
- RSI Settings: Source, length, and overbought/oversold levels fully adjustable.
- Color Customization: Adjust RSI zone colors to suit your chart theme.
---
DISCLAIMER
This indicator is a technical analysis tool designed for educational and informational purposes only. It should not be used as a standalone trading system. Always combine it with sound risk management, price action analysis, and, where applicable, fundamental context.
Past performance does not guarantee future results.

Universal Sentiment Oscillator with Trade RecommendationsUniversal Sentiment Oscillator & Strategy Guide
Summary
This all-in-one indicator is designed to be a comprehensive co-pilot for your trading journey. It moves beyond simple buy/sell signals by analyzing the underlying market sentiment and providing a dynamic, risk-assessed guide of potential trading strategies. Whether you're a novice learning the ropes or an expert seeking confirmation, this tool provides a structured framework for making smarter, more informed decisions in stocks, options, and futures.
How It Works
The core of the indicator is the Sentiment Oscillator, which calculates a score from -5 (Extremely Bearish) to +5 (Extremely Bullish) on every bar. This isn't just a single measurement; it's a weighted aggregate of several key technical conditions:
Trend Analysis: Price position relative to the 20, 50, and 200 EMAs.
Momentum Analysis: The current RSI value.
Hybrid Analysis: The state of the MACD and its signal line.
These factors are intelligently combined and normalized to produce a single, intuitive sentiment score, giving you an at-a-glance understanding of the market's pulse.
Core Features
Dynamic Trade Recommendation Table:
The informational heart of the indicator. This on-chart table provides a list of potential trades perfectly aligned with the current sentiment score.
Risk-Ranked Strategies:
All suggested trades are logically ordered by risk, helping you quickly identify strategies that match your comfort level.
Adjusted Trade Suggestions:
The indicator analyzes sentiment momentum (the score vs. its signal line) to provide proactive, forward-looking trade ideas based on where the market might be heading next.
Customizable Trading Styles:
Tell the indicator if you are a Conservative, Neutral, or Aggressive trader, and the "Adjusted Trade Suggestion" will automatically tailor its recommendations to your personal risk preference.
Context-Aware Futures Mode:
When viewing a futures contract, enable this mode to switch all recommendations from stock/options to futures-specific actions (e.g., "Cautious Long," "Monitor Range").
Predictive Sentiment Cone:
Visualize the potential short-term path of sentiment based on current momentum, helping you anticipate future conditions.
Fully Customizable:
Every parameter—from EMA lengths to trade filters—can be adjusted, allowing you to fine-tune the indicator to your exact specifications.
How to Use This Indicator
This tool is flexible and can be integrated into many trading systems. Here is a powerful, professional approach:
Top-Down Analysis (for Swing or Position Trading):
Establish the Trend: Start on the higher timeframes (Monthly, Weekly, Daily). Use the oscillator's color and score to define the dominant, long-term market sentiment. You only want to look for trades that align with this macro trend.
Refine the Entry: Drop down to the medium timeframes (4-Hour, 1-Hour). Wait for the sentiment on these charts to come into alignment with the higher-timeframe trend. This pullback or consolidation is your "zone of interest."
Pinpoint the Execution: Move to a lower timeframe (e.g., 15-Minute). Use the Adjusted Trade Suggestion and Sentiment Momentum to find a precise entry as momentum begins to shift back in the direction of the primary trend. You can set alerts on the oscillator's zero-line for early warnings of a sentiment shift.
As a Confirmation Tool: If you have an existing trade idea, use the indicator to validate it. Does the sentiment score align with your bullish or bearish thesis? Does the momentum confirm that now is a good time to enter?
As an Idea Generation Tool: Unsure what to trade? Browse different assets and let the indicator's "Primary Trades" and "Adjusted Trade Suggestion" present you with a list of risk-assessed ideas that you can then investigate further.
Disclaimer: This is an analysis tool and should not be considered financial advice. All forms of trading involve substantial risk. You should not trade with money you cannot afford to lose. Always perform your own due diligence and use this indicator as one component of a complete trading plan.

MACD Breakout SuperCandlesMACD Breakout SuperCandles
The MACD Breakout SuperCandles indicator is a candle-coloring tool that monitors trend alignment across multiple timeframes using a combination of MACD behavior and simple price structure. It visually reflects market sentiment directly on price candles, helping traders quickly recognize shifting momentum conditions.
How It Works
The script evaluates trend behavior based on:
- Multi-timeframe MACD Analysis: Uses MACD values and signal line relationships to gauge trend direction and strength.
- Price Relative to SMA Zones: Analyzes whether price is positioned above or below the 20-period high and low SMAs on each timeframe.
For each timeframe, the script assigns one of five possible trend statuses:
- SUPERBULL: Strong bullish MACD signal with price above both SMAs.
- Bullish: Bullish MACD crossover with price showing upward bias.
- Basing: MACD flattening or neutralizing near zero with no directional dominance.
- Bearish: Bearish MACD signal without confirmation of stronger trend.
- SUPERBEAR: Strong bearish MACD signal with price below both SMAs.
-Ghost Candles: Candles with basing attributes that can signal directional change or trend strength.
Signal Scoring System
The script compares conditions across four timeframes:
- TF1 (Short)
- TF2 (Medium)
- TF3 (Long)
- MACD at a fixed 10-minute resolution
Each status type is tracked independently. A colored candle is only applied when a status type (e.g., SUPERBULL) reaches the minimum match threshold, defined by the "Min Status Matches for Candle Color" setting. If no status meets the required threshold, the candle is displayed in a neutral "Ghost" color.
Customizable Visuals
The indicator offers full control over candle appearance via grouped settings:
Body Colors
- SUPERBULL Body
- Bullish Body
- Basing Body
- Bearish Body
- SUPERBEAR Body
- Ghost Candle Body (used when no match)
Border & Wick Colors
- SUPERBULL Border/Wick
- Bullish Border/Wick
- Basing Border/Wick
- Bearish Border/Wick
- SUPERBEAR Border/Wick
- Ghost Border/Wick
Colors are grouped by function and can be adjusted independently to match your chart theme or personal preferences.
Settings Overview
- TF1, TF2, TF3: Select short, medium, and long timeframes to monitor trend structure.
- Min Status Matches: Set how many timeframes must agree before a candle status is applied.
- MACD Settings: Customize MACD fast, slow, and signal lengths, and choose MA type (EMA, SMA, WMA).
This tool helps visualize how aligned various timeframe conditions are by embedding sentiment into the candles themselves. It can assist with trend identification, momentum confirmation, or visual filtering for discretionary strategies.

Zero Lag MACD + Kijun-sen + EOM StrategyThis strategy offers a robust approach to identifying high-probability trading opportunities in the fast-paced cryptocurrency markets, particularly on lower timeframes (e.g., 5-minute). It leverages the synergistic power of three distinct indicators to confirm entries, ensuring a disciplined approach to risk management.
Key Components:
Zero Lag MACD Enhanced Version 1.2: This core momentum indicator is used to identify precise shifts in trend and momentum, offering reduced lag compared to traditional MACD. Entry signals are filtered based on the histogram's position (below for buys, above for sells) to enhance signal reliability.
Kijun-sen (Ichimoku Cloud): Acting as a dynamic support/resistance and trend filter, the Kijun-sen line confirms the prevailing market direction. Long entries are confirmed when price is above Kijun-sen, and short entries when price is below.
Ease of Movement (EoM): This volume-based oscillator provides crucial confirmation of price movements by measuring the ease with which price changes. Positive EoM confirms buying pressure, while negative confirms selling pressure, adding an essential layer of validation to trade setups.
How it Works:
The strategy generates entry signals only when all three indicators align simultaneously:
For Long Entries: A Zero Lag MACD buy signal (crossover below histogram) must coincide with price trading above the Kijun-sen, and the Ease of Movement indicator being above its zero line.
For Short Entries: A Zero Lag MACD sell signal (crossover above histogram) must coincide with price trading below the Kijun-sen, and the Ease of Movement indicator being below its zero line.
Entries are executed at the open of the candle immediately following the signal confirmation.
Risk Management:
Disciplined risk management is paramount to this strategy:
Dynamic Stop-Loss: An Average True Range (ATR) based stop-loss is implemented, set at 2.5 times the current ATR. This adapts the stop-loss distance to market volatility, ensuring sensible risk sizing.
Fixed Take-Profit: A consistent Risk-to-Reward (R:R) ratio of 1:1.2 is applied for all trades, promoting stable profit realization.
Customization & Optimization:
The strategy is built with fully customizable input parameters for each indicator (MACD lengths, Kijun-sen period, ATR period, ATR multiplier, and Risk-to-Reward ratio). This allows users to fine-tune the strategy for different assets, timeframes, and market conditions, facilitating robust backtesting and optimization.
Disclaimer: Trading involves substantial risk and is not suitable for all investors. Past performance is not indicative of future results. This strategy is provided for educational and informational purposes only. Always use proper risk management and conduct your own due diligence.

Ashpi CVD + MACD AlertMACD Crossing + CVD Support
Red arrows signal short entries above the MACD zero line.
Green arrows signal long entries below the zero line.
Blue arrows indicate a re-entry into an existing long trend (crossing above the zero line), typically on pull-backs.
Yellow arrows indicate a re-entry into an existing short trend (crossing below the zero line).
Time-Frame Setup
- Entry on the 15-second chart
- Confirmation on the 30-second chart
- Trade management on the 1-minute chart (or higher)
Always follow the primary trend: RED = Short, GREEN = Long.
Sequence
1. RED signal appears → enter short
2. During the trade, if a GREEN arrow appears on the pull-back → exit trade, or add to position on a YELLOW arrow if the trend continues
The same applies to long trades and BLUE arrows.
Using EMAs (20, 50, 200) can help you spot structural breaks more clearly.
Signal Strength (Delta Distance to Zero Line)
The strength of each signal is enhanced by displaying the distance (delta) to the zero line in the chart:
- Green numbers mean the delta is already above its 10-period moving average (MA10).
- Red numbers mean the delta is below its MA10.
Identifying Sideways Markets
Use a standard MACD as an additional filter to spot ranging phases.
If YELLOW and BLUE arrows occur frequently in succession, it indicates the two MACD lines are moving very close together—trading such conditions should generally be avoided.

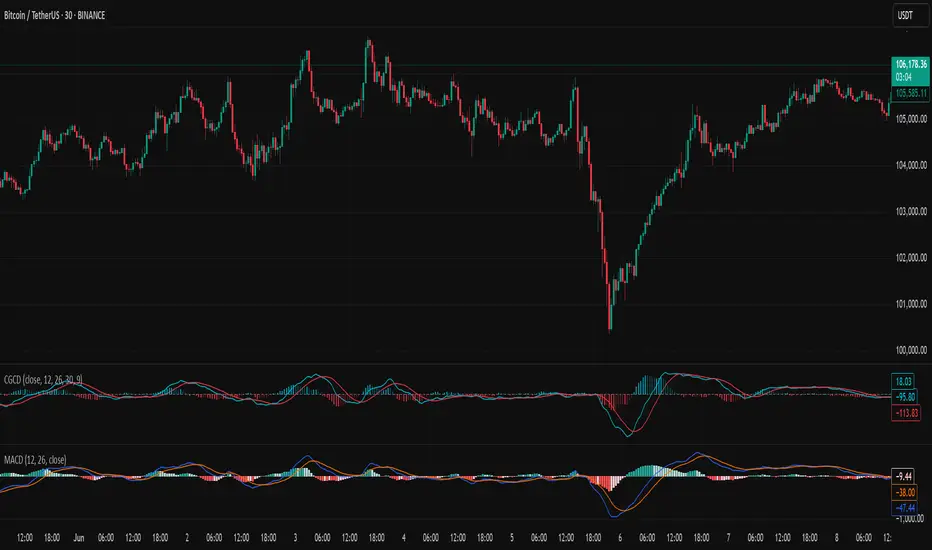
Chebyshev-Gauss Convergence DivergenceThe Chebyshev-Gauss Convergence Divergence is a momentum indicator that leverages the Chebyshev-Gauss Moving Average (CG-MA) to provide a smoother and more responsive alternative to traditional oscillators like the MACD. For more information see the moving average script:
How it works:
It calculates a fast CG-MA and a slow CG-MA. The CG-MA uses Gauss-Chebyshev quadrature to compute a weighted average, which can offer a better trade-off between lag and smoothness compared to simple or exponential MAs.
The Oscillator line is the difference between the fast CG-MA and the slow CG-MA.
A Signal Line, which is a simple moving average of the Oscillator line, is plotted to show the average trend of the oscillator.
A Histogram is plotted, representing the difference between the Oscillator and the Signal Line. The color of the histogram bars changes to indicate whether momentum is strengthening or weakening.
How to use:
Crossovers: A buy signal can be generated when the Oscillator line crosses above the Signal line. A sell signal can be generated when it crosses below.
Zero Line: When the Oscillator crosses above the zero line, it indicates upward momentum (fast MA is above slow MA).When it crosses below zero, it indicates downward momentum.
Divergence: Like with the MACD, look for divergences between the oscillator and price action to spot potential reversals.
Histogram: The histogram provides a visual representation of the momentum. When the bars are growing, momentum is increasing. When they are shrinking, momentum is fading.
MACD Full [Titans_Invest]MACD Full — A Smarter, More Flexible MACD.
Looking for a MACD with real customization power?
We present one of the most complete public MACD indicators available on TradingView.
It maintains the classic MACD structure but is enhanced with 20 fully customizable long entry conditions and 20 short entry conditions , giving you precise control over your strategy.
Plus, it’s fully automation-ready, making it ideal for quantitative systems and algorithmic trading.
Whether you're a discretionary trader or a bot developer, this tool is built to seamlessly adapt to your style.
⯁ WHAT IS THE MACD❓
The Moving Average Convergence Divergence (MACD) is a technical analysis indicator developed by Gerald Appel. It measures the relationship between two moving averages of a security’s price to identify changes in momentum, direction, and strength of a trend. The MACD is composed of three components: the MACD line, the signal line, and the histogram.
⯁ HOW TO USE THE MACD❓
The MACD is calculated by subtracting the 26-period Exponential Moving Average (EMA) from the 12-period EMA. A 9-period EMA of the MACD line, called the signal line, is then plotted on top of the MACD line. The MACD histogram represents the difference between the MACD line and the signal line.
Here are the primary signals generated by the MACD:
Bullish Crossover: When the MACD line crosses above the signal line, indicating a potential buy signal.
Bearish Crossover: When the MACD line crosses below the signal line, indicating a potential sell signal.
Divergence: When the price of the security diverges from the MACD, suggesting a potential reversal.
Overbought/Oversold Conditions: Indicated by the MACD line moving far away from the signal line, though this is less common than in oscillators like the RSI.
⯁ ENTRY CONDITIONS
The conditions below are fully flexible and allow for complete customization of the signal.
______________________________________________________
🔹 CONDITIONS TO BUY 📈
______________________________________________________
• Signal Validity: The signal will remain valid for X bars .
• Signal Sequence: Configurable as AND or OR .
🔹 MACD > Signal Smoothing
🔹 MACD < Signal Smoothing
🔹 Histogram > 0
🔹 Histogram < 0
🔹 Histogram Positive
🔹 Histogram Negative
🔹 MACD > 0
🔹 MACD < 0
🔹 Signal > 0
🔹 Signal < 0
🔹 MACD > Histogram
🔹 MACD < Histogram
🔹 Signal > Histogram
🔹 Signal < Histogram
🔹 MACD (Crossover) Signal
🔹 MACD (Crossunder) Signal
🔹 MACD (Crossover) 0
🔹 MACD (Crossunder) 0
🔹 Signal (Crossover) 0
🔹 Signal (Crossunder) 0
______________________________________________________
______________________________________________________
🔸 CONDITIONS TO SELL 📉
______________________________________________________
• Signal Validity: The signal will remain valid for X bars .
• Signal Sequence: Configurable as AND or OR .
🔸 MACD > Signal Smoothing
🔸 MACD < Signal Smoothing
🔸 Histogram > 0
🔸 Histogram < 0
🔸 Histogram Positive
🔸 Histogram Negative
🔸 MACD > 0
🔸 MACD < 0
🔸 Signal > 0
🔸 Signal < 0
🔸 MACD > Histogram
🔸 MACD < Histogram
🔸 Signal > Histogram
🔸 Signal < Histogram
🔸 MACD (Crossover) Signal
🔸 MACD (Crossunder) Signal
🔸 MACD (Crossover) 0
🔸 MACD (Crossunder) 0
🔸 Signal (Crossover) 0
🔸 Signal (Crossunder) 0
______________________________________________________
______________________________________________________
🤖 AUTOMATION 🤖
• You can automate the BUY and SELL signals of this indicator.
______________________________________________________
______________________________________________________
⯁ UNIQUE FEATURES
______________________________________________________
Signal Validity: The signal will remain valid for X bars
Signal Sequence: Configurable as AND/OR
Condition Table: BUY/SELL
Condition Labels: BUY/SELL
Plot Labels in the Graph Above: BUY/SELL
Automate and Monitor Signals/Alerts: BUY/SELL
Signal Validity: The signal will remain valid for X bars
Signal Sequence: Configurable as AND/OR
Table of Conditions: BUY/SELL
Conditions Label: BUY/SELL
Plot Labels in the graph above: BUY/SELL
Automate & Monitor Signals/Alerts: BUY/SELL
______________________________________________________
📜 SCRIPT : MACD Full
🎴 Art by : @Titans_Invest & @DiFlip
👨💻 Dev by : @Titans_Invest & @DiFlip
🎑 Titans Invest — The Wizards Without Gloves 🧤
✨ Enjoy!
______________________________________________________
o Mission 🗺
• Inspire Traders to manifest Magic in the Market.
o Vision 𐓏
• To elevate collective Energy 𐓷𐓏

MACD + RSI + EMA + BB + ATR Day Trading StrategyEntry Conditions and Signals
The strategy implements a multi-layered filtering approach to entry conditions, requiring alignment across technical indicators, timeframes, and market conditions .
Long Entry Requirements
Trend Filter: Fast EMA (9) must be above Slow EMA (21), price must be above Fast EMA, and higher timeframe must confirm uptrend
MACD Signal: MACD line crosses above signal line, indicating increasing bullish momentum
RSI Condition: RSI below 70 (not overbought) but above 40 (showing momentum)
Volume & Volatility: Current volume exceeds 1.2x 20-period average and ATR shows sufficient market movement
Time Filter: Trading occurs during optimal hours (9:30-11:30 AM ET) when market volatility is typically highest
Exit Strategies
The strategy employs multiple exit mechanisms to adapt to changing market conditions and protect profits :
Stop Loss Management
Initial Stop: Placed at 2.0x ATR from entry price, adapting to current market volatility
Trailing Stop: 1.5x ATR trailing stop that moves up (for longs) or down (for shorts) as price moves favorably
Time-Based Exits: All positions closed by end of trading day (4:00 PM ET) to avoid overnight risk
Best Practices for Implementation
Settings
Chart Setup: 5-minute timeframe for execution with 15-minute chart for trend confirmation
Session Times: Focus on 9:30-11:30 AM ET trading for highest volatility and opportunity

Zero Lag Multi Timeframe MACDCommon parts of the Multi Time Frame MACD
Why This MACD is Special
Traditional MACD (Moving Average Convergence Divergence) is a powerful trend-following indicator, but it has a key limitation: it only reflects price action on a single timeframe. Traders who rely on top-down analysis—analyzing higher timeframes first before moving to lower ones—often face a frustrating delay.
The Problem with Traditional Multi-Timeframe MACD with top down analysis:
If you’re on a 5-minute chart and want to see the 1-hour MACD, you must wait for 12 candles (1 hour) to close before the MACD updates.
This lag means you miss real-time signals and react too late to trend changes.
The Zero Lag Multi-Timeframe MACD solves this by using a custom time-adjusted formula (developed by CoffeeShopCrypto) that projects higher timeframe MACD values onto lower timeframe charts in real time.
How Traders Normally Use MACD
Single-Timeframe MACD (Traditional Approach)
Used for trend identification (bullish/bearish).
Crossovers (MACD line crossing signal line) signal potential entries.
Divergences (price vs. MACD direction) warn of trend exhaustion.
Top-Down Analysis with Standard MACD (Manual Switching)
1. Check higher timeframe (e.g., 1-hour) for trend direction.
2. Switch to lower timeframe (e.g., 5-minute) for entries.
Problem: You must constantly switch charts and wait for higher timeframe candles to close.
This MACD Eliminates the Need for Switching
Higher timeframe MACD is plotted in real time on your lower timeframe chart.
No waiting for candle closes—instant trend confirmation.
Single-chart top-down analysis without switching timeframes.
How to Use This MACD for Trading
Since the MACD is an averaging indicator, it works best when trading with the trend. This version enhances that by showing two trends at once:
Lower Timeframe (LTF) MACD – Your current chart’s trend.
Higher Timeframe (HTF) MACD – The dominant trend.
Key Trading Rules
1. Strong Uptrend Setup (Best for Long Entries)
HTF MACD line is rising & above zero (strong bullish momentum).
LTF MACD line is also rising (confirms alignment).
Entry: Look for LTF MACD to cross above signal line.
Long Entry Confirmation:
When both the High Timeframe and Low Timeframe MACD Lines are moving in the same direction, this is a confirmation that both the HTF is matching the direction of the LTF.
In this example both MACD Lines are moving long so we are only looking to take long entries at this point forward.
Short Entry Confirmation:
When both the High Timeframe and Low Timeframe MACD Lines are moving in the same direction, this is a confirmation that both the HTF is matching the direction of the LTF.
In this example both MACD Lines are moving short so we are only looking to take long entries at this point forward.
2. Potential Reversal or Weak Uptrend
Trend Divergence Confirmation
This example shows you a confirmation of divergence between the trends. Its best to watch for a continuation of the previous major trend. In this example, we just came off a downtrend with a GAP DOWN.
How to see it: (Trend Divergence)
Two things will help you confirm this divergence
1.Notice the LTF and HTF MACD are moving away from each other.
2. Both the HTF and LTF Histogram are shrinking.
This is an expression of lack of trend.
What to do:
High Timeframe Trends are always the lead so wait for the Low Timeframe to catch up to the High Timeframe trend.
Limitations:
The Exponential Moving Average calculation can only be applied to the Low Timeframe MACD because of the way its weighted against more recent price action and closing values.
This same EMA calculation can not be applied to the High Timeframe MACD as its being recalculated and the result means you can not weigh values against its current plot point.
Low Timeframe MACD can use EMA / SMA
High Timeframe MACD can only use SMA

MACD Crossover with Price Action and AlertsThe MACD should use the default parameters (12, 26, 9) for fast EMA, slow EMA, and signal EMA, respectively, applied to the Close price. Instead of simple MACD crossovers, the indicator should analyze price action in relation to the MACD histogram to generate signals. Specifically: 1. BUY signal: Generate a buy signal (an up arrow displayed below the low of the signal bar in green color) when the MACD histogram crosses above zero AND the price action shows a bullish engulfing pattern (the current candle's body completely engulfs the previous candle's body). 2. SELL signal: Generate a sell signal (a down arrow displayed above the high of the signal bar in red color) when the MACD histogram crosses below zero AND the price action shows a bearish engulfing pattern (the current candle's body completely engulfs the previous candle's body). The arrows should be non-repainting, meaning that once an arrow is plotted on a bar, it should not disappear or change position as the chart updates. The indicator should also plot the MACD line, signal line, and histogram using their default calculations. The MACD line should be blue, the signal line should be orange, and the histogram should be displayed using green bars for positive values and red bars for negative values. The indicator should also have customizable inputs for the MACD fast EMA period, slow EMA period, signal EMA period and engulfing pattern check enabled/disabled. If engulfing pattern check disabled, the indicator will generate signals based only on MACD histogram crossing zero.
Adaptive Multi-TF Indicator Table with Presets giua64📌 Script Name:
Adaptive Multi-Timeframe Indicator Table with Presets — giua64
📄 Description:
This script displays an adaptive multi-timeframe dashboard that summarizes the signals of three key technical indicators:
Moving Averages (MAs), Relative Strength Index (RSI), and MACD.
It provides a fast and visually intuitive overview of market conditions across five timeframes (5m, 15m, 30m, 1h, 4h), helping traders quickly identify potential directional biases (e.g., bullish, bearish, or neutral) based on either predefined presets or fully manual settings.
🧰 Preset Configurations:
You can choose between four trading styles, each with optimized indicator parameters:
Scalping
• MAs: 5 / 10 (Fast), 20 / 50 (Slow)
• RSI: 7 periods | Overbought: 70 | Oversold: 30
• MACD: 5 / 13 | Signal: 3
Intraday
• MAs: 9 / 21 (Fast), 50 / 100 (Slow)
• RSI: 14 periods | Overbought: 60 | Oversold: 40
• MACD: 12 / 26 | Signal: 9
Swing
• MAs: 10 / 20 (Fast), 50 / 200 (Slow)
• RSI: 14 periods | Overbought: 65 | Oversold: 35
• MACD: 12 / 26 | Signal: 9
Manual
• Full custom control over all indicator settings.
🛠️ All settings can be customized manually from the options panel, including the exact MA periods, RSI thresholds, and MACD structure.
🧠 How It Works:
For each timeframe, the script evaluates:
MA crossover status (two levels):
The first symbol refers to the crossover of the fast MAs
The second symbol refers to the crossover of the slow MAs
🟢 = Bullish crossover
🔴 = Bearish crossover
➖ = Flat or no clear signal
RSI Direction:
↑ = RSI above upper threshold (potential overbought)
↓ = RSI below lower threshold (potential oversold)
→ = RSI in neutral range
MACD Line vs Signal Line:
↑ = MACD line is above signal line (bullish)
↓ = MACD line is below signal line (bearish)
→ = Flat or neutral signal
Each signal is assigned a numerical score. These are aggregated per timeframe to compute a combined score that reflects the directional bias for that specific time window.
🧠 Adaptive Logic by Asset:
This script is designed to be universally compatible across all asset types — including forex, crypto, stocks, indices, and commodities.
Thanks to its multi-timeframe nature and flexible indicator presets, the script automatically adjusts its behavior based on the asset selected, ensuring relevant analysis without requiring manual recalibration.
🧾 Summary Table Output:
At the bottom of the dashboard, a combined sentiment is displayed for:
3TF → 5m, 15m, 30m
4TF → Adds 1h
5TF → Adds 4h
Each row shows:
Signal → LONG / SHORT / NEUTRAL
Confidence (%) → Based on score aggregation and signal consistency
📌 Customization Options:
Table Position: Left, Right, or Center
Text Size: Small, Normal, or Large
Full Manual Configuration: All MA, RSI, and MACD parameters can be adjusted as needed
⚠️ Disclaimer:
This script is for educational and analytical purposes only.
It does not constitute financial advice or guarantee any trading results.
Always do your own research and apply responsible risk management.
