Premium Fibonacci Buy/Sell [MasoodPro]OVERVIEW
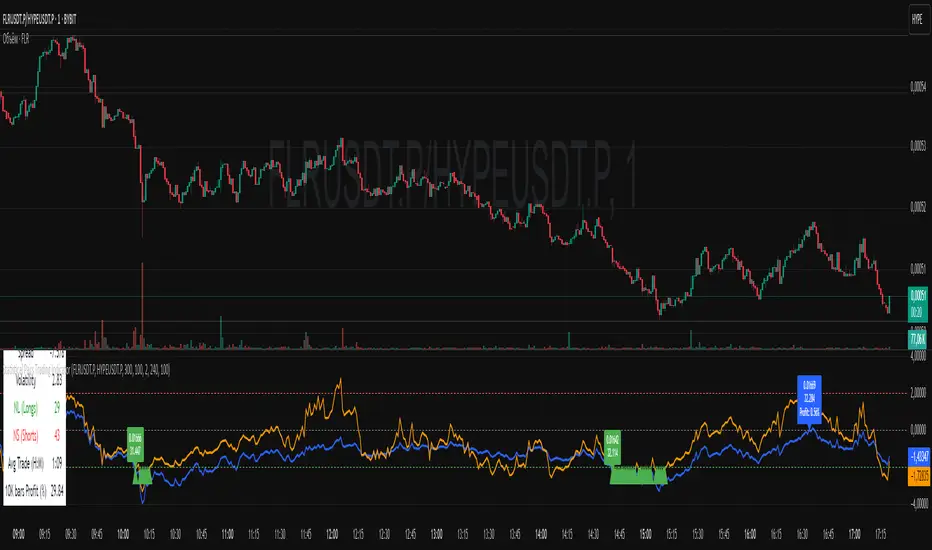
This script plots Fibonacci Entry Bands, a trend-following and mean-reversion hybrid system built around dynamic volatility-adjusted bands scaled using key Fibonacci levels. It calculates a smoothed basis line and overlays multiple bands at fixed Fibonacci multipliers of either ATR or standard deviation. Depending on the trend direction, specific upper or lower bands become active, offering a clear framework for entry timing, trend identification, and profit-taking zones.
CONCEPTS
The core idea is to use Fibonacci levels—0.618, 1.0, 1.618, and 2.618—as multipliers on a volatility measure to form layered price bands around a trend-following moving average. Trends are defined by whether the basis is rising or falling. The trend determines which side of the bands is emphasized: upper bands for downtrends, lower bands for uptrends. This approach captures both directional bias and extreme price extensions. Take-profit logic is built in via crossovers relative to the outermost bands, scaled by user-selected aggressiveness.
FEATURES
Basis Line – A double EMA smoothing of the source defines trend direction and acts as the central mean.
snapshot
Volatility Bands – Four levels per side (based on selected ATR or stdev) mark the Fibonacci bands. These become visible only when trend direction matches the side (e.g., only lower bands plot in an uptrend).
snapshot
Bar Coloring – Bars are shaded with adjustable transparency depending on distance from the basis, with color intensity helping gauge overextension.
snapshot
Entry Arrows – A trend shift triggers either a long or short signal, with a marker at the outermost band with ▲/▼ signs.
snapshot
Take-Profit Crosses – If price rejects near the outer band (based on aggressiveness setting), a cross appears marking potential profit-taking.
snapshot
Bounce Signals – Minor pullbacks that respect the basis line are marked with triangle arrows, hinting at continuation setups.
snapshot
Customization – Users can toggle bar coloring, signal markers, and select between ATR/stdev as well as take-profit aggressiveness.
Alerts – All major signals, including entries, take-profits, and bounces, are available as alert conditions.
Meanreversion

Fair Value Gap Profiles [AlgoAlpha]🟠 OVERVIEW
This script draws and manages Fair Value Gap (FVG) zones by detecting unfilled gaps in price action and then augmenting them with intra-gap volume profiles from a lower timeframe. It is designed to help traders find potential areas where price may return to fill liquidity voids, and to provide extra detail about volume distribution inside each gap to assess strength and likely mitigation. The script automatically tracks each gap, updates its state over time, and can show which gaps are still unfilled or have been mitigated.
🟠 CONCEPTS
A Fair Value Gap is a zone between candles where no trades occurred, often seen as an inefficiency that price later revisits. The script checks each bar to see if a bullish (low above 2-bars-ago high) or bearish (high below 2-bars-ago low) gap has formed, and measures whether the gap’s size exceeds a threshold defined by a volatility-adjusted multiplier of past gap widths (to only detect significantly large gaps). Once a qualified gap is found, it gets recorded and visualized with a box that can stretch forward in time until filled. To add more context, a mini volume profile is built from a lower timeframe’s price and volume data, showing how volume is distributed inside the gap. The lowest-volume subzone is also highlighted using a sliding window scan method to visualise the true gap (area with least trading activity)
🟠 FEATURES
Visual gap boxes that appear automatically when bullish or bearish fair value gaps are detected on the chart.
Color-coded zones showing bullish gaps in one color and bearish gaps in another so you can easily see which side the gap favors.
Volume profile histograms plotted inside each gap using data from a lower timeframe, helping you see where volume concentrated inside the gap area.
Highlight of the lowest-volume subzone within each gap so you can spot areas price may target when filling the gap.
Dynamic extension of the gap boxes across the chart until price comes back and fills them, marking them as mitigated.
Customizable colors and transparency settings for gap boxes, profiles, and low-volume highlights to match your chart style.
Alerts that notify you when a new gap is created or when price fills an existing gap.
🟠 USAGE
This indicator helps you find and track unfilled price gaps that often act as magnets for price to revisit. You can use it to spot areas where liquidity may rest and plan entries or exits around these zones.
The colored gap boxes show you exactly where a fair value gap starts and ends, so you can anticipate potential pullbacks or continuations when price approaches them.
The intra-gap volume profile lets you gauge whether the gap was created on strong or thin participation, which can help judge how likely it is to be filled. The highlighted lowest-volume subzone shows where price might accelerate once inside the gap.
Traders often look for entries when price returns to a gap, aiming for a reaction or reversal in that area. You can also combine the mitigation alerts with your trade management to track when gaps have been closed and adjust your bias accordingly. Overall, the tool gives a clear visual reference for imbalance zones that can help structure trades around supply and demand dynamics.

The Great Anchors: Dual AVWAP Powered by RSI
The Great Anchors
*Dual Anchored Volume Weighted Average Price Powered by RSI*
---
📌 Overview
The Great Anchors is a dual AVWAP-based indicator that resets dynamically using RSI extremes — either from the current asset or a master symbol (e.g., BTCUSDT). It identifies meaningful shifts in price structure and momentum using these "anchored" levels.
It’s designed to help traders spot trend continuations, momentum inflection points, and entry signals aligned with overbought/oversold conditions — but only when the market confirms through volume-weighted price direction.
---
🛠 Core Logic
• AVWAP 1 (favwap): Anchored when RSI reaches overbought levels (top anchor)
• AVWAP 2 (savwap): Anchored when RSI reaches oversold levels (bottom anchor)
• AVWAPs are recalculated each time a new OB/OS condition is triggered — acting like "fresh anchors" at key market turning points.
---
⚙️ Key Features
🔁 Auto or Manual RSI Thresholds
→ Automatically determines dynamic RSI OB/OS levels based on past peaks and troughs, or lets you set fixed levels.
🧠 Master Symbol Control
→ Use the RSI of a separate asset (like BTCUSDT, ETHUSDT, SOLUSDT, BNBUSDT, SUPRAUSDT) or indices (like TOTAL, TOTAL2, BFR) to control resets — ideal for tracking how BTC/major coins impacts altcoins/others.
🔍 Trend-Filtering Signal Logic
→ Signals are filtered for less noise and are triggered when:
- Both AVWAPs are rising (bullish) or falling (bearish)
- Price action confirms the structure
🎯 Visual Markers & Alerts
→ "💥" for bullish signals and "🔥" for bearish ones. Alerts included for automation or push notifications.
---
🎯 How to Use It
1. Add the indicator to your chart.
2. Choose whether to use RSI from the current symbol or a master symbol (e.g., BTC).
3. Select auto-adjusted or manual OB/OS levels.
4. Watch for:
- AVWAP(s) making a significant change (at this point it's one of the AVWAPs resetting)
- Check if price flip it upwards or downwards
- If price goes above both AVWAPs thats a likely bullish trend
- If price can't go above both AVWAPs up and fall bellow both that's a likely bearish trend
- Price retesting upper AVWAP and bounce
- likely bullish continuation
- Price retesting lower AVWAP and dip
- likely bearish continuation
- Signal icons on chart ("💥 - Bullish" or "🔥- Bearish")
Best suited for:
• Swing traders
• Momentum traders
• Traders timing altcoin entries using BTC/Major asset's RSI
---
🔔 Signal Explanation
💥 Bullish Signal =
• Both AVWAPs rising
• Higher lows in price structure
• Bullish candle close
• Triggered from overbought RSI reset
🔥 Bearish Signal =
• Both AVWAPs falling
• Lower highs in price structure
• Bearish candle close
• Triggered from oversold RSI reset
Signals reset by opposite signals to prevent noise or overfitting.
---
⚠️ Tips & Notes
• Use AVWAPs as dynamic support/resistance, even without signal triggers
• Pair with volume or divergence tools for stronger confirmation
---
🧩 Credits & Philosophy
This tool is built with a simple philosophy:
"Anchor your trades to meaningful moments in price — not arbitrary time."
The dual AVWAP concept helps you see how price reacts after momentum peaks, giving you a cleaner bias and more precise trade setups.
---

Machine Learning Key Levels [AlgoAlpha]🟠 OVERVIEW
This script plots Machine Learning Key Levels on your chart by detecting historical pivot points and grouping them using agglomerative clustering to highlight price levels with the most past reactions. It combines a pivot detection, hierarchical clustering logic, and an optional silhouette method to automatically select the optimal number of key levels, giving you an adaptive way to visualize price zones where activity concentrated over time.
🟠 CONCEPTS
Agglomerative clustering is a bottom-up method that starts by treating each pivot as its own cluster, then repeatedly merges the two closest clusters based on the average distance between their members until only the desired number of clusters remain. This process creates a hierarchy of groupings that can flexibly describe patterns in how price reacts around certain levels. This offers an advantage over K-means clustering, since the number of clusters does not need to be predefined. In this script, it uses an average linkage approach, where distance between clusters is computed as the average pairwise distance of all contained points.
The script finds pivot highs and lows over a set lookback period and saves them in a buffer controlled by the Pivot Memory setting. When there are at least two pivots, it groups them using agglomerative clustering: it starts with each pivot as its own group and keeps merging the closest pairs based on their average distance until the desired number of clusters is left. This number can be fixed or chosen automatically with the silhouette method, which checks how well each point fits in its cluster compared to others (higher scores mean cleaner separation). Once clustering finishes, the script takes the average price of each cluster to create key levels, sorts them, and draws horizontal lines with labels and colors showing their strength. A metrics table can also display details about the clusters to help you understand how the levels were calculated.
🟠 FEATURES
Agglomerative clustering engine with average linkage to merge pivots into level groups.
Dynamic lines showing each cluster’s price level for clarity.
Labels indicating level strength either as percent of all pivots or raw counts.
A metrics table displaying pivot count, cluster count, silhouette score, and cluster size data.
Optional silhouette-based auto-selection of cluster count to adaptively find the best fit.
🟠 USAGE
Add the indicator to any chart. Choose how far back to detect pivots using Pivot Length and set Pivot Memory to control how many are kept for clustering (more pivots give smoother levels but can slow performance). If you want the script to pick the number of levels automatically, enable Auto No. Levels ; otherwise, set Number of Levels . The colored horizontal lines represent the calculated key levels, and circles show where pivots occurred colored by which cluster they belong to. The labels beside each level indicate its strength, so you can see which levels are supported by more pivots. If Show Metrics Table is enabled, you will see statistics about the clustering in the corner you selected. Use this tool to spot areas where price often reacts and to plan entries or exits around levels that have been significant over time. Adjust settings to better match volatility and history depth of your instrument.

Momentum Trail Oscillator [AlgoAlpha]🟠 OVERVIEW
This script builds a Momentum Trail Oscillator designed to measure directional momentum strength and dynamically track shifts in trend bias using a combination of smoothed price change calculations and adaptive trailing bands. The oscillator aims to help traders visualize when momentum is expanding or contracting and to identify transitions between bullish and bearish conditions.
🟠 CONCEPTS
The core idea combines two methods. First, the script calculates a normalized momentum measure by smoothing price changes relative to their absolute values, which creates a bounded oscillator that highlights whether moves are directional or choppy. Second, it uses a trailing band mechanism inspired by volatility stops, where bands adapt to the oscillator’s volatility, adjusting the thresholds that define a shift in directional bias. This dual approach seeks to address both the magnitude and persistence of momentum, reducing false signals in ranging markets.
🟠 FEATURES
The momentum calculation applies Hull Moving Averages and double EMA smoothing to price changes, producing a smooth, responsive oscillator.
The trailing bands are derived by offsetting a weighted moving average of the oscillator by a multiple of recent momentum volatility. A directional state variable tracks whether the oscillator is above or below the bands, updating when the momentum crosses these dynamic thresholds.
Overbought and oversold zones are visually marked between fixed levels (+30/+40 and -30/-40), with color fills to highlight when momentum is in extreme areas. The script plots signals on both the oscillator pane and optionally overlays markers on the main price chart for clarity.
🟠 USAGE
To use the indicator, apply it to any symbol and timeframe. The “Oscillator Length” controls how sensitive the momentum line is to recent price changes—lower values react faster, higher values smooth out noise. The “Trail Multiplier” sets how far the adaptive bands sit from the oscillator mid-line, which affects how often trend state changes occur. When the momentum line rises into the upper filled area and then crosses back below +40, it signals potential overbought exhaustion. The opposite applies for the oversold zone below -40. The plotted trailing bands switch visibility depending on the current directional state: when momentum is trending up, the lower band acts as the active trailing stop, and when trending down, the upper band becomes active. Trend changes are marked with circular symbols when the direction variable flips, and optional overlay arrows appear on the price chart to highlight overbought or oversold reversals. Traders can combine these signals with their own price action or volume analysis to confirm entries or exits.

Stochastic SuperTrend [BigBeluga]🔵 OVERVIEW
A hybrid momentum-trend tool that combines Stochastic RSI with SuperTrend logic to deliver clean directional signals based on momentum turns.
Stochastic SuperTrend is a straightforward yet powerful oscillator overlay designed to highlight turning points in momentum with high clarity. It overlays a SuperTrend-style envelope onto the Stochastic RSI, generating intuitive up/down signals when a momentum shift occurs across the neutral 50 level. Built for traders who appreciate simplicity without sacrificing reliability.
🔵 CONCEPTS
Stochastic RSI: Measures momentum by applying stochastic calculations to the RSI curve instead of raw price.
SuperTrend Bands: Dynamic upper/lower bands are drawn around the smoothed Stoch RSI line using a user-defined multiplier.
Momentum Direction: Trend flips when the smoothed Stoch RSI crosses above/below the calculated bands.
Neutral Bias Filter: Directional arrows only appear when momentum turns above or below the central 50 level—adding confluence.
🔵 FEATURES
Trend Detection on Oscillator: Applies SuperTrend logic directly to the Stoch RSI curve.
Clean Entry Signals:
→ 🢁 arrow printed when trend flips bullish below 50 (bottom reversals).
→ 🢃 arrow printed when trend flips bearish above 50 (top reversals).
Custom Multiplier: Adjust sensitivity of SuperTrend band spacing around the oscillator.
Neutral Zone Highlight: Visual zone between 0–50 (green) and 50–100 (red) for quick momentum polarity reference.
Toggle SuperTrend Line: Option to show/hide the SuperTrend trail on the Stoch RSI.
🔵 HOW TO USE
Use 🢁 signals for potential bottom reversals when momentum flips bullish from oversold regions.
Use 🢃 signals for potential top reversals when momentum flips bearish from overbought areas.
Combine with price-based SuperTrend or support/resistance zones for confluence.
Suitable for scalping, swing trading, or momentum filtering across all timeframes.
🔵 CONCLUSION
Stochastic SuperTrend is a simple yet refined tool that captures clean momentum shifts with directional clarity. Whether you're identifying reversals, filtering entries, or spotting exhaustion in a trend, this oscillator overlay delivers just what you need— no clutter, just clean momentum structure.

Volatility-Adjusted Momentum Score (VAMS) [QuantAlgo]🟢 Overview
The Volatility-Adjusted Momentum Score (VAMS) measures price momentum relative to current volatility conditions, creating a normalized indicator that identifies significant directional moves while filtering out market noise. It divides annualized momentum by annualized volatility to produce scores that remain comparable across different market environments and asset classes.
The indicator displays a smoothed VAMS Z-Score line with adaptive standard deviation bands and an information table showing real-time metrics. This dual-purpose design enables traders and investors to identify strong trend continuation signals when momentum persistently exceeds normal levels, while also spotting potential mean reversion opportunities when readings reach statistical extremes.
🟢 How It Works
The indicator calculates annualized momentum using a simple moving average of logarithmic returns over a specified period, then measures annualized volatility through the standard deviation of those same returns over a longer timeframe. The raw VAMS score divides momentum by volatility, creating a risk-adjusted measure where high volatility reduces scores and low volatility amplifies them.
This raw VAMS value undergoes Z-Score normalization using rolling statistical parameters, converting absolute readings into standardized deviations that show how current conditions compare to recent history. The normalized Z-Score receives exponential moving average smoothing to create the final VAMS line, reducing false signals while preserving sensitivity to meaningful momentum changes.
The visualization includes dynamically calculated standard deviation bands that adjust to recent VAMS behavior, creating statistical reference zones. The information table provides real-time numerical values for VAMS Z-Score, underlying momentum percentages, and current volatility readings with trend indicators.
🟢 How to Use
1. VAMS Z-Score Bands and Signal Interpretation
Above Mean Line: Momentum exceeds historical averages adjusted for volatility, indicating bullish conditions suitable for trend following
Below Mean Line: Momentum falls below statistical norms, suggesting bearish conditions or downward pressure
Mean Line Crossovers: Primary transition signals between bullish and bearish momentum regimes
1 Standard Deviation Breaks: Strong momentum conditions indicating statistically significant directional moves worth following
2 Standard Deviation Extremes: Rare momentum readings that often signal either powerful breakouts or exhaustion points
2. Information Table and Market Context
Z-Score Values: Current VAMS reading displayed in standard deviations (σ), showing how far momentum deviates from its statistical norm
Momentum Percentage: Underlying annualized momentum displayed as percentage return, quantifying the directional strength
Volatility Context: Current annualized volatility levels help interpret whether VAMS readings occur in high or low volatility environments
Trend Indicators: Directional arrows and change values provide immediate feedback on momentum shifts and market transitions
3. Strategy Applications and Alert System
Trend Following: Use sustained readings beyond the mean line and 1σ band penetrations for directional trades, especially when VAMS maintains position in upper or lower statistical zones
Mean Reversion: Focus on 2σ extreme readings for contrarian opportunities, particularly effective in sideways markets where momentum tends to revert to statistical norms
Alert Notifications: Built-in alerts for mean crossovers (regime changes), 1σ breaks (strong signals), and 2σ touches (extreme conditions) help monitor multiple instruments for both continuation and reversal setups

Uptrick: Fusion Trend Reversion SystemOverview
The Uptrick: Fusion Trend Reversion System is a multi-layered indicator designed to identify potential price reversals during intraday movement while keeping traders informed of the dominant short-term trend. It blends a composite fair value model with deviation logic and a refined momentum filter using the Relative Strength Index (RSI). This tool was created with scalpers and short-term traders in mind and is especially effective on lower timeframes such as 1-minute, 5-minute, and 15-minute charts where price dislocations and quick momentum shifts are frequent.
Introduction
This indicator is built around the fusion of two classic concepts in technical trading: identifying trend direction and spotting potential reversion points. These are often handled separately, but this system merges them into one process. It starts by computing a fair value price using five moving averages, each with its own mathematical structure and strengths. These include the exponential moving average (EMA), which gives more weight to recent data; the simple moving average (SMA), which gives equal weight to all periods; the weighted moving average (WMA), which progressively increases weight with recency; the Arnaud Legoux moving average (ALMA), known for smoothing without lag; and the volume-weighted average price (VWAP), which factors in volume at each price level.
All five are averaged into a single value — the raw fusion line. This fusion acts as a dynamically balanced centerline that adapts to price conditions with both smoothing and responsiveness. Two additional exponential moving averages are applied to the raw fusion line. One is slower, giving a stable trend reference, and the other is faster, used to define momentum and cloud behavior. These two lines — the fusion slow and fusion fast — form the backbone of trend and signal logic.
Purpose
This system is meant for traders who want to trade reversals without losing sight of the underlying directional bias. Many reversal indicators fail because they act too early or signal too frequently in choppy markets. This script filters out noise through two conditions: price deviation and RSI confirmation. Reversion trades are considered only when the price moves a significant distance from fair value and RSI suggests a legitimate shift in momentum. That filtering process gives the trader a cleaner, higher-quality signal and reduces false entries.
The indicator also visually supports the trader through colored bars, up/down labels, and a filled cloud between the fast and slow fusion lines. These features make the market context immediately visible: whether the trend is up or down, whether a reversal just occurred, and whether price is currently in a high-risk reversion zone.
Originality and Uniqueness
What makes this script different from most reversal systems is the way it combines layers of logic — not just to detect signals, but to qualify and structure them. Rather than relying on a single MA or a raw RSI level, it uses a five-MA fusion to create a baseline fair value that incorporates speed, stability, and volume-awareness.
On top of that, the system introduces a dual-smoothing mechanism. It doesn’t just smooth price once — it creates two layers: one to follow the general trend and another to track faster deviations. This structure lets the script distinguish between continuation moves and possible turning points more effectively than a single-line or single-metric system.
It also uses RSI in a more refined way. Instead of just checking if RSI is overbought or oversold, the script smooths RSI and requires directional confirmation. Beyond that, it includes signal memory. Once a signal is generated, a new one will not appear unless the RSI becomes even more extreme and curls back again. This memory-based gating reduces signal clutter and prevents repetition, a rare feature in similar scripts.
Why these indicators were merged
Each moving average in the fusion serves a specific role. EMA reacts quickly to recent price changes and is often favored in fast-trading strategies. SMA acts as a long-term filter and smooths erratic behavior. WMA blends responsiveness with smoothing in a more balanced way. ALMA focuses on minimizing lag without losing detail, which is helpful in fast markets. VWAP anchors price to real trade volume, giving a sense of where actual positioning is happening.
By combining all five, the script creates a fair value model that doesn’t lean too heavily on one logic type. This fusion is then smoothed into two separate EMAs: one slower (trend layer), one faster (signal layer). The difference between these forms the basis of the trend cloud, which can be toggled on or off visually.
RSI is then used to confirm whether price is reversing with enough force to warrant a trade. The RSI is calculated over a 14-period window and smoothed with a 7-period EMA. The reason for smoothing RSI is to cut down on noise and avoid reacting to short, insignificant spikes. A signal is only considered if price is stretched away from the trend line and the smoothed RSI is in a reversal state — below 30 and rising for bullish setups, above 70 and falling for bearish ones.
Calculations
The script follows this structure:
Calculate EMA, SMA, WMA, ALMA, and VWAP using the same base length
Average the five values to form the raw fusion line
Smooth the raw fusion line with an EMA using sens1 to create the fusion slow line
Smooth the raw fusion line with another EMA using sens2 to create the fusion fast line
If fusion slow is rising and price is above it, trend is bullish
If fusion slow is falling and price is below it, trend is bearish
Calculate RSI over 14 periods
Smooth RSI using a 7-period EMA
Determine deviation as the absolute difference between current price and fusion slow
A raw signal is flagged if deviation exceeds the threshold
A raw signal is flagged if RSI EMA is under 30 and rising (bullish setup)
A raw signal is flagged if RSI EMA is over 70 and falling (bearish setup)
A final signal is confirmed for a bullish setup if RSI EMA is lower than the last bullish signal’s RSI
A final signal is confirmed for a bearish setup if RSI EMA is higher than the last bearish signal’s RSI
Reset the bullish RSI memory if RSI EMA rises above 30
Reset the bearish RSI memory if RSI EMA falls below 70
Store last signal direction and use it for optional bar coloring
Draw the trend cloud between fusion fast and fusion slow using fill()
Show signal labels only if showSignals is enabled
Bar and candle colors reflect either trend slope or last signal direction depending on mode selected
How it works
Once the script is loaded, it builds a fusion line by averaging five different types of moving averages. That line is smoothed twice into a fast and slow version. These two fusion lines form the structure for identifying trend direction and signal areas.
Trend bias is defined by the slope of the slow line. If the slow line is rising and price is above it, the market is considered bullish. If the slow line is falling and price is below it, it’s considered bearish.
Meanwhile, the script monitors how far price has moved from that slow line. If price is stretched beyond a certain distance (set by the threshold), and RSI confirms that momentum is reversing, a raw reversion signal is created. But the script only allows that signal to show if RSI has moved further into oversold or overbought territory than it did at the last signal. This blocks repetitive, weak entries. The memory is cleared only if RSI exits the zone — above 30 for bullish, below 70 for bearish.
Once a signal is accepted, a label is drawn. If the signal toggle is off, no label will be shown regardless of conditions. Bar colors are controlled separately — you can color them based on trend slope or last signal, depending on your selected mode.
Inputs
You can adjust the following settings:
MA Length: Sets the period for all moving averages used in the fusion.
Show Reversion Signals: Turns on the plotting of “Up” and “Down” labels when a reversal is confirmed.
Bar Coloring: Enables or disables colored bars based on trend or signal direction.
Show Trend Cloud: Fills the space between the fusion fast and slow lines to reflect trend bias.
Bar Color Mode: Lets you choose whether bars follow trend logic or last signal direction.
Sens 1: Smoothing speed for the slow fusion line — higher values = slower trend.
Sens 2: Smoothing speed for the fast line — lower values = faster signal response.
Deviation Threshold: Minimum distance price must move from fair value to trigger a signal check.
Features
This indicator offers:
A composite fair value model using five moving average types.
Dual smoothing system with user-defined sensitivity.
Slope-based trend definition tied to price position.
Deviation-triggered signal logic filtered by RSI reversal.
RSI memory system that blocks repetitive signals and resets only when RSI exits overbought or oversold zones.
Real-time tracking of the last signal’s direction for optional bar coloring.
Up/Down labels at signal points, visible only when enabled.
Optional trend cloud between fusion layers, visualizing current market bias.
Full user control over smoothing, threshold, color modes, and visibility.
Conclusion
The Fusion Trend-Reversion System is a tool for short-term traders looking to fade price extremes without ignoring trend bias. It calculates fair value using five diverse moving averages, smooths this into two dynamic layers, and applies strict reversal logic based on RSI deviation and momentum strength. Signals are triggered only when price is stretched and momentum confirms it with increasingly strong behavior. This combination makes the tool suitable for scalping, intraday entries, and fast market environments where precision matters.
Disclaimer
This indicator is for informational and educational purposes only. It does not constitute financial advice. All trading involves risk, and no tool can predict market behavior with certainty. Use proper risk management and do your own research before making trading decisions.

Wavelet-Trend ML Integration [Alpha Extract]Alpha-Extract Volatility Quality Indicator
The Alpha-Extract Volatility Quality (AVQ) Indicator provides traders with deep insights into market volatility by measuring the directional strength of price movements. This sophisticated momentum-based tool helps identify overbought and oversold conditions, offering actionable buy and sell signals based on volatility trends and standard deviation bands.
🔶 CALCULATION
The indicator processes volatility quality data through a series of analytical steps:
Bar Range Calculation: Measures true range (TR) to capture price volatility.
Directional Weighting: Applies directional bias (positive for bullish candles, negative for bearish) to the true range.
VQI Computation: Uses an exponential moving average (EMA) of weighted volatility to derive the Volatility Quality Index (VQI).
Smoothing: Applies an additional EMA to smooth the VQI for clearer signals.
Normalization: Optionally normalizes VQI to a -100/+100 scale based on historical highs and lows.
Standard Deviation Bands: Calculates three upper and lower bands using standard deviation multipliers for volatility thresholds.
Signal Generation: Produces overbought/oversold signals when VQI reaches extreme levels (±200 in normalized mode).
Formula:
Bar Range = True Range (TR)
Weighted Volatility = Bar Range × (Close > Open ? 1 : Close < Open ? -1 : 0)
VQI Raw = EMA(Weighted Volatility, VQI Length)
VQI Smoothed = EMA(VQI Raw, Smoothing Length)
VQI Normalized = ((VQI Smoothed - Lowest VQI) / (Highest VQI - Lowest VQI) - 0.5) × 200
Upper Band N = VQI Smoothed + (StdDev(VQI Smoothed, VQI Length) × Multiplier N)
Lower Band N = VQI Smoothed - (StdDev(VQI Smoothed, VQI Length) × Multiplier N)
🔶 DETAILS
Visual Features:
VQI Plot: Displays VQI as a line or histogram (lime for positive, red for negative).
Standard Deviation Bands: Plots three upper and lower bands (teal for upper, grayscale for lower) to indicate volatility thresholds.
Reference Levels: Horizontal lines at 0 (neutral), +100, and -100 (in normalized mode) for context.
Zone Highlighting: Overbought (⋎ above bars) and oversold (⋏ below bars) signals for extreme VQI levels (±200 in normalized mode).
Candle Coloring: Optional candle overlay colored by VQI direction (lime for positive, red for negative).
Interpretation:
VQI ≥ 200 (Normalized): Overbought condition, strong sell signal.
VQI 100–200: High volatility, potential selling opportunity.
VQI 0–100: Neutral bullish momentum.
VQI 0 to -100: Neutral bearish momentum.
VQI -100 to -200: High volatility, strong bearish momentum.
VQI ≤ -200 (Normalized): Oversold condition, strong buy signal.
🔶 EXAMPLES
Overbought Signal Detection: When VQI exceeds 200 (normalized), the indicator flags potential market tops with a red ⋎ symbol.
Example: During strong uptrends, VQI reaching 200 has historically preceded corrections, allowing traders to secure profits.
Oversold Signal Detection: When VQI falls below -200 (normalized), a lime ⋏ symbol highlights potential buying opportunities.
Example: In bearish markets, VQI dropping below -200 has marked reversal points for profitable long entries.
Volatility Trend Tracking: The VQI plot and bands help traders visualize shifts in market momentum.
Example: A rising VQI crossing above zero with widening bands indicates strengthening bullish momentum, guiding traders to hold or enter long positions.
Dynamic Support/Resistance: Standard deviation bands act as dynamic volatility thresholds during price movements.
Example: Price reversals often occur near the third standard deviation bands, providing reliable entry/exit points during volatile periods.
🔶 SETTINGS
Customization Options:
VQI Length: Adjust the EMA period for VQI calculation (default: 14, range: 1–50).
Smoothing Length: Set the EMA period for smoothing (default: 5, range: 1–50).
Standard Deviation Multipliers: Customize multipliers for bands (defaults: 1.0, 2.0, 3.0).
Normalization: Toggle normalization to -100/+100 scale and adjust lookback period (default: 200, min: 50).
Display Style: Switch between line or histogram plot for VQI.
Candle Overlay: Enable/disable VQI-colored candles (lime for positive, red for negative).
The Alpha-Extract Volatility Quality Indicator empowers traders with a robust tool to navigate market volatility. By combining directional price range analysis with smoothed volatility metrics, it identifies overbought and oversold conditions, offering clear buy and sell signals. The customizable standard deviation bands and optional normalization provide precise context for market conditions, enabling traders to make informed decisions across various market cycles.

Rolling Z-Score Trend [QuantAlgo]🟢 Overview
The Rolling Z-Score Trend measures how far the current price deviates from its rolling mean in terms of standard deviations. It transforms price data into standardized scores to identify overbought and oversold conditions while tracking momentum shifts.
The indicator displays a Z-Score line showing price deviation from statistical norms, with background momentum columns showing the rate of change in these deviations. This helps traders and investors identify mean reversion opportunities and momentum shifts across different asset classes and timeframes.
🟢 How It Works
The indicator uses the Z-Score formula: Z = (X - μ) / σ, where X is the current closing price, μ is the rolling mean, and σ is the rolling standard deviation over a user-defined lookback period. This creates a dynamic baseline that adapts to changing market conditions and standardizes price movements for interpretation across different assets and volatility conditions. The raw Z-Score undergoes 3-period EMA smoothing to reduce noise while maintaining responsiveness to market signals.
Beyond the basic Z-Score calculation, the indicator measures the rate of change in Z-Score values between successive bars, displayed as background momentum columns. This momentum component shows acceleration and deceleration of statistical deviations. All calculations are processed through confirmation filters, displaying signals only on confirmed bars to reduce premature signals based on incomplete price action.
🟢 How to Use
1. Z-Score Interpretation and Threshold Zones
Positive Values (Above Zero) : Price trading above statistical mean, suggesting bullish momentum or potential overbought conditions
Negative Values (Below Zero) : Price trading below statistical mean, suggesting bearish momentum or potential oversold conditions
Zero Line Crosses : Signal transitions between statistical regimes and potential trend changes
Upper Threshold Zone : Area above entry threshold (default 1.5) indicating potential overbought conditions
Lower Threshold Zone : Area below negative entry threshold (default -1.5) indicating potential oversold conditions
Extreme Values (±2.0 or higher) : Statistically significant deviations that may indicate reversal opportunities
2. Momentum Background Analysis and Info Table
Green Columns : Accelerating positive momentum in Z-Score values
Red Columns : Accelerating negative momentum in Z-Score values
Column Height : Magnitude of momentum change between bars
Momentum Divergence : When columns contradict primary Z-Score direction, often signals impending reversals
Info Table : Displays real-time numerical values for both Z-Score and momentum, including trend direction indicators and bar-to-bar change calculations for position management
3. Preconfigured Settings
Default : Balanced performance across multiple timeframes and asset classes for general trading and medium-term position management.
Scalping : Responsive setup for ultra-short-term trading on 1-15 minute charts with frequent signals and increased sensitivity to quick price movements.
Swing Trading : Optimized for multi-day positions with noise filtering, focusing on larger price swings. Most effective on 1-4 hour and daily timeframes.
Trend Following : Maximum smoothing that prioritizes established trends over short-term volatility. Generates fewer signals for daily and weekly charts.

Trend Flow Trail [AlgoAlpha]OVERVIEW
This script overlays a custom hybrid indicator called the Money Flow Trail which combines a volatility-based trend-following trail with a volume-weighted momentum oscillator. It’s built around two core components: the AlphaTrail—a dynamic band system influenced by Hull MA and volatility—and a smoothed Money Flow Index (MFI) that provides insights into buying or selling pressure. Together, these tools are used to color bars, generate potential reversal markers, and assist traders in identifying trend continuation or exhaustion phases in any market or timeframe.
CONCEPTS
The AlphaTrail calculates a volatility-adjusted channel around price using the Hull Moving Average as the base and an EMA of range as the spread. It adaptively shifts based on price interaction to capture trend reversals while avoiding whipsaws. The direction (bullish or bearish) determines both the band being tracked and how the trail locks in. The Money Flow Index (MFI) is derived from hlc3 and volume, measuring buying vs selling pressure, and is further smoothed with a short Hull MA to reduce noise while preserving structure. These two systems work in tandem: AlphaTrail governs directional context, while MFI refines the timing.
FEATURES
Dynamic AlphaTrail line with regime switching logic that controls directional bias and bar coloring.
Smoothed MFI with gradient coloring to visually communicate pressure and exhaustion levels.
Overbought/oversold thresholds (80/20), mid-level (50), and custom extreme zones (90/10) for deeper signal granularity.
Built-in take-profit signal logic: crossover of MFI into overbought with bullish AlphaTrail, or into oversold with bearish AlphaTrail.
Visual fills between price and AlphaTrail for clearer confirmation during trend phases.
Alerts for regime shifts, MFI crossovers, trail interactions, and bar color regime changes.
USAGE
Add the indicator to any chart. Use the AlphaTrail plot to define trend context: bullish (trailing below price) or bearish (trailing above). MFI values give supporting confirmation—favor long setups when MFI is rising and above 50 in a bullish regime, and shorts when MFI is falling and below 50 in a bearish regime. The colored fills help visually track strength; sharp changes in MFI crossing 80/20 or 90/10 zones often precede pullbacks or reversals. Use the plotted circles as optional take-profit signals when MFI and trend are extended. Adjust AlphaTrail length/multiplier and MFI smoothing to better match the asset’s volatility profile.

PRO Investing - LevelPRO Investing - Level
📊 Dynamic Support/Resistance
This indicator plots the PRO Investing Level, defined as the midpoint between the highest high and lowest low over the past 252 trading days (default lookback period, equivalent to ~1 year). It acts as a key mean-reversion reference level, useful for identifying potential support/resistance zones or market equilibrium levels.
Features:
🕰️ Option to display only today’s level or historical levels.
⚙️ Customizable lookback period for flexibility across timeframes and strategies.
📉 Teal line plotted directly on the chart, highlighting this institutional-grade level.
Ideal for traders looking to anchor price action to significant historical ranges—particularly useful in mean-reversion, breakout, or volatility compression strategies.

[Smith] VWAP Deviation + VWAP Deviation +
Short Description:
Advanced VWAP indicator with deviation bands, smart signal filtering, and session-based performance tracking. Features log-space scaling, RSI confirmation, volume filters, and market regime detection.
Full Description:
The VWAP Deviation + is a comprehensive trading indicator that combines Volume Weighted Average Price (VWAP) analysis with advanced signal filtering to identify high-probability trade opportunities. This indicator goes beyond basic VWAP by incorporating multiple confirmation layers and intelligent market analysis.
🎯 Key Features
Core VWAP Analysis:
- Custom volume-weighted mean calculation with deviation bands (2σ and 3σ)
- Optional log-space scaling for proportional price movements
- Real-time VWAP line with customizable visibility
Smart Signal Detection:
- RSI confirmation for all trade signals
- Volume filter requiring above-average trading activity
- Market regime detection (trending vs ranging markets)
- Optional RSI divergence analysis
Advanced Filtering:
- Multi-condition signal validation
- Session-based performance tracking (Asian, London, NY)
- Real-time win rate calculation
- Strong vs regular signal classification
Visual Features:
- Clean, professional interface with customizable colors
- Optional signal shapes and annotations
- Performance statistics table
- Filled deviation bands for easy visualization
📊 How It Works
The indicator identifies trade opportunities when:
1. Price touches VWAP deviation bands (2σ or 3σ)
2. RSI confirms oversold/overbought conditions
3. Volume exceeds the specified threshold
4. Market regime conditions are favorable
Signal Types:
- LONG : Price at lower bands + RSI oversold + volume confirmation
- SHORT : Price at upper bands + RSI overbought + volume confirmation
- STRONG : Same conditions but at 3σ bands for higher conviction trades
⚙️ Customization Options
Core Settings:
- VWAP length and source selection
- Adjustable deviation multipliers
- Log-space scaling toggle
Signal Filters:
- RSI length and threshold levels
- Volume filter with customizable multiplier
- Market type filtering options
Advanced Features:
- Session statistics tracking
- RSI divergence detection
- Market regime analysis
Visual Controls:
- Show/hide individual components
- Custom color schemes
- Signal display toggles
🔔 Alert System
Built-in alerts for:
- Long and short trade opportunities
- Strong signal confirmations
- RSI divergence signals
💡 Best Practices
- Use higher timeframes (15m+) for more reliable signals
- Combine with additional confirmation indicators
- Pay attention to session statistics for timing optimization
- Monitor market regime indicators for context
This indicator is suitable for day traders, swing traders, and anyone looking to improve their VWAP-based trading strategies with advanced filtering and market analysis.

Fibonacci Entry Bands [AlgoAlpha]OVERVIEW
This script plots Fibonacci Entry Bands, a trend-following and mean-reversion hybrid system built around dynamic volatility-adjusted bands scaled using key Fibonacci levels. It calculates a smoothed basis line and overlays multiple bands at fixed Fibonacci multipliers of either ATR or standard deviation. Depending on the trend direction, specific upper or lower bands become active, offering a clear framework for entry timing, trend identification, and profit-taking zones.
CONCEPTS
The core idea is to use Fibonacci levels—0.618, 1.0, 1.618, and 2.618—as multipliers on a volatility measure to form layered price bands around a trend-following moving average. Trends are defined by whether the basis is rising or falling. The trend determines which side of the bands is emphasized: upper bands for downtrends, lower bands for uptrends. This approach captures both directional bias and extreme price extensions. Take-profit logic is built in via crossovers relative to the outermost bands, scaled by user-selected aggressiveness.
FEATURES
Basis Line – A double EMA smoothing of the source defines trend direction and acts as the central mean.
Volatility Bands – Four levels per side (based on selected ATR or stdev) mark the Fibonacci bands. These become visible only when trend direction matches the side (e.g., only lower bands plot in an uptrend).
Bar Coloring – Bars are shaded with adjustable transparency depending on distance from the basis, with color intensity helping gauge overextension.
Entry Arrows – A trend shift triggers either a long or short signal, with a marker at the outermost band with ▲/▼ signs.
Take-Profit Crosses – If price rejects near the outer band (based on aggressiveness setting), a cross appears marking potential profit-taking.
Bounce Signals – Minor pullbacks that respect the basis line are marked with triangle arrows, hinting at continuation setups.
Customization – Users can toggle bar coloring, signal markers, and select between ATR/stdev as well as take-profit aggressiveness.
Alerts – All major signals, including entries, take-profits, and bounces, are available as alert conditions.
USAGE
To use this tool, load it on your chart, adjust the inputs for volatility method and aggressiveness, and wait for entries to form on trend changes. Use TP crosses and bounce arrows as potential exit or scale-in signals.

Adaptive MACD Deluxe [AlgoAlpha]OVERVIEW
This script is an advanced rework of the classic MACD indicator, designed to be more adaptive, visually informative, and customizable. It enhances the original MACD formula using a dynamic feedback loop and a correlation-based weighting system that adjusts in real-time based on how deterministic recent price action is. The signal line is flexible, offering several smoothing types including Heiken Ashi, while the histogram is color-coded with gradients to help users visually identify momentum shifts. It also includes optional normalization by volatility, allowing MACD values to be interpreted as relative percentage moves, making the indicator more consistent across different assets and timeframes.
CONCEPTS
This version of MACD introduces a deterministic weight based on R-squared correlation with time, which modulates how fast or slow the MACD adapts to price changes. Higher correlation means smoother, slower MACD responses, and low correlation leads to quicker reaction. The momentum calculation blends traditional EMA math with feedback and damping components to create a smoother, less noisy series. Heiken Ashi is optionally used for signal smoothing to better visualize short-term trend bias. When normalization is enabled, the MACD is scaled by an EMA of the high-low range, converting it into a bounded, volatility-relative indicator. This makes extreme readings more meaningful across markets.
FEATURES
The script offers six distinct options for signal line smoothing: EMA, SMA, SMMA (RMA), WMA, VWMA, and a custom Heiken Ashi mode based on the MACD series. Each option provides a different response speed and smoothing behavior, allowing traders to match the indicator’s behavior to their strategy—whether it's faster reaction or reduced noise.
Normalization is another key feature. When enabled, MACD values are scaled by a volatility proxy, converting the indicator into a relative percentage. This helps standardize the MACD across different assets and timeframes, making overbought and oversold readings more consistent and easier to interpret.
Threshold zones can be customized using upper and lower boundaries, with inner zones for early warnings. These zones are highlighted on the chart with subtle background fills and directional arrows when MACD enters or exits key levels. This makes it easier to spot strong or weak reversals at a glance.
Lastly, the script includes multiple built-in alerts. Users can set alerts for MACD crossovers, histogram flips above or below zero, and MACD entries into strong or weak reversal zones. This allows for hands-free monitoring and quick decision-making without staring at the chart.
USAGE
To use this script, choose your preferred signal smoothing type, enable normalization if you want MACD values relative to volatility, and adjust the threshold zones to fit your asset or timeframe. Use the colored histogram to detect changes in momentum strength—brighter colors indicate rising strength, while faded colors imply weakening. Heiken Ashi mode smooths out noise and provides clearer signals, especially useful in choppy conditions. Use alert conditions for crossover and reversal detection, or monitor the arrow markers for entries into potential exhaustion zones. This setup works well for trend following, momentum trading, and reversal spotting across all market types.

Heikin-Ashi Mean Reversion Oscillator [Alpha Extract]The Heikin-Ashi Mean Reversion Oscillator combines the smoothing characteristics of Heikin-Ashi candlesticks with mean reversion analysis to create a powerful momentum oscillator. This indicator applies Heikin-Ashi transformation twice - first to price data and then to the oscillator itself - resulting in smoother signals while maintaining sensitivity to trend changes and potential reversal points.
🔶 CALCULATION
Heikin-Ashi Transformation: Converts regular OHLC data to smoothed Heikin-Ashi values
Component Analysis: Calculates trend strength, body deviation, and price deviation from mean
Oscillator Construction: Combines components with weighted formula (40% trend strength, 30% body deviation, 30% price deviation)
Double Smoothing: Applies EMA smoothing and second Heikin-Ashi transformation to oscillator values
Signal Generation: Identifies trend changes and crossover points with overbought/oversold levels
Formula:
HA Close = (Open + High + Low + Close) / 4
HA Open = (Previous HA Open + Previous HA Close) / 2
Trend Strength = Normalized consecutive HA candle direction
Body Deviation = (HA Body - Mean Body) / Mean Body * 100
Price Deviation = ((HA Close - Price Mean) / Price Mean * 100) / Standard Deviation * 25
Raw Oscillator = (Trend Strength * 0.4) + (Body Deviation * 0.3) + (Price Deviation * 0.3)
Final Oscillator = 50 + (EMA(Raw Oscillator) / 2)
🔶 DETAILS Visual Features:
Heikin-Ashi Candlesticks: Smoothed oscillator representation using HA transformation with vibrant teal/red coloring
Overbought/Oversold Zones: Horizontal lines at customizable levels (default 70/30) with background highlighting in extreme zones
Moving Averages: Optional fast and slow EMA overlays for additional trend confirmation
Signal Dashboard: Real-time table showing current oscillator status (Overbought/Oversold/Bullish/Bearish) and buy/sell signals
Reference Lines: Middle line at 50 (neutral), with 0 and 100 boundaries for range visualization
Interpretation:
Above 70: Overbought conditions, potential selling opportunity
Below 30: Oversold conditions, potential buying opportunity
Bullish HA Candles: Green/teal candles indicate upward momentum
Bearish HA Candles: Red candles indicate downward momentum
MA Crossovers: Fast EMA above slow EMA suggests bullish momentum, below suggests bearish momentum
Zone Exits: Price moving out of extreme zones (above 70 or below 30) often signals trend continuation
🔶 EXAMPLES
Mean Reversion Signals: When the oscillator reaches extreme levels (above 70 or below 30), it identifies potential reversal points where price may revert to the mean.
Example: Oscillator reaching 80+ levels during strong uptrends often precedes short-term pullbacks, providing profit-taking opportunities.
Trend Change Detection: The double Heikin-Ashi smoothing helps identify genuine trend changes while filtering out market noise.
Example: When oscillator HA candles change from red to teal after oversold readings, this confirms potential trend reversal from bearish to bullish.
Moving Average Confirmation: Fast and slow EMA crossovers on the oscillator provide additional confirmation of momentum shifts.
Example: Fast EMA crossing above slow EMA while oscillator is rising from oversold levels provides strong bullish confirmation signal.
Dashboard Signal Integration: The real-time dashboard combines oscillator status with directional signals for quick decision-making.
Example: Dashboard showing "Oversold" status with "BUY" signal when HA candles turn bullish provides clear entry timing.
🔶 SETTINGS
Customization Options:
Calculation: Oscillator period (default 14), smoothing factor (1-50, default 2)
Levels: Overbought threshold (50-100, default 70), oversold threshold (0-50, default 30)
Moving Averages: Toggle display, fast EMA length (default 9), slow EMA length (default 21)
Visual Enhancements: Show/hide signal dashboard, customizable table position
Alert Conditions: Oversold bounce, overbought reversal, bullish/bearish MA crossovers
The Heikin-Ashi Mean Reversion Oscillator provides traders with a sophisticated momentum tool that combines the smoothing benefits of Heikin-Ashi analysis with mean reversion principles. The double transformation process creates cleaner signals while the integrated dashboard and multiple confirmation methods help traders identify high-probability entry and exit points during both trending and ranging market conditions.

Uptrick: Z-Trend BandsOverview
Uptrick: Z-Trend Bands is a Pine Script overlay crafted to capture high-probability mean-reversion opportunities. It dynamically plots upper and lower statistical bands around an EMA baseline by converting price deviations into z-scores. Once price moves outside these bands and then reenters, the indicator verifies that momentum is genuinely reversing via an EMA-smoothed RSI slope. Signal memory ensures only one entry per momentum swing, and traders receive clear, real-time feedback through customizable bar-coloring modes, a semi-transparent fill highlighting the statistical zone, concise “Up”/“Down” labels, and a live five-metric scoring table.
Introduction
Markets often oscillate between trending and reverting, and simple thresholds or static envelopes frequently misfire when volatility shifts. Standard deviation quantifies how “wide” recent price moves have been, and a z-score transforms each deviation into a measure of how rare it is relative to its own history. By anchoring these bands to an exponential moving average, the script maintains a fluid statistical envelope that adapts instantly to both calm and turbulent regimes. Meanwhile, the Relative Strength Index (RSI) tracks momentum; smoothing RSI with an EMA and observing its slope filters out erratic spikes, ensuring that only genuine momentum flips—upward for longs and downward for shorts—qualify.
Purpose
This indicator is purpose-built for short-term mean-reversion traders operating on lower–timeframe charts. It reveals when price has strayed into the outer 5 percent of its recent range, signaling an increased likelihood of a bounce back toward fair value. Rather than firing on price alone, it demands that momentum follow suit: the smoothed RSI slope must flip in the opposite direction before any trade marker appears. This dual-filter approach dramatically reduces noise-driven, false setups. Traders then see immediate visual confirmation—bar colors that reflect the latest signal and age over time, clear entry labels, and an always-visible table of metric scores—so they can gauge both the validity and freshness of each signal at a glance.
Originality and Uniqueness
Uptrick: Z-Trend Bands stands apart from typical envelope or oscillator tools in four key ways. First, it employs fully normalized z-score bands, meaning ±2 always captures roughly the top and bottom 5 percent of moves, regardless of volatility regime. Second, it insists on two simultaneous conditions—price reentry into the bands and a confirming RSI slope flip—dramatically reducing whipsaw signals. Third, it uses slope-phase memory to lock out duplicate signals until momentum truly reverses again, enforcing disciplined entries. Finally, it offers four distinct bar-coloring schemes (solid reversal, fading reversal, exceeding bands, and classic heatmap) plus a dynamic scoring table, rather than a single, opaque alert, giving traders deep insight into every layer of analysis.
Why Each Component Was Picked
The EMA baseline was chosen for its blend of responsiveness—weighting recent price heavily—and smoothness, which filters market noise. Z-score deviation bands standardize price extremes relative to their own history, adapting automatically to shifting volatility so that “extreme” always means statistically rare. The RSI, smoothed with an EMA before slope calculation, captures true momentum shifts without the false spikes that raw RSI often produces. Slope-phase memory flags prevent repeated alerts within a single swing, curbing over-trading in choppy conditions. Bar-coloring modes provide flexible visual contexts—whether you prefer to track the latest reversal, see signal age, highlight every breakout, or view a continuous gradient—and the scoring table breaks down all five core checks for complete transparency.
Features
This indicator offers a suite of configurable visual and logical tools designed to make reversal signals both robust and transparent:
Dynamic z-score bands that expand or contract in real time to reflect current volatility regimes, ensuring the outer ±zThreshold levels always represent statistically rare extremes.
A smooth EMA baseline that weights recent price more heavily, serving as a fair-value anchor around which deviations are measured.
EMA-smoothed RSI slope confirmation, which filters out erratic momentum spikes by first smoothing raw RSI and then requiring its bar-to-bar slope to flip before any signal is allowed.
Slope-phase memory logic that locks out duplicate buy or sell markers until the RSI slope crosses back through zero, preventing over-trading during choppy swings.
Four distinct bar-coloring modes—Reversal Solid, Reversal Fade, Exceeding Bands, Classic Heat—plus a “None” option, so traders can choose whether to highlight the latest signal, show signal age, emphasize breakout bars, or view a continuous heat gradient within the bands.
A semi-transparent fill between the EMA and the upper/lower bands that visually frames the statistical zone and makes extremes immediately obvious.
Concise “Up” and “Down” labels that plot exactly when price re-enters a band with confirming momentum, keeping chart clutter to a minimum.
A real-time, five-metric scoring table (z-score, RSI slope, price vs. EMA, trend state, re-entry) that updates every two bars, displaying individual +1/–1/0 scores and an averaged Buy/Sell/Neutral verdict for complete transparency.
Calculations
Compute the fair-value EMA over fairLen bars.
Subtract that EMA from current price each bar to derive the raw deviation.
Over zLen bars, calculate the rolling mean and standard deviation of those deviations.
Convert each deviation into a z-score by subtracting the mean and dividing by the standard deviation.
Plot the upper and lower bands at ±zThreshold × standard deviation around the EMA.
Calculate raw RSI over rsiLen bars, then smooth it with an EMA of length rsiEmaLen.
Derive the RSI slope by taking the difference between the current and previous smoothed RSI.
Detect a potential reentry when price exits one of the bands on the prior bar and re-enters on the current bar.
Require that reentry coincide with an RSI slope flip (positive for a lower-band reentry, negative for an upper-band reentry).
On first valid reentry per momentum swing, fire a buy or sell signal and set a memory flag; reset that flag only when the RSI slope crosses back through zero.
For each bar, assign scores of +1, –1, or 0 for the z-score direction, RSI slope, price vs. EMA, trend-state, and reentry status.
Average those five scores; if the result exceeds +0.1, label “Buy,” if below –0.1, label “Sell,” otherwise “Neutral.”
Update bar colors, the semi-transparent fill, reversal labels, and the scoring table every two bars to reflect the latest calculations.
How It Actually Works
On each new candle, the EMA baseline and band widths update to reflect current volatility. The RSI is smoothed and its slope recalculated. The script then looks back one bar to see if price exited either band and forward to see if it reentered. If that reentry coincides with an appropriate RSI slope flip—and no signal has yet been generated in that swing—a concise label appears. Bar colors refresh according to your selected mode, and the scoring table updates to show which of the five conditions passed or failed, along with the overall verdict. This process repeats seamlessly at each bar, giving traders a continuous feed of disciplined, statistically filtered reversal cues.
Inputs
All parameters are fully user-configurable, allowing you to tailor sensitivity, lookbacks, and visuals to your trading style:
EMA length (fairLen): number of bars for the fair-value EMA; higher values smooth more but lag further behind price.
Z-Score lookback (zLen): window for calculating the mean and standard deviation of price deviations; longer lookbacks reduce noise but respond more slowly to new volatility.
Z-Score threshold (zThreshold): number of standard deviations defining the upper and lower bands; common default is 2.0 for roughly the outer 5 percent of moves.
Source (src): choice of price series (close, hl2, etc.) used for EMA, deviation, and RSI calculations.
RSI length (rsiLen): period for raw RSI calculation; shorter values react faster to momentum changes but can be choppier.
RSI EMA length (rsiEmaLen): period for smoothing raw RSI before taking its slope; higher values filter more noise.
Bar coloring mode (colorMode): select from None, Reversal Solid, Reversal Fade, Exceeding Bands, or Classic Heat to control how bars are shaded in relation to signals and band positions.
Show signals (showSignals): toggle on-chart “Up” and “Down” labels for reversal entries.
Show scoring table (enableTable): toggle the display of the five-metric breakdown table.
Table position (tablePos): choose which corner (Top Left, Top Right, Bottom Left, Bottom Right) hosts the scoring table.
Conclusion
By merging a normalized z-score framework, momentum slope confirmation, disciplined signal memory, flexible visuals, and transparent scoring into one Pine Script overlay, Uptrick: Z-Trend Bands offers a powerful yet intuitive tool for intraday mean-reversion trading. Its adaptability to real-time volatility and multi-layered filter logic deliver clear, high-confidence reversal cues without the clutter or confusion of simpler indicators.
Disclaimer
This indicator is provided solely for educational and informational purposes. It does not constitute financial advice. Trading involves substantial risk and may not be suitable for all investors. Past performance is not indicative of future results. Always conduct your own testing and apply careful risk management before trading live.

Arnaud Legoux Trend Aggregator | Lyro RSArnaud Legoux Trend Aggregator
Introduction
Arnaud Legoux Trend Aggregator is a custom-built trend analysis tool that blends classic market oscillators with advanced normalization, advanced math functions and Arnaud Legoux smoothing. Unlike conventional indicators, 𝓐𝓛𝓣𝓐 aggregates market momentum, volatility and trend strength.
Signal Insight
The 𝓐𝓛𝓣𝓐 line visually reflects the aggregated directional bias. A rise above the middle line threshold signals bullish strength, while a drop below the middle line indicates bearish momentum.
Another way to interpret the 𝓐𝓛𝓣𝓐 is through overbought and oversold conditions. When the 𝓐𝓛𝓣𝓐 rises above the +0.7 threshold, it suggests an overbought market and signals a strong uptrend. Conversely, a drop below the -0.7 level indicates an oversold condition and a strong downtrend.
When the oscillator hovers near the zero line, especially within the neutral ±0.3 band, it suggests that no single directional force is dominating—common during consolidation phases or pre-breakout compression.
Real-World Example
Usually 𝓐𝓛𝓣𝓐 is used by following the bar color for simple signals; however, like most indicators there are unique ways to use an indicator. Let’s dive deep into such ways.
The market begins with a green bar color, raising awareness for a potential long setup—but not a direct entry. In this methodology, bar coloring serves as an alert mechanism rather than a strict entry trigger.
The first long position was initiated when the 𝓐𝓛𝓣𝓐 signal line crossed above the +0.3 threshold, suggesting a shift in directional acceleration. This entry coincided with a rising price movement, validating the trade.
As price advanced, the position was exited into cash—not reversed into a short—because the short criteria for this use case are distinct. The exit was prompted by 𝓐𝓛𝓣𝓐 crossing back below the +0.3 level, signaling the potential weakening of the long trend.
Later, as 𝓐𝓛𝓣𝓐 crossed below 0, attention shifted toward short opportunities. A short entry was confirmed when 𝓐𝓛𝓣𝓐 dipped below -0.3, indicating growing downside momentum. The position was eventually closed when 𝓐𝓛𝓣𝓐 crossed back above the -0.3 boundary—signaling a possible deceleration of the bearish move.
This logic was consistently applied in subsequent setups, emphasizing the role of 𝓐𝓛𝓣𝓐’s thresholds in guiding both entries and exits.
Framework
The Arnaud Legoux Trend Aggregator (ALTA) combines multiple technical indicators into a single smoothed signal. It uses RSI, MACD, Bollinger Bands, Stochastic Momentum Index, and ATR.
Each indicator's output is normalized to a common scale to eliminate bias and ensure consistency. These normalized values are then transformed using a hyperbolic tangent function (Tanh).
The final score is refined with a custom Arnaud Legoux Moving Average (ALMA) function, which offers responsive smoothing that adapts quickly to price changes. This results in a clear signal that reacts efficiently to shifting market conditions.
⚠️ WARNING ⚠️: THIS INDICATOR, OR ANY OTHER WE (LYRO RS) PUBLISH, IS NOT FINANCIAL OR INVESTMENT ADVICE. EVERY INDICATOR SHOULD BE COMBINED WITH PRICE ACTION, FUNDAMENTALS, OTHER TECHNICAL ANALYSIS TOOLS & PROPER RISK. MANAGEMENT.

SuperTrend Confluence Signals [AlgoAlpha]OVERVIEW
This script enhances the classic SuperTrend indicator by integrating volume dynamics, retracement detection, and a multi-asset trend matrix—alongside an automatic mitigation-level drawing system. It's designed for traders who want to see not just trend direction, but the confluence of trend strength, volatility-adjusted retracements, and capital flow through volume pressure. It visually maps key transitions in market structure while offering a clean, color-coded overview of multiple symbols and timeframes in a single chart.
CONCEPTS
At the core is the traditional SuperTrend , which determines directional bias using Average True Range (ATR) with a volatility multiplier. This script overlays that with a dynamic volume histogram that scales relative to recent volume standard deviation, coloring volume bursts within the trend. Retracement signals are triggered when price pulls back toward the SuperTrend level but respects it—quantified through normalized distance sensitivity. On top of that, the indicator automatically draws and manages horizontal support/resistance zones that appear at key trend shifts. These levels persist and are cleared based on configurable rules such as wick/body sweeps or consecutive candle closes. A multi-asset, multi-timeframe table then gives an instant snapshot of trend status across five user-defined symbols and timeframes.
FEATURES
SuperTrend : Configurable ATR length and multiplier for flexible trend sensitivity.
Volumetric Histogram : Gradient-filled candles anchored to SuperTrend bands, scaled by relative volume to indicate activity intensity during trends.
Retracement Arrows : Signals printed when price nears the SuperTrend level without breaking it, allowing identification of high-probability continuation zones.
Volume TP Markers : Diamond markers flag high-volume events, contextualizing price moves with liquidity bursts.
Automatic Structure Levels : Draws clean horizontal lines at significant trend transitions, with optional volatility-based band fills. These levels self-update and clear based on price interaction logic.
Trend Table : Displays trend direction (▲/▼) across five assets and five timeframes. Each cell is colored according to trend bias, providing a compact overview for multi-market confluence.
USAGE
Start by loading the indicator on your main chart and adjusting the ATR Length and Multiplier to match your strategy timeframe. Use lower values for scalping and higher values for swing trading. The histogram bars will appear as colored candles above or below the SuperTrend level, indicating how strong volume is within that trend. Arrow signals suggest minor pullbacks within the trend, which can act as entry opportunities. The level system will automatically plot key price zones during trend flips; if "Body" is selected for mitigation, price must close through the level to invalidate it. If "Wick" is chosen, a single wick breach is enough. Adjust expiry and rejection settings to fine-tune how long levels stay on chart. Finally, enable the Multi-Asset Table to view live trend signals across popular symbols like AAPL or NVDA in different timeframes, helping spot macro-to-micro alignment for higher-confidence trades.

Statistical Pairs Trading IndicatorZ-Score Stat Trading — Statistical Pairs Trading Indicator
📊🔗
---
What is it?
Z-Score Stat Trading is a powerful indicator for statistical pairs trading and quantitative analysis of two correlated assets.
It calculates the Z-Score of the log-price spread between any two symbols you choose, providing both long-term and short-term Z-Score signals.
You’ll also see real-time correlation, volatility, spread, and the number of long/short signals in a handy on-chart table!
---
How to Use 🛠️
1. Add the indicator to your chart.
2. Select two assets (symbols) to analyze in the settings.
3. Watch the Z-Score plots (blue and orange lines) and threshold levels (+2, -2 by default).
4. Check the info table for:
- Correlation
- Volatility
- Spread
- Number of long (NL) and short (NS) signals in the last 1000 bars
5. Set up alerts for signal generation or threshold crossings if you want to be notified automatically.
---
Trading Strategy 💡
- This indicator is designed for statistical arbitrage (mean reversion) strategies.
- Long Signal (🟢):
When both Z-Scores drop below the negative threshold (e.g., -2), a long signal is generated.
→ Buy Symbol A, Sell Symbol B, expecting the spread to revert to the mean.
- Short Signal (🔴):
When both Z-Scores rise above the positive threshold (e.g., +2), a short signal is generated.
→ Sell Symbol A, Buy Symbol B, again expecting mean reversion.
- The info table helps you quickly assess the frequency of signals and the current statistical relationship between your chosen assets.
---
Best Practices & Warnings 🚦
- Avoid high leverage! Pairs trading can be risky, especially during periods of divergence. Use conservative position sizing.
- Check for cointegration: Before using this indicator, make sure both assets are cointegrated or have a strong historical relationship. This increases the reliability of mean reversion signals.
- Check correlation: Only use asset pairs with a high correlation (preferably 0.8–0.9 or higher) for best results. The correlation value is shown in the info table.
- Scale in and out gradually: When entering or exiting positions, consider doing so in parts rather than all at once. This helps manage slippage and risk, especially in volatile markets.
---
⚠️ Note on Performance:
This indicator may work a bit slowly, especially on large timeframes or long chart histories, because the calculation of NL and NS (number of long/short signals) is computationally intensive.
---
Disclaimer ⚠️
This script is provided for educational and informational purposes only .
It is not financial advice or a recommendation to buy or sell any asset.
Use at your own risk. The author assumes no responsibility for any trading decisions or losses.
Hurst Exponent Oscillator [PhenLabs]📊 Hurst Exponent Oscillator -
Version: PineScript™ v5
📌 Description
The Hurst Exponent Oscillator (HEO) by PhenLabs is a powerful tool developed for traders who want to distinguish between trending, mean-reverting, and random market behaviors with clarity and precision. By estimating the Hurst Exponent—a statistical measure of long-term memory in financial time series—this indicator helps users make sense of underlying market dynamics that are often not visible through traditional moving averages or oscillators.
Traders can quickly know if the market is likely to continue its current direction (trending), revert to the mean, or behave randomly, allowing for more strategic timing of entries and exits. With customizable smoothing and clear visual cues, the HEO enhances decision-making in a wide range of trading environments.
🚀 Points of Innovation
Integrates advanced Hurst Exponent calculation via Rescaled Range (R/S) analysis, providing unique market character insights.
Offers real-time visual cues for trending, mean-reverting, or random price action zones.
User-controllable EMA smoothing reduces noise for clearer interpretation.
Dynamic coloring and fill for immediate visual categorization of market regime.
Configurable visual thresholds for critical Hurst levels (e.g., 0.4, 0.5, 0.6).
Fully customizable appearance settings to fit different charting preferences.
🔧 Core Components
Log Returns Calculation: Computes log returns of the selected price source to feed into the Hurst calculation, ensuring robust and scale-independent analysis.
Rescaled Range (R/S) Analysis: Assesses the dispersion and cumulative deviation over a rolling window, forming the core statistical basis for the Hurst exponent estimate.
Smoothing Engine: Applies Exponential Moving Average (EMA) smoothing to the raw Hurst value for enhanced clarity.
Dynamic Rolling Windows: Utilizes arrays to maintain efficient, real-time calculations over user-defined lengths.
Adaptive Color Logic: Assigns different highlight and fill colors based on the current Hurst value zone.
🔥 Key Features
Visually differentiates between trending, mean-reverting, and random market modes.
User-adjustable lookback and smoothing periods for tailored sensitivity.
Distinct fill and line styles for each regime to avoid ambiguity.
On-chart reference lines for strong trending and mean-reverting thresholds.
Works with any price series (close, open, HL2, etc.) for versatile application.
🎨 Visualization
Hurst Exponent Curve: Primary plotted line (smoothed if EMA is used) reflects the ongoing estimate of the Hurst exponent.
Colored Zone Filling: The area between the Hurst line and the 0.5 reference line is filled, with color and opacity dynamically indicating the current market regime.
Reference Lines: Dash/dot lines mark standard Hurst thresholds (0.4, 0.5, 0.6) to contextualize the current regime.
All visual elements can be customized for thickness, color intensity, and opacity for user preference.
📖 Usage Guidelines
Data Settings
Hurst Calculation Length
Default: 100
Range: 10-300
Description: Number of bars used in Hurst calculation; higher values mean longer-term analysis, lower values for quicker reaction.
Data Source
Default: close
Description: Select which data series to analyze (e.g., Close, Open, HL2).
Smoothing Length (EMA)
Default: 5
Range: 1-50
Description: Length for smoothing the Hurst value; higher settings yield smoother but less responsive results.
Style Settings
Trending Color (Hurst > 0.5)
Default: Blue tone
Description: Color used when trending regime is detected.
Mean-Reverting Color (Hurst < 0.5)
Default: Orange tone
Description: Color used when mean-reverting regime is detected.
Neutral/Random Color
Default: Soft blue
Description: Color when market behavior is indeterminate or shifting.
Fill Opacity
Default: 70-80
Range: 0-100
Description: Transparency of area fills—higher opacity for stronger visual effect.
Line Width
Default: 2
Range: 1-5
Description: Thickness of the main indicator curve.
✅ Best Use Cases
Identifying if a market is regime-shifting from trending to mean-reverting (or vice versa).
Filtering signals in automated or systematic trading strategies.
Spotting periods of randomness where trading signals should be deprioritized.
Enhancing mean-reversion or trend-following models with regime-awareness.
⚠️ Limitations
Not predictive: Reflects current and recent market state, not future direction.
Sensitive to input parameters—overfitting may occur if settings are changed too frequently.
Smoothing can introduce lag in regime recognition.
May not work optimally in markets with structural breaks or extreme volatility.
💡 What Makes This Unique
Employs advanced statistical market analysis (Hurst exponent) rarely found in standard toolkits.
Offers immediate regime visualization through smart dynamic coloring and zone fills.
🔬 How It Works
Rolling Log Return Calculation:
Each new price creates a log return, forming the basis for robust, non-linear analysis. This ensures all price differences are treated proportionally.
Rescaled Range Analysis:
A rolling window maintains cumulative deviations and computes the statistical “range” (max-min of deviations). This is compared against the standard deviation to estimate “memory”.
Exponent Calculation & Smoothing:
The raw Hurst value is translated from the log of the rescaled range ratio, and then optionally smoothed via EMA to dampen noise and false signals.
Regime Detection Logic:
The smoothed value is checked against 0.5. Values above = trending; below = mean-reverting; near 0.5 = random. These control plot/fill color and zone display.
💡 Note:
Use longer calculation lengths for major market character study, and shorter ones for tactical, short-term adaptation. Smoothing balances noise vs. lag—find a best fit for your trading style. Always combine regime awareness with broader technical/fundamental context for best results.

MA Dispersion+MA Dispersion+ — read the “breathing space” between your moving-averages
Get instant feedback on trend strength, volatility expansion and mean-reversion — across any timeframe.
MA Dispersion+ turns the humble moving-average stack into a single, easy-to-read oscillator that tells you at a glance whether price is coiling or fanning out.
🧩 What it does
Plugs into your favourite MA setup
• Pick the classic 5 / 20 / 50 / 200 lengths or disable any combination with one click.
• Choose the MA engine you trust — SMA, EMA, RMA, VWMA or WMA.
• Works on any timeframe thanks to TradingView’s security() engine.
Measures “spread”
For every bar it calculates the absolute distance of each selected MA from their average.
The tighter the stack, the lower the value; the wider the fan, the higher the value.
Adds professional-grade controls
• Weighting — let short-term MAs dominate (Inverse Length), keep everything equal, or dial in your own custom weights.
• Normalisation — convert the raw distance into a percentage of price, ATR multiples, or scale by the MAs’ own mean so you can compare symbols of any price or volatility.
🔍 How traders use it
Trend confirmation – rising dispersion while price breaks out = momentum is genuine.
Volatility squeeze – dispersion parking near zero warns that a big move is loading.
Multi-TF outlook – drop one pane per timeframe (e.g. 5 m, 1 h, 1 D) and see which layer of the market is driving.
Mean-reversion plays – spikes that fade quickly often coincide with exhaustion and snap-backs.
⚙️ Quick-start
Add MA Dispersion+ to your chart.
Set the pane’s timeframe in the first input.
Tick the MA lengths you actually use.
(Optional) Pick a weighting scheme and a normaliser.
Repeat the indicator for as many timeframes as you like — each instance keeps its own settings.
✨ Why you’ll love it
Zero clutter – one orange line tells you what four separate MAs whisper.
Configurable yet bullet-proof – all lengths are hard-coded constants, so Pine never complains.
Context aware – normalisation lets you compare BTC’s $60 000 chaos with EURUSD’s four--decimals calm.
Lightweight – no labels, no drawings, no background processing — perfect for mobile and multi-pane layouts.
Give MA Dispersion+ a try and let your charts breathe — you’ll never look at moving-average ribbons the same way again.
Happy trading!
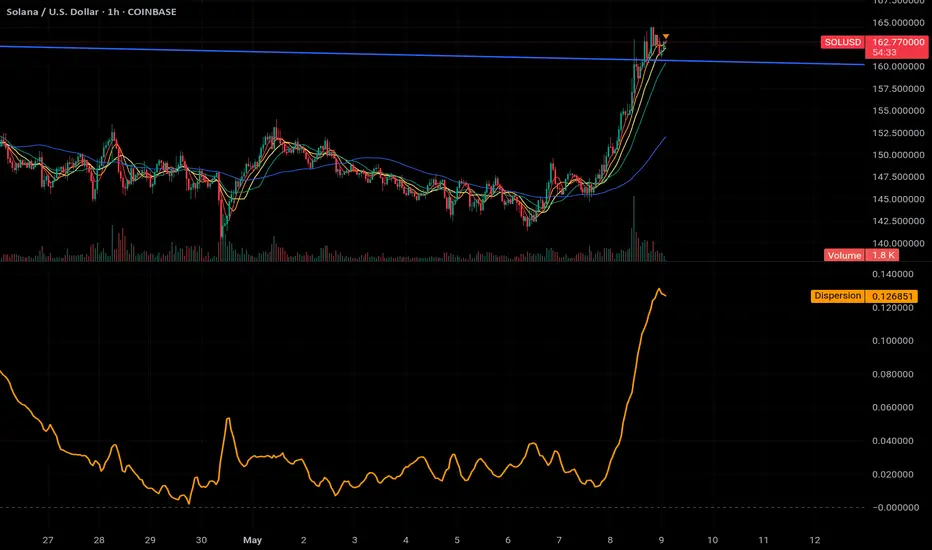
Equal High/Low (EQH/EQL) [AlgoAlpha]OVERVIEW
This script detects and visualizes Equal High (EQH) and Equal Low (EQL) zones—key liquidity areas where price has previously stalled or reversed. These levels often attract institutional interest due to the liquidity buildup around them. The indicator is built to highlight such zones using dynamic thresholding, overbought/oversold RSI filtering, and adaptive mitigation logic to manage zone relevance over time.
CONCEPTS
Equal Highs/Lows are price points where the market has repeatedly failed to break past a certain high or low, hinting at areas where stop orders and pending interest may be concentrated. These areas are often prime targets for liquidity grabs or reversals. By combining this with RSI filtering, the script avoids false signals during neutral conditions and instead focuses on zones where market pressure is more directional.
FEATURES
Detection Logic: The script identifies EQH and EQL zones by comparing the similarity between recent highs or lows with a dynamic volatility threshold. The `tolerance` input allows users to control how strict this comparison is.
RSI Filtering: If enabled, it only creates zones when RSI is significantly overbought or oversold (based on the `state_thresh` input). This helps ensure zones form only in meaningful market conditions.
Zone Display: Bullish (EQL) zones are shown in grey, while bearish (EQH) zones are in blue. Two horizontal lines mark the zone using wick and body extremes, and a filled area visualizes the zone between them.
Zone Management: Zones automatically extend with price until they’re invalidated. You can choose whether a zone is removed based on wick or body sweeps and whether it requires one or two candle confirmations. Zones also expire after a customizable number of bars.
Alerts: Four alert conditions are built in—when a new EQH/EQL is formed and when one is mitigated—making it easy to integrate into alert-based workflows.
USAGE
Equal highs/lows can be used as liquidity markers, either as entry points or as take-profit targets.
This tool is ideal for liquidity-based strategies and helps traders map out possible reversal or sweep zones that often precede aggressive moves.
