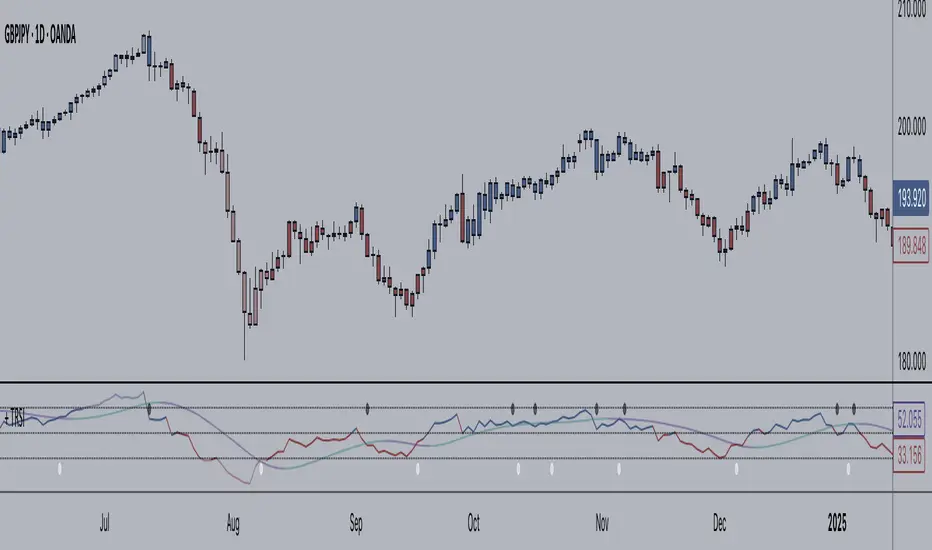
+ TRSIHello again.
Here I have an improved version of the RSI that is similar to my "+ %B" indicator (that, an improved version of the %B).
This version of the RSI includes candle coloring for bullish or bearish bias (is the RSI above or below its median line?), as well as candle coloring for overbought and oversold areas. Additionally, there is an option for coloring candles based on the RSI crossing up or down its moving average.
So, that takes us on to the moving average. You have a selection of these, namely: SMA, EMA, DEMA, TEMA, HMA, JMA, LSMA, MF, SMA (the default), TMA, VAMA, and WMA. These are all very different, so play around and choose one that fits your trading style, or whatever it is you're looking for (or even turn it off if you like!).
I've added alerts, so you can be alerted based on wherever the RSI goes. Is it oversold? Did it just cross the median? Did it cross up or down its MA?
I hope you enjoy it!
Momentum Oscillators

+ True RSIThis is a better, cleaner version (in my opinion) of an part of an indicator I was using that was coded up by cI8DH. I reached out to him about cleaning up the code (things weren't working) for Pinescript v4, but he no longer seems to be active, so I thought I might take it upon myself to at least work out this portion of the indicator.
Much credit goes to him. Below is the indicator that he coded, of which only one part have I made additions to.
So, he calls this the True RSI. I was using it as part of the USI, which I posted above (it's the MA Percent indicator type). To my eyes it's not far different from the standard RSI, so I probably could have just made a version of that, but I like this one, and I was excited to add a few things (like candle coloring, which no longer works with his version!).
So, what's different?
I added two different background fills.
I made the lines types for the extremities and midline more appropriate for the indicator.
I added bullish, bearish, overbought, and oversold candle coloring.
I added a multitude of moving averages as well.
If this looks like my '+ %B' indicator, that is because I basically just moved the MA's and candle coloring code over. One could probably do this with many different indicators.
In the future I will probably add alerts, and maybe MA cross candles as well. Or not. Well, almost certainly alerts. Please enjoy!
+ BB %B: MA selection, bar coloring, multi-timeframe, and alerts+ %B is, at its simplest, the classic Bollinger Bands %B indicator with a few added bells and whistles.
However, the right combination of bells and whistles will often improve and make a more adaptable indicator.
Classically, Bollinger Bands %B is an indicator that measures volatility, and the momentum and strength of a trend, and/or price movements.
It shows "overbought" and "oversold" spots on a chart, and is also useful for identifying divergences between price and trend (similar to RSI).
With + %B I've added the options to select one or two moving averages, candle coloring, and a host of others.
Let's start with the moving averages:
There are options for two: one faster and one slower. Or combine them how you will, or omit one or both of them entirely.
Here you will find options for SMA, EMA (as well as double and triple), Hull MA, Jurik MA, Least Squares MA, Triangular MA, Volatility Adjusted MA, and Weighted MA.
A moving average essentially helps to define trend by smoothing the noise of movements of the underlying asset, or, in this case, the output of the indicator.
All of these MAs available track this in a different way, and it's up to the trader to figure out which makes most sense to him/her.
MA's, in my opinion, improve the basic %B by providing a clearer picture of what the indicator is actually "seeing", and may be useful for providing entries and exits.
Next up is candle coloring:
I've added the option for this indicator to color candles on the chart based on where the %B is in relation to its upper and lower bounds, and median line.
If the %B is above the median but below the upper bound, candles will be green (showing bullish market structure). If %B is below the median but above the lower bound, candles will be red (denoting bearish market structure).
Overbought and oversold candles will also be colored on the chart, so that a quick glance will tell you whether price action is bullish/bearish or "oversold"/"overbought".
I've also added functionality that enables candles to be colored based on if the %B has crossed up or crossed down the primary moving average.
One example as a way to potentially use these features is if the candles are showing oversold coloration followed by the %B crossing up your moving average coloration. You might consider a long there (or exit a short position if you are short).
And the last couple of tweaks:
You may set the timeframe to whatever you wish, so maybe you're trading on the hourly, but you want to know where the %B is on the 4h chart. You can do that.
The background fill for the indicator is split into bullish and bearish halves. Obviously you may turn the background off, or make it all one color as well.
I've also added alerts, so you may set alerts for "overbought" and "oversold" conditions.
You may also set alerts for %B crossing over or under the primary moving average, or for crossing the median line.
All of these things may be turned on and off. You can pretty much customize this to your heart's delight. I see no reason why anyone would use the standard %B after playing with this.
I am no coder. I had this idea in my head, though, and I made it happen through referencing another indicator I was familiar with, and watching tutorials on YouTube.
Credits:
Firstly, thanks to www.tradingview.com for his brilliant, free tutorials on YouTube.
Secondly, thanks to www.tradingview.com for his beautiful SSL Hybrid indicator (and his clean code) from which I obtained the MAs.
Please enjoy this indicator, and I hope that it serves you well. :)

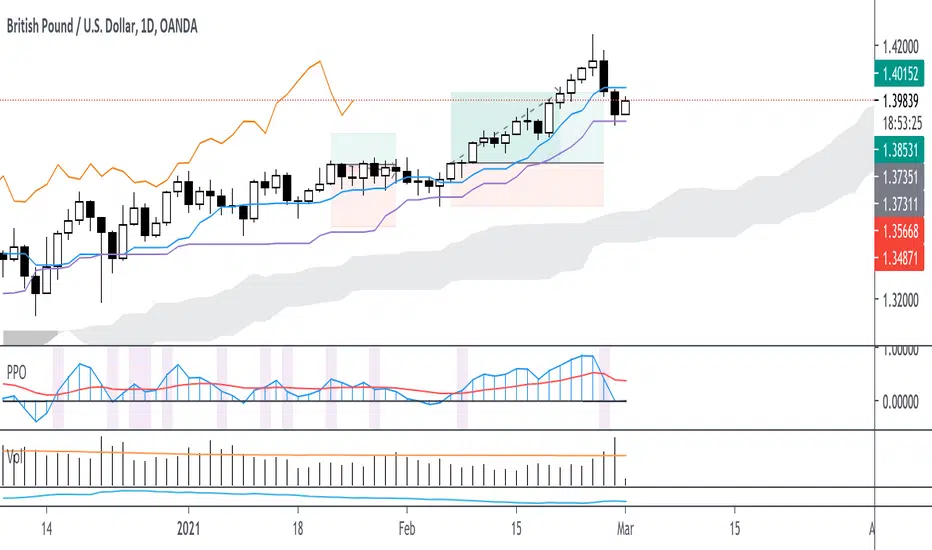
Customizable Percentage Price Oscillator (PPO)The PPO is basically the MACD but in percentage terms. This is better for comparing momentum across different securities.
This script is a standard PPO but with many options for customization. You can set the moving average type of the signal and the oscillator lines separately. You can also weight any moving average of the PPO by volume.
Supported Types of MA:
SMA
EMA
ALMA
HMA
WMA
Personally, I believe weighting by volume is helpful across markets but especially helpful for equities. I like to use 3,10,16 settings similar to Linda Raschke but with EMA instead of SMA. This indicator is especially useful for signaling trend continuation and generating exit signals. For entries, I believe this indicator should not be blindly followed and works better when combined with a trend or price action signal.
If there are requests for more types of moving average to be used with the PPO, I would be down to implement them, but I believe most moving averages are pretty similar.
Unleash Elder Force on Your ChartI had searched for a proper indicator to recognize important impulses, so I just need to take a look at the indicator to quickly find them on the chart. Alexander Elder's Force is the answer, although I made a few changes to the design.
First, I found more accuracy using Hull Moving Average. It steers faster making sudden spikes even more visible. Second, it is faster to catch up and therefore ready for another impulse to measure.
The second change is to the visual presentation of the Elder Force. Columns look prettier and there needs to be a manually set value that gives regular sideways moves a border beside which it is likely to be either an institutional interference or a trend.
Furthermore, you can plot (minus) Elder Force in the indicator window too. This should be used to compare upside and downside thrusts with each other.
I don't use nor intend to use Elder Force as a buy/sell indicator. The point is to highlight certain price-action moments that I will then review and consider an entry after. I believe most indicators should be used like that.
:)

Cycle Swing MomentumAdaptive Ultra-Smooth Momentum indicator
The Cycle-Swing-Indicator "CSI" provides an optimized "momentum" oscillator based on the current dominant cycle by looking at the swing of the dominant cycle instead of the raw source momentum. Offering the following improvements:
Smoothness
Zero delay
Sharpness at turning points
Robust and adaptable to market conditions
Accurate deviation detection
The following common problems with standard indicators are solved by this indicator:
First, normal indicators introduce a lot of false signals due to their noisy signal line. Second, to compensate for the noise, one would normally try to add some smoothing. But this only results in adding more delay to the indicator, which makes it almost useless. Third, standard indicators require a length adjustment to derive reliable signals. However, you never know how to set the right length.
All three problems described above are solved by the developed adaptive cyclic algorithm.
The above chart shows current Bitcoin 4h data from the last days as of writing with the proposed signal reading for this indicator. The standard momentum indicator is included for comparison.
HOW TO USE
The indicator works without any parameter and can be applied to any chart and any time-frame. It will adapt automatically to the Dominant Cycle and use the dominant cycle of the source data to derive the ultra smooth momentum curve. Adaptive upper/lower bands are included and highlight areas with extreme readings. Automatic divergence detection can be turned off/on.
HOW TO READ
The indicator can be used like any oscillator. In addition, it provides adaptive high and low bands.
* Look for turns above the upper/lower bands
* Look for divergences between source and signals line
Further reading/Original source:
The indicator uses the dominant cycle to optimize signal, smoothing and cyclic memory. To get more in-depth information on the Cycle Swing Indicator, please read Chapter 10 "Cycle Swing Indicator: Trading the swing of the dominant cycle" of the book "Decoding the Hidden Market Rhythm, Part 1" available at your favorite book store.
Related ideas:
Please also check the cyclic RSI indicator which also uses cyclic information to improve the signal.

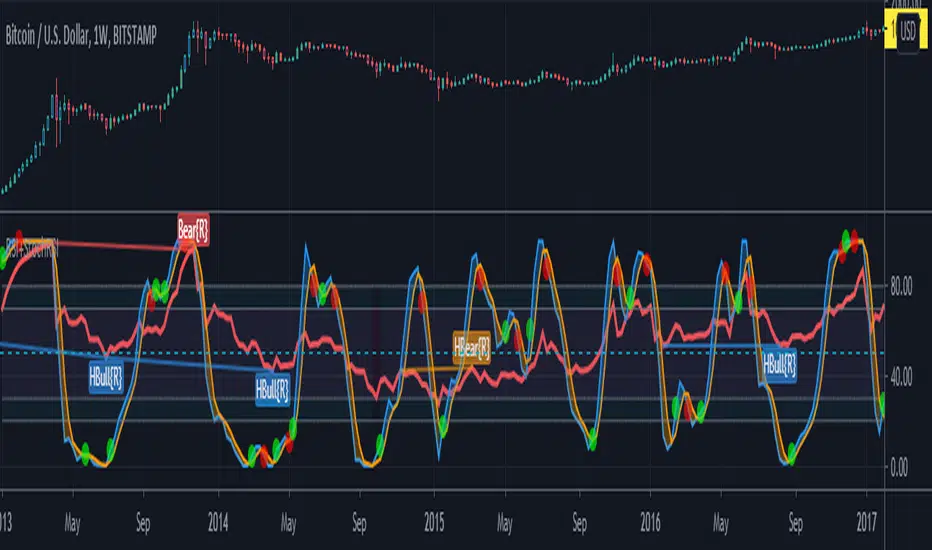
Relative Strength of Volume Indicators by DGTThe Relative Strength Index (RSI) , developed by J. Welles Wilder, is a momentum oscillator that measures the speed and change of price movements.
• Traditionally the RSI is considered overbought when above 70 and may be primed for a trend reversal or corrective pullback in price, and oversold or undervalued condition when below 30. During strong trends, the RSI may remain in overbought or oversold for extended periods.
• Signals can be generated by looking for divergences and failure swings. If underlying prices make a new high or low that isn't confirmed by the RSI, this divergence can signal a price reversal. If the RSI makes a lower high and then follows with a downside move below a previous low, a Top Swing Failure has occurred. If the RSI makes a higher low and then follows with an upside move above a previous high, a Bottom Swing Failure has occurred
• RSI can also be used to identify the general trend. In an uptrend or bull market, the RSI tends to remain in the 40 to 90 range with the 40-50 zone acting as support. During a downtrend or bear market the RSI tends to stay between the 10 to 60 range with the 50-60 zone acting as resistance
This study aim to implement Relative Strength concept on most common Volume indicators, such as
• Accumulation Distribution is a volume based indicator designed to measure underlying supply and demand
• Elder's Force Index (EFI) measures the power behind a price movement using price and volume
• Money Flow Index (MFI) measures buying and selling pressure through analyzing both price and volume (used as it is)
• On Balance Volume (OBV) , created by Joe Granville, is a momentum indicator that measures positive and negative volume flow
• Price Volume Trend (PVT) is a momentum based indicator used to measure money flow
Plotting will be performed for regular RSI and RSI of Volume indicator (RSI(VOLX)) selected from the dialog box, where the possibility to apply smoothing is provided as option. Additionally, labels can be added optionally to display the value and name of selected volume indicator
Secondly, ability to present Volume Histogram within the same study along with its Moving Average or Volume Oscillator based on selection
Finally, Volume Based Colored Bars , a study of Kıvanç Özbilgiç is added to emphasis volume changes on top of the bars
Nothing excessively new, the study combines RSI with;
- RSI concept applied to some of the common Volume indicators presented with a highlighted over/under valued threshold area, optional labeling and smoothing,
- added Volume data with additional information and
- colored bars based on volume
Thanks @Vishant_Meshram for the inspiration 🙏
Disclaimer:
Trading success is all about following your trading strategy and the indicators should fit within your trading strategy, and not to be traded upon solely
The script is for informational and educational purposes only. Use of the script does not constitute professional and/or financial advice. You alone have the sole responsibility of evaluating the script output and risks associated with the use of the script. In exchange for using the script, you agree not to hold dgtrd TradingView user liable for any possible claim for damages arising from any decision you make based on use of the script

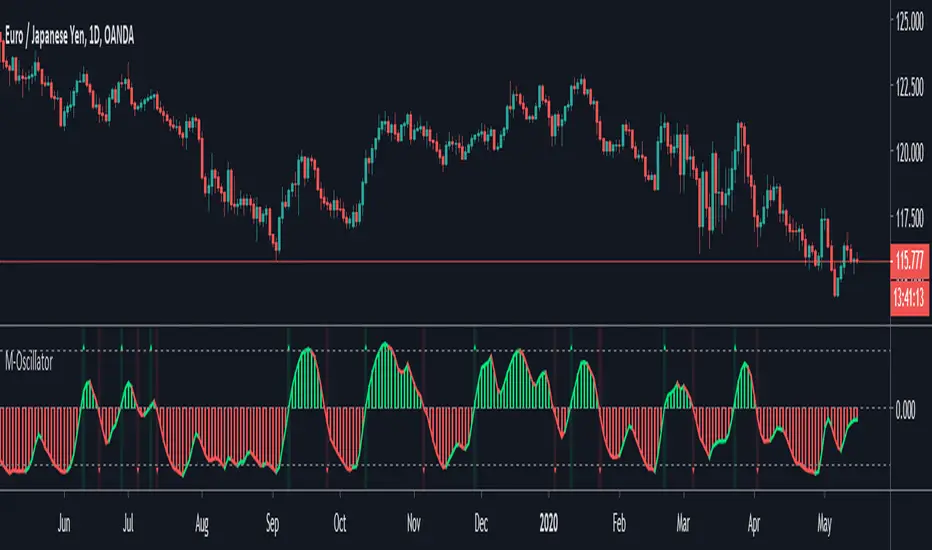
M-OscillatorM-Oscillator developed By Mohamed Fawzy, MFTA, CFTe
as Written in IFTA Journal 2018 Edition
more info : ifta.org
Interpretation
• M-Oscillator is a bounded oscillator that moves between (-14) and (+14),
• Movement above 10 is considered overbought, and movement below -10 is oversold.
Overbought/Oversold rule:
• Buy when the M-Oscillator violates the (-10) level to the downside and crosses back to the upside.
• Sell when the M-Oscillator crosses above the (+10) level and crosses back to the downside.
Crossover on Extreme Levels
• Sell signals are triggered when the M-Oscillator crosses its signal line above (13), which indicates an extreme market condition
• Buy signals are triggered when the M-Oscillator crosses its signal line below (- 13)
Double Smoothed Relative Strength IndexThe Double Smoothed RSI Indicator was created by William Blau (Stocks & Commodities V. 9:5 (202-205)) and is a variation of the classic RSI using his Momenta Indicator and his Momenta RSI formula. I have color coded everything to make it very easy to determine buy and sell signals.
Let me know if you would like to see me write scripts for other indicators!

Momenta Relative Strength IndexThe Momenta RSI Indicator was created by William Blau (Stocks & Commodities V. 9:5 (202-205)) and is a variation of the classic RSI using his Momenta Indicator formula. I have color coded everything to make it very easy to determine buy and sell signals.
Let me know if you would like to see me write scripts for other indicators!

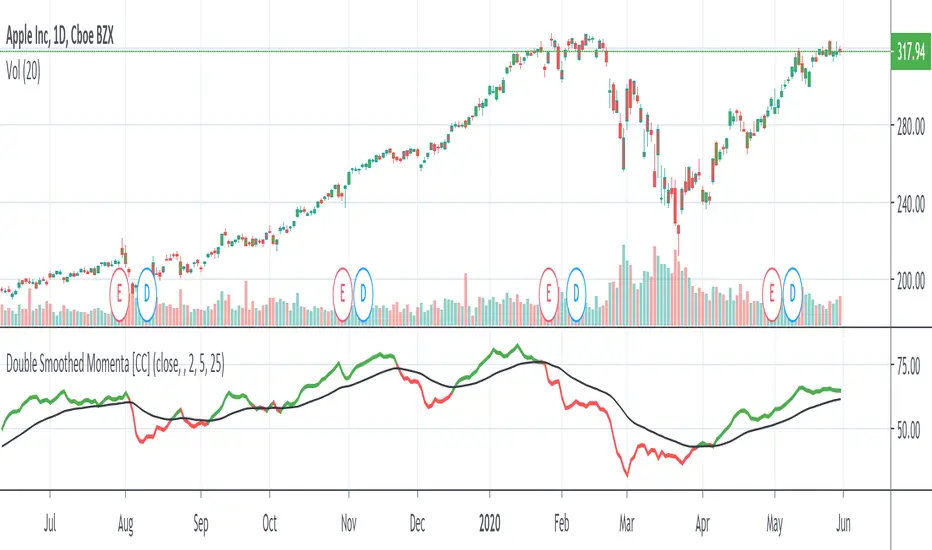
Double Smoothed MomentaDouble Smoothed Momenta was created by William Blau (Stocks & Commodities V. 9:5 (202-205)). His original indicator didn't use a signal period so I added one to notify you when to buy or sell. Buy when the indicator goes over the signal line and sell when it is falls below the signal line.
Let me know what other indicators you would like me to write scripts for!
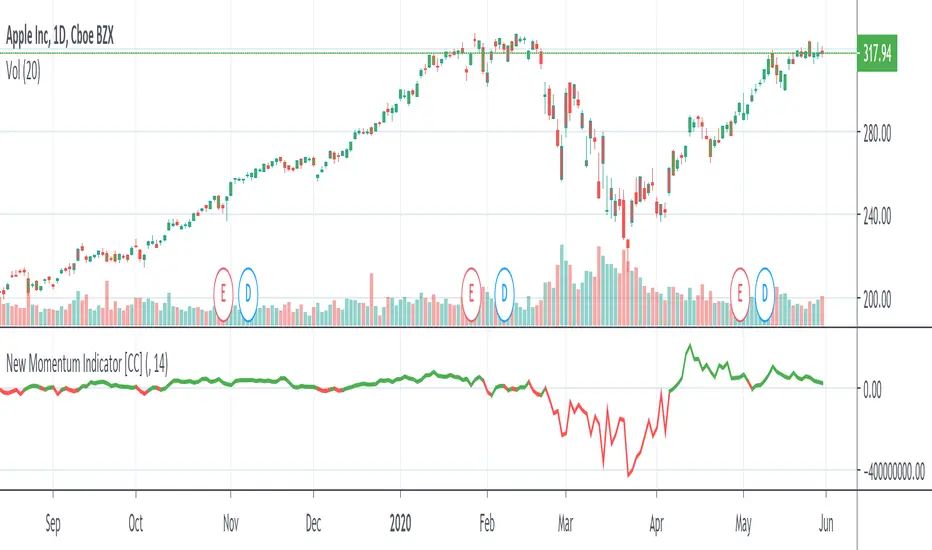
New Momentum IndicatorThe Momentum Indicator was created by Darryl W Maddox (Stocks & Commodities V. 9:4 (158-159)) and it is one of the simplest and most powerful indicators out there. Buy when the indicator goes over 0 and sell when it falls below 0
Let me know what other indicators you would like to see me write a script for!
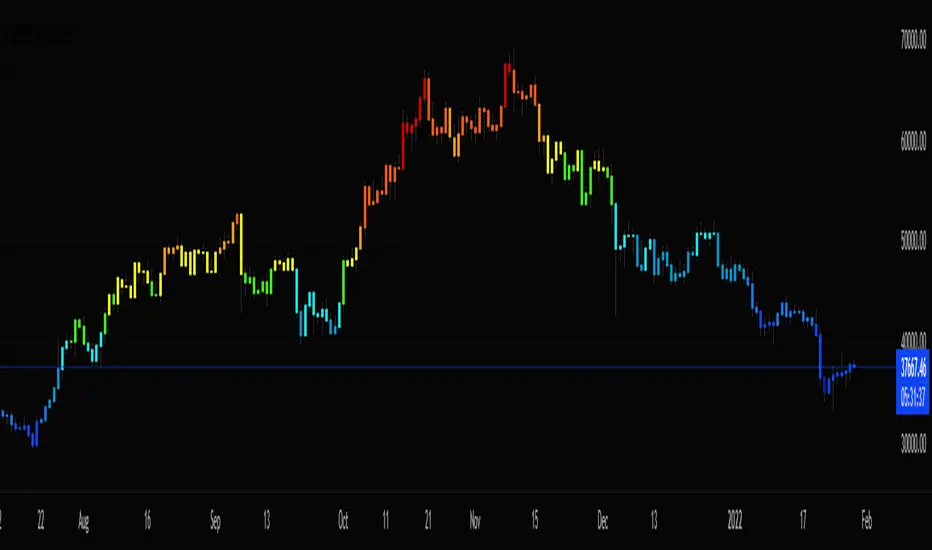
Stochastic CandlesA series of up to 28 stochastics oscillators used to form an average stochastic value, which is then used to colour the candles based on the momentum.
Each candle can be coloured one of ten colours and each one represents a position on the stochastic oscillator.
The indicator helps traders to visualise the momentum and helps trend following.
Inputs:
MA: multiple smoothing methods
Theme: multiple colours
Increment: stochastic length start and increments
End: stochastic length end
Smooth: smooth stochastic
Stochastic Heat MapA series of 28 stochastic oscillators plotted horizontally and stacked vertically from bottom to top as the oscillator background.
Each oscillator has been interpreted and the value has been used to colour the lines in.
Lower lines are shorter term stochastics and higher lines are longer term stochastics.
The average of the 28 stochastics has been taken and then used to plot the fast oscillator line, which also has a slow oscillator line to follow.
The oscillator line can be used to colour in the candles.
Inputs:
MA: multiple smoothing methods
Theme: multiple colours
Increment: stochastic length start and increments
Smooth Fast: smooth fast length
Smooth Slow: smooth slow length
Paint Bars: colour candles
Waves: toggle method to weight/increment stochastics
Heat map shows momentum extremes:

Force IndexWhat is the force index ?
The force index is an oscillator used to confirm price breakout strengths and identify potential trends.
It was popularized by A. Elder.
How the force index is computed ?
Knowing that volume is the fuel of a price movement, reliable breakouts and trend continuation are more likely to occur on high volume breakouts. This is why the force index is computed with the intensity of the price movement, and it's volume , using the formula ema13((close(n) - close(n-1)) * volume ) .
How to use the force index
An important change in the force index indicate a strong momentum in the price action.
You can read more about the force index interpretation on Investopedia
Customization
You can display the indicator as an histogram, or as a line chart.
You can change EMA length, although it's recommended to keep it at default value.

Elder's Force Index with bollinger bandsThis scripts is usefull to identify possible top or bottoms of the markets.
Red BB : Sell
Green BB : Buy

RVGI Space Value- Momentum Oscillator
- Calculates Distance Between RVGI Lines
- Can be used as a substitute and/or complement to RSI

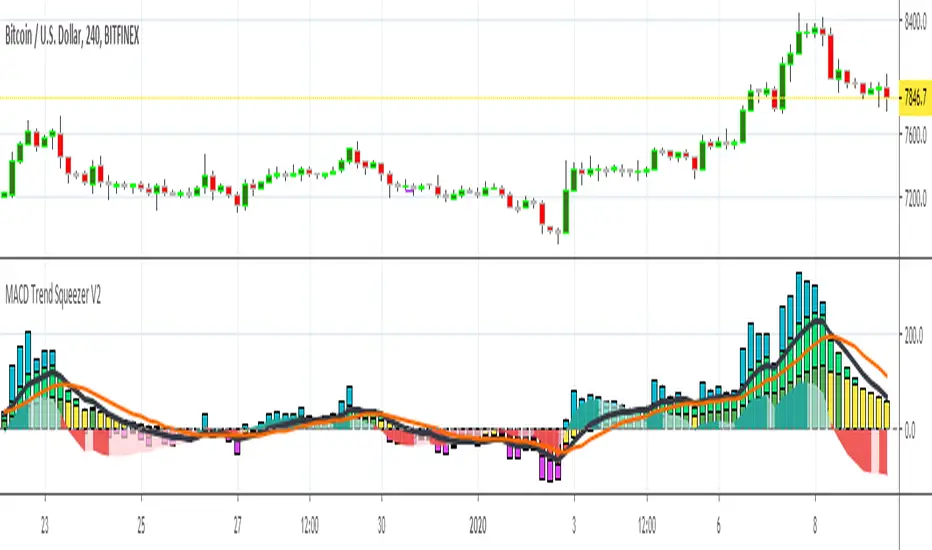
MACD Trend Squeezer V2This is a combination of a slightly sped up MACD overlay on top of a modified Bar Trend Squeeze or highly modified Momentum indicator. Helps to see the trend/momentum matched with the characteristics of the MACD and it's historiography. Very user friendly for adjusting color, transparency, depth, lines, size, etc.
MACD is the dark gray line.
Its signal slower line is orange.
Its historiography is the area fill blues and reds
Trend Squeezer / momentum are the Bars in the background.
// Changes from original version \\
Visual depth mostly. Most of the items are adjustable in the settings.
Increased user friendly inputs to adjust colors, lines, data, etc.
(darken / lighten and change background bar colors, increase/decrease line strengths and colors, adjust field data inputs)
Elder's force index impulseForce Index is an oscillator. It combines volume with prices
to discover the force of bulls or bears behind every rally or decline.
It brings together three essential pieces of information the direction of price
change, its extent, and the volume during that change. It provides a practical way of
using volume for making trading decisions.
Force Index can be used in its raw form, but its signals stand out much more
clearly if we smooth it with a moving average. Using a short EMA of Force Index
helps pinpoint entry and exit points. Using a longer EMA helps confirm trends.
Efi long > 0 (bullish trend) and efi short < 0 = buy signal (green bar)
Efi long < 0 (bear trend) and efi short>0 = sell signal (red bar)


Kairi Relative Index Leading IndicatorHere is a leading indicator based on the relatively obscure Kairi Relative Index. The Kairi comes from Japan and is similar to the popular RSI, although it is believed that it predates the RSI significantly.
The Kairi measures the difference between the current price and its SMA as a percentage of the moving average.
We made a few modifications to the Kairi to improve its timing and balance its sensitivity. First, we calculated a 'fast' and 'slow' Kairi Relative Index. To do this, it calculates the difference between the current price and a SMA with a length of 7 periods for the fast Kairi. Then, the difference between the current price and an SMA of length 24 is calculated for the slow Kairi.
The big modification is using a 25 period SMA of slow Kairi Relative Index values as the threshold for buy and sell signals. When the fast Kairi line crosses above the white line(the threshold) it is considered a bullish signal, while a bearish signal comes when it crosses back below the same white line. This solved the issue with the Kairi having slower reaction time than the RSI. As the chart shows, this setup allowed it to catch not only major trends but also predict unexpected price spikes.
Users can adjust all 3 lengths, as well as adjust the option to have the slow Kairi displayed on the chart(shown in second pane).
