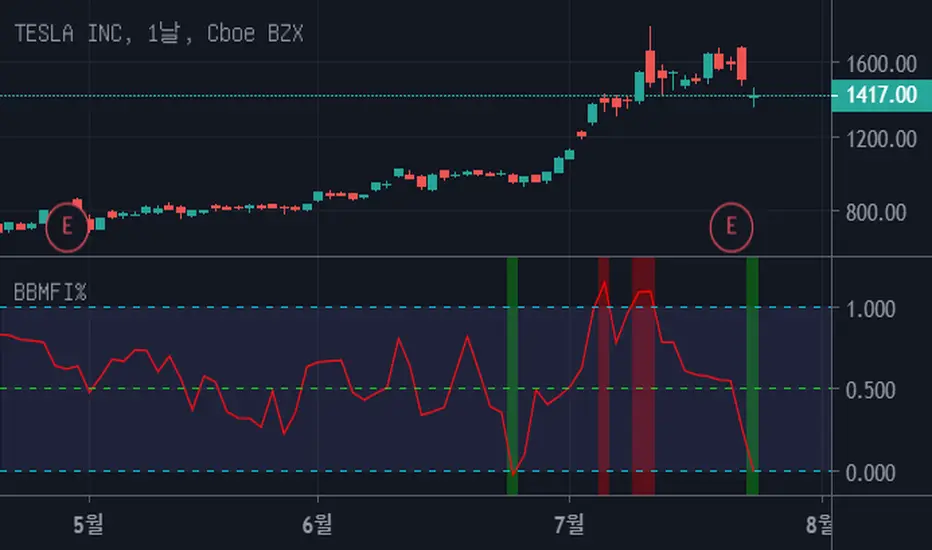
Bollinger Bands Money Flow Index %This script is similar to the previous one "Bollinger Bands Money Flow Index" but it's a little easier to interpret.
Fix the top line of the "BBMFI" to 1, and the bottom line to 0.
Indicates where "Money Flow Index" is located between the top and bottom lines.
If it's bigger than 1, it's overbuying. If it's less than 0, it's overselling.
Consider a trade if you are out of range from 0 to 1.
It's also a good trade timing to out of range and come back in.
Moneyflowindex
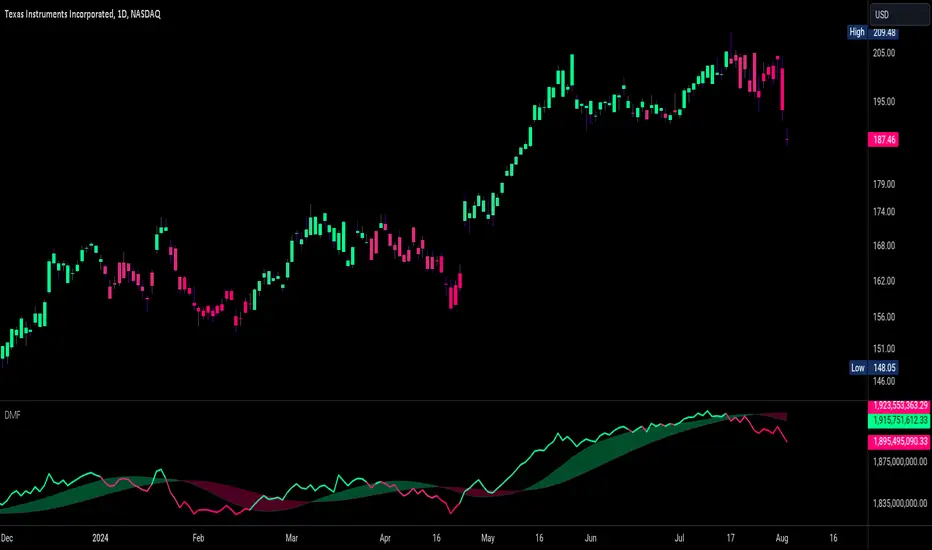
Dynamic Money FlowDynamic Money Flow is a volume indicator based on Marc Chaikin's Money Flow with a few improvements.
It can be used to confirm break-outs and trends.
Zero line crosses and divergences can provide useful signals while considering chart analysis as well.
Two weaknesses of CMF have been already fixed by Colin Twiggs (IncredibleCharts)...
1.CMF uses Chaikin's accumulation/distribution line to calculate the flow of money.
Accumulation/distribution line does not take the gaps into account. This can be solved using true range.
I call it true accumulation/distribution.
2.Oscillators have a tendency to center because of averaging calculations.
DMF is average of flowing volume divided by average of total volume. This means indicator plots the change of first factor compared to the other one. In Simple Averaging method every data is given an equal weight thus when the last data drops it will have heavy impact on the averages and the change of them.
It is much easier to identity these impacts after the drop of very high or very low data... So reducing the weight exponentially is a better option.
3.There is something else with CMF... changes of close price is ignored, because the formula only compares close price to its range.
To include the movements of close beside the close to range comparison, the distance between two last close prices should be compared to true range as well.
So volume can be distributed between close to range comparison (True Accumulation/Distribution) and close to close comparison automatically. And then results are summed to have a single multiplier.
An example for how close to close comparison affects DMF...
Or here you can see how lower wicks keep TMF (same as CMF in this case) from crossing zero line while price is trending down.
Open Interest Money Flow Index (OIMFI)CAUTION : This system was inspired from seiglerj' s "Money Flow Index " script. Open Interests are used instead of volume.
What is the Money Flow Index ( MFI )?
The Money Flow Index ( MFI ) is a technical oscillator that uses price and volume for identifying overbought or oversold conditions in an asset. It can also be used to spot divergences which warn of a trend change in price. The oscillator moves between 0 and 100.
Unlike conventional oscillators such as the Relative Strength Index ( RSI ), the Money Flow Index incorporates both price and volume data, as opposed to just price. For this reason, some analysts call MFI the volume-weighted RSI .
What Does the Money Flow Index ( MFI ) Tell You?
One of the primary ways to use the Money Flow Index is when there is a divergence. A divergence is when the oscillator is moving in the opposite direction of price. This is a signal of a potential reversal in the prevailing price trend.
For example, a very high Money Flow Index that begins to fall below a reading of 80 while the underlying security continues to climb is a price reversal signal to the downside. Conversely, a very low MFI reading that climbs above a reading of 20 while the underlying security continues to sell off is a price reversal signal to the upside.
Traders also watch for larger divergences using multiple waves in the price and MFI . For example, a stock peaks at $10, pulls back to $8, and then rallies to $12. The price has made two successive highs, at $10 and $12. If MFI makes a lower higher when the price reaches $12, the indicator is not confirming the new high. This could foreshadow a decline in price.
The overbought and oversold levels are also used to signal possible trading opportunities. Moves below 10 and above 90 are rare. Traders watch for the MFI to move back above 10 to signal a long trade, and to drop below 90 to signal a short trade.
Other moves out of overbought or oversold territory can also be useful. For example, when an asset is in an uptrend, a drop below 20 (or even 30) and then a rally back above it could indicate a pullback is over and the price uptrend is resuming. The same goes for a downtrend. A short-term rally could push the MFI up to 70 or 80, but when it drops back below that could be the time to enter a short trade in preparation for another drop .
Reference : www.investopedia.com
WARNING :
** Since each instrument in the list has its own unique contract data, you must first enter its name to display it. I recommend you to select OANDA from the markets. Finally, when the COT reports are issued, it may repaints. However, this repaint is usually close to closing or after close .(When COT reports are so sharp ) So use this script only 1W ( 1 week ) or 1 M ( 1 month ) timeframe.
** This data is taken to Tradingview with the help of Quandl. This is a very low possibility, but the system will not work if there is a malfunction.
FEATURES :
*** Working with all futures (Including : Bitcoin )
*** If you dont work with "Futures" , you can select "Others" from switchable menu and use volume for all instruments.
*** New generation elegant design used : Adaptive coloring Overbought - Oversold Levels according to the closing price.
NOTE : This code is open source under the MIT License. If you have any improvements or corrections to suggest, please send me a pull request via the github repository github.com
Stay tuned. Best wishes !

RSI / Stoch / SRSI / MFI / Aroon Overlay [SigmaDraconis]Combines 4 popular indicators (RSI, Stoch, SRSI, MFI) and 1 peculiar one (Aroon) in 1 for those who want to save indicators but not only.
This is an evolution of my (simpler) "RSI / Stoch / Stoch RSI (SRSI) Overlay " that you can find on my scripts.
Added bands for oversold/overbought areas (70/30 common for RSI and 80/20 for SRSI and MFI), as well as a middle 50 horizontal line.
Neutral bands around 55-45 added as well that can be hidden for less clutter. I also recommend a more transparent coloring for these since Pine script doesn't allow default transparency for horizontal lines.
By default only RSI and Stoch are activated, you can activate Aroon, MFI and SRSI on the inputs window.
Some extra notes:
* RSI, Stoch and MFI can help to strengthen one's decision as well as Aroon to predict a possible trend reversal, SRSI can show when RSI has high probability of being topped or bottomed when oversold/overbought but don't forget to look at volume and how the trend progresses that can keep SRSI above 80 or below 20 while RSI and price continues to trend, divergences are most helpful here to find possible reversal areas.
* This chart depicts some interesting divergences, as well as Stoch tops and bottoms and confluences between RSI/MFI and Stoch on some over-extended tops and bottoms that shown being good reversal zones.
RSI resistances are shown as well, failing to break above 60 or the neutral zone (this is a bearish BTC trend chart after all) or failing to gain support to break up certain levels (RSI notes a more bullish trend when consistently above 60 and more bearish below 40).
If you like it and use it to profit, please tip me below :)
Tip jars:
BTC: 15nMBiEGVrdGcu9C1h6QRcTNRvugHkqrMQ
ETH: 0xC33845946c48B61fBCbEA0367ec2238CaF2b73bc
BTS: sigma-draconis

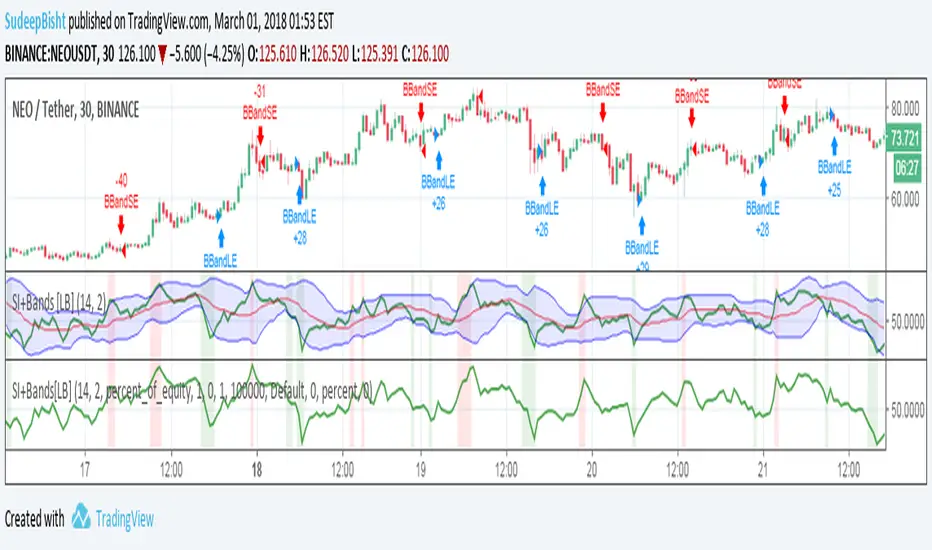
SB_RSI/MFI with Volatility Version 1.0Take on LazyBear's SB_RSI/MFI with Volatility Indicator.
The original indicator is coupled with the Bollinger Band strategy.
Original Idea:
Wanted to test the indicator with bbstrategy.
Message if you think of any modifications/ enhancements/ any opportunities. :)
Donations/Tips... :) -
BTC: 1BjswGcRR6c23pka7qh5t5k56j46cuyyy2
ETH: 0x64fed71c9d6c931639c7ba4671aeb6b05e6b3781
LTC: LKT2ykQ8QSzzfTDB6Tnsf12xwYPjgq95h4