Trend Indicator A-V2 (Smoothed Heikin Ashi Cloud)"Trend Indicator A-V2" and "Trend Indicator B-V2" are updated and improved versions of my initial trend indicators. Totally rethinking the code, adding highs and lows in the calculations, including some more customisation through colour schemes.
In practice, this indicator uses EMAs and Heikin Ashi to provide an overall idea of the trend.
The "Trend Indicator A-V2" is an overlay showing “Smoothed Heikin Ashi” .
The "Trend Indicator B-V2" uses the same values in a different way to measure the momentum of the trend and identify potential trend rejections.
Please, take into account that it is a lagging indicator.
Moving

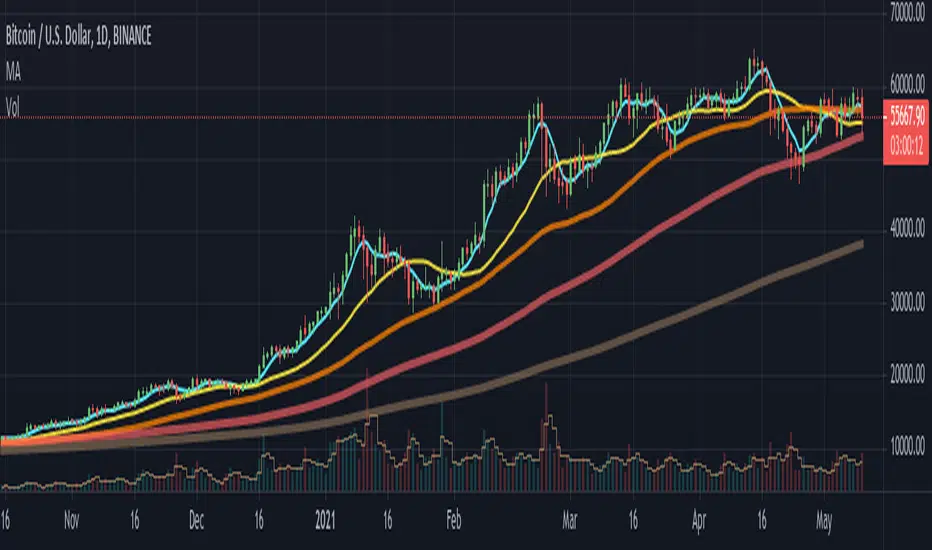
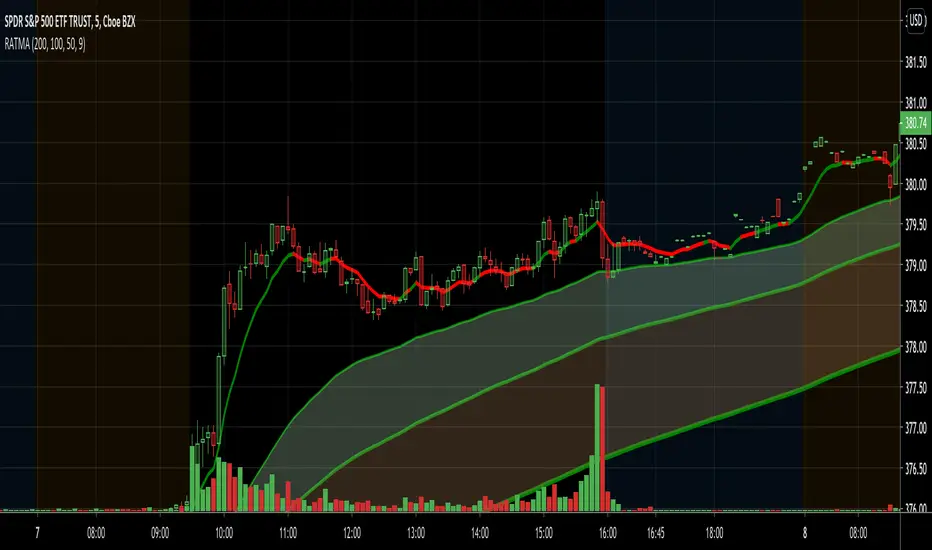
Moving Average BandsUse this script to find buy and sell zones for BTC based on momentum of the move relative to the average asset price over a given period. The script plots a series of offset bands above and below the Simple Moving Average. When price crosses another band further from the SMA, the background is rendered brighter. The brighter the background, the stronger the buy and sell signal is, as the expectation is that price wants to return to the SMA. Settings are adjustable to fine tune to various time frames and assets. Good settings for BTC Daily are length 30, layers at 10, 20, 30, and 40.
On 1H BTC/USD I use length 200, layers at 5, 10, 15, 20 to find decent swing trading opportunities.
On BTC/USD 1D chart, combine with Bitcoin Logarithmic Growth Curve from @mabonyi (original by @quantadelic )for confluence of very reliable signals.

Overlay Indicators (EMAs, SMAs, Ichimoku & Bollinger Bands)This is a combination of popular overlay indicators that are used for dynamic support and resistance, trade targets and trend strength.
Included are:
-> 6 Exponential Moving Averages
-> 6 Simple Moving Averages
-> Ichimoku Cloud
-> Bollinger Bands
-> There is also a weekend background marker ideal for cryptocurrency trading
Using all these indicators in conjunction with each other provide great confluence and confidence in trades and price targets.
An explanation of each indicator is listed below.
What Is an Exponential Moving Average (EMA)?
"An exponential moving average (EMA) is a type of moving average (MA) that places a greater weight and significance on the most recent data points. The exponential moving average is also referred to as the exponentially weighted moving average. An exponentially weighted moving average reacts more significantly to recent price changes than a simple moving average (SMA), which applies an equal weight to all observations in the period.
What Does the Exponential Moving Average Tell You?
The 12- and 26-day exponential moving averages (EMAs) are often the most quoted and analyzed short-term averages. The 12- and 26-day are used to create indicators like the moving average convergence divergence (MACD) and the percentage price oscillator (PPO). In general, the 50- and 200-day EMAs are used as indicators for long-term trends. When a stock price crosses its 200-day moving average, it is a technical signal that a reversal has occurred.
Traders who employ technical analysis find moving averages very useful and insightful when applied correctly. However, they also realize that these signals can create havoc when used improperly or misinterpreted. All the moving averages commonly used in technical analysis are, by their very nature, lagging indicators."
Source: www.investopedia.com
Popular EMA lookback periods include fibonacci numbers and round numbers such as the 100 or 200. The default values of the EMAs in this indicator are the most widely used, specifically for cryptocurrency but they also work very well with traditional.
EMAs are normally used in conjunction with Simple Moving Averages.
" What Is Simple Moving Average (SMA)?
A simple moving average (SMA) calculates the average of a selected range of prices, usually closing prices, by the number of periods in that range.
Simple Moving Average vs. Exponential Moving Average
The major difference between an exponential moving average (EMA) and a simple moving average is the sensitivity each one shows to changes in the data used in its calculation. More specifically, the EMA gives a higher weighting to recent prices, while the SMA assigns an equal weighting to all values."
Source: www.investopedia.com
In this indicator, I've included 6 popular moving averages that are commonly used. Most traders will find specific settings for their own personal trading style.
Along with the EMA and SMA, another indicator that is good for finding confluence between these two is the Ichimoku Cloud.
" What is the Ichimoku Cloud?
The Ichimoku Cloud is a collection of technical indicators that show support and resistance levels, as well as momentum and trend direction. It does this by taking multiple averages and plotting them on the chart. It also uses these figures to compute a "cloud" which attempts to forecast where the price may find support or resistance in the future.
The Ichimoku cloud was developed by Goichi Hosoda, a Japanese journalist, and published in the late 1960s.1 It provides more data points than the standard candlestick chart. While it seems complicated at first glance, those familiar with how to read the charts often find it easy to understand with well-defined trading signals."
More info can be seen here: www.investopedia.com
I have changed the default settings on the Ichimoku to suit cryptocurrency trading (as cryptocurrency is usually fast and thus require slightly longer lookbacks) to 20 60 120 30.
Along with the Ichimoku, I like to use Bollinger Bands to not only find confluence for support and resistance but for price discovery targets and trend strength.
" What Is a Bollinger Band®?
A Bollinger Band® is a technical analysis tool defined by a set of trendlines plotted two standard deviations (positively and negatively) away from a simple moving average (SMA) of a security's price, but which can be adjusted to user preferences.
Bollinger Bands® were developed and copyrighted by famous technical trader John Bollinger, designed to discover opportunities that give investors a higher probability of properly identifying when an asset is oversold or overbought."
This article goes into great detail of the complexities of using the Bollinger band and how to use it.
=======
This indicator combines all these powerful indicators into one so that it is easier to input different settings, turn specific tools on or off and can be easily customised.

SNAP BACK 2.0 Strategy
This strategy is designed to allow you to catch the bounce or "SNAP Back" of an equity that has been in a trend.
1) Once the moving averages are in the order of 200SMA > 50 SMA > 34EMA > 20SMA > 8EMA (or reverse for and uptrend), the strategy is setup.
2) Next you wait for a trigger of the closing price crossing the 8EMA, while there is a desired gap size between the 8EMA and the 20SMA (2-10% of stock value preferred).
3) Exit position based on target profit reached (conservative sell half at 34EMA and engage a trailing stop loss for remainder or set static limit) or price crosses 8EMA or stop loss%
*)This code also allows you to determine your desired backtesting date compliments of alanaster
This code is the product of many hours of hard work on the part of the greater tradingview community. The credit goes to everyone in the community who has put code out there for the greater good.
The idea for the coding came from a video I watched on YouTube presented by TradeStation called Snap Back - thank you guys for the inspiration.
UPDATE: I have coded the other side of the strategy to allow you to take advantage of the same set-up in an uptrend for Short plays. You can turn the up or downsides on, off, or both.
The main intent is to catch the bounces of a falling stock. However, I have found that you can do the inverse and catch the drops in a rising stock (the latter is not as reliable). This also tends to work better on less volatile stocks. I have included a large volume of user defined conditions and display entry and exit conditions on the chart to see how your choices are impacting the script.

Customisable Moving Averages x5This is a Moving Averages pack with 5 lines.
This indicator is different from others because with it you can select the MA type used in calculations for each line.
Available MA types are (currently):
SMA
EMA
WMA
VWMA
RMA
HMA
Also configurable (for each line) are data source (open, close, hlc3, etc) and period.
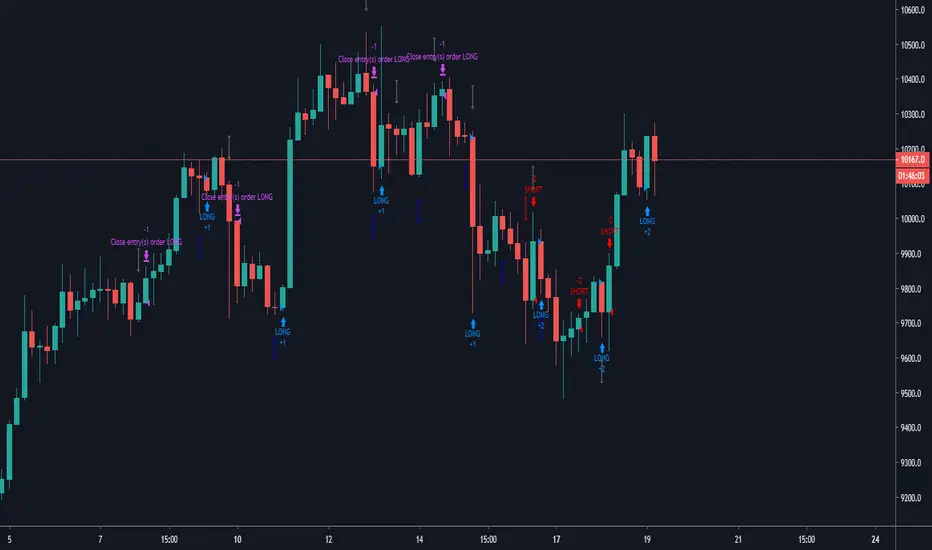
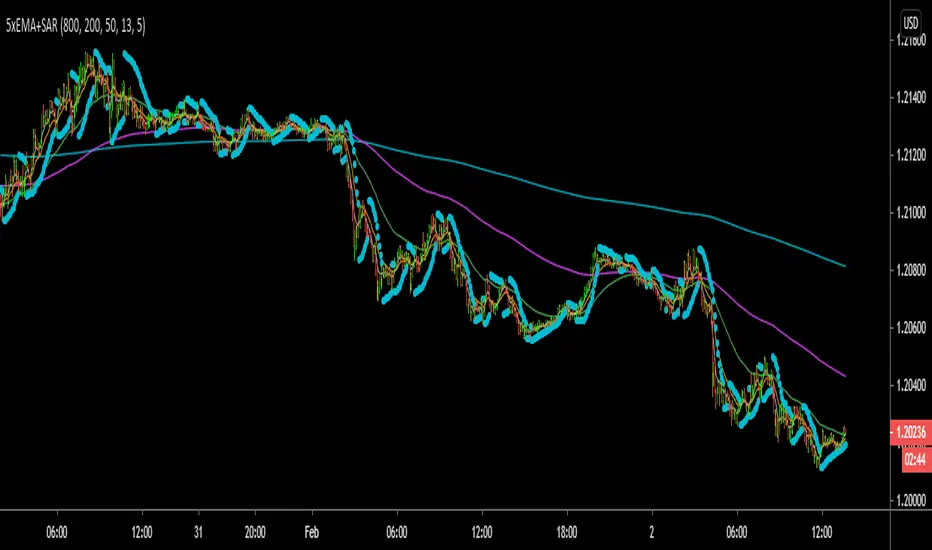
Heavy EMAThis script looks at 5 different EMAs so that you can compare the short term to the long term trend, and combines it with the Parabolic SAR. This can be used to find a great entry into a new or reversing trend.
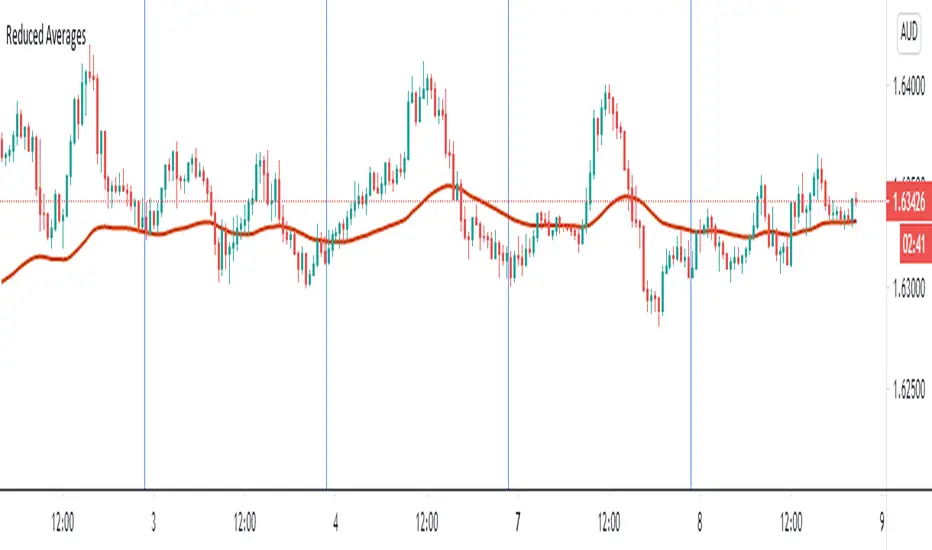
Reduced Averages (20,50,100,200)This script simply takes average value of exponential averages with a goal of reducing the noise on your chart. Many traders use a bunch of averages to identify a trend as they perfectly line up. Reduced Averages does just that. When price is close to a central line, you can comfortbly switch to another chart. When you see it deviating further away, you can enable 20 EMA, 50 EMA, 100 EMA and 200 EMA with a single click.
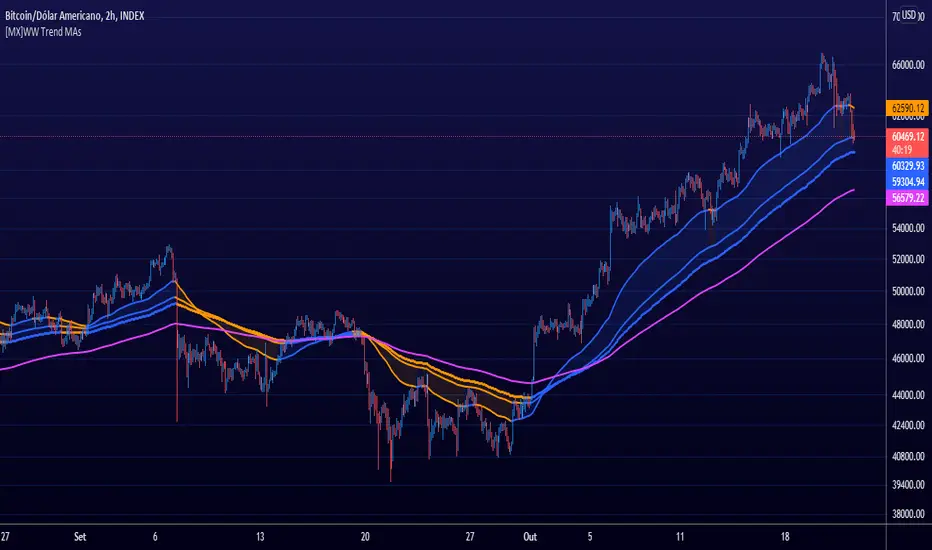
Welles Wilder MA [MX]The average of 34 periods I observe as a mobile S/R, but I usually observe it more when it is in strong trend, and the average of 72 and 89 as trend dictators, if the asset is above them = Bullish , below = Bearish , and the 144 average as the last moving S/R, and also as an S/R even stronger than all other MAs and when the asset loses that average, I see it as final confirmation of the other previous averages.
I give more importance to the average of 89 periods than to 72, because I see it as an extension to the average of 72, as if it were a trend range.
for those who prefer to observe the crossing of short and long averages as a way to see the trend, I also left this option, although I do not use
//////////////////////////////
A média de 34 periodos eu observo como um S/R móvel, mas eu costumo observar ela mais quando está em forte tendência, estando bem bearish ou jeffish, e a média de 72 e 89 como ditadoras de tendência, se o ativo está acima delas = Bullish , abaixo = Bearish , e a média de 144 como o último S/R móvel, e também como um S/R ainda mais forte que todas as outras MA's e quando o ativo perde essa média, eu vejo como confirmação final das outras médias anteriores.
Eu dou mais importância a média de 89 períodos do que a de 72, porque eu vejo ela como uma extensão a média de 72, como se fosse um range de tendência.
para quem prefere observar o cruzamento das médias curtas com as longas como forma de ver a tendência, eu deixei também essa opção, embora eu não use
Tilson T3 and MavilimW Triple Combined StrategyInspired by truly greatful Kivanç Ozbilgic (www.tradingview.com).
The strategy tries to combined three different moving average strategies into one.
Strategies covered are:
1. Tillson T3 Moving Average Strategy
Developed by Tim Tillson, the T3 Moving Average is considered superior to traditional moving averages as it is smoother, more responsive and thus performs better in ranging market conditions as well. However, it bears the disadvantage of overshooting the price as it attempts to realign itself to current market conditions.
It incorporates a smoothing technique which allows it to plot curves more gradual than ordinary moving averages and with a smaller lag. Its smoothness is derived from the fact that it is a weighted sum of a single EMA, double EMA, triple EMA and so on. When a trend is formed, the price action will stay above or below the trend during most of its progression and will hardly be touched by any swings. Thus, a confirmed penetration of the T3 MA and the lack of a following reversal often indicates the end of a trend. Here is what the calculation looks like:
T3 = c1*e6 + c2*e5 + c3*e4 + c4*e3, where:
– e1 = EMA (Close, Period)
– e2 = EMA (e1, Period)
– e3 = EMA (e2, Period)
– e4 = EMA (e3, Period)
– e5 = EMA (e4, Period)
– e6 = EMA (e5, Period)
– a is the volume factor, default value is 0.7 but 0.618 can also be used
– c1 = – a^3
– c2 = 3*a^2 + 3*a^3
– c3 = – 6*a^2 – 3*a – 3*a^3
– c4 = 1 + 3*a + a^3 + 3*a^2
T3 MovingThe T3 Moving Average generally produces entry signals similar to other moving averages and thus is traded largely in the same manner.
Strategy for Tillson T3 is if the close crossovers T3 line and for at least five bars the close was under the T3
2. Tillson T3 Fibonacci Cross
Kivanc Ozbilgic added a second T3 line with a volume factor of 0.618 (Fibonacci Ratio) and length of 3 (fibonacci number) which can be added by selecting the T3 Fibonacci Strategy input box.
Strategy for Tillson T3 Fibo is when the Fibo Line crossover the T3 it gives long signal vice versa.
3. MavilimW
MavilimW is originally a support and resistance indicator based on fibonacci injected weighted moving averages.
Strategy for MavilimW is is if the close crossovers T3 line and for at least five bars the close was under the T3
Hope you enjoy

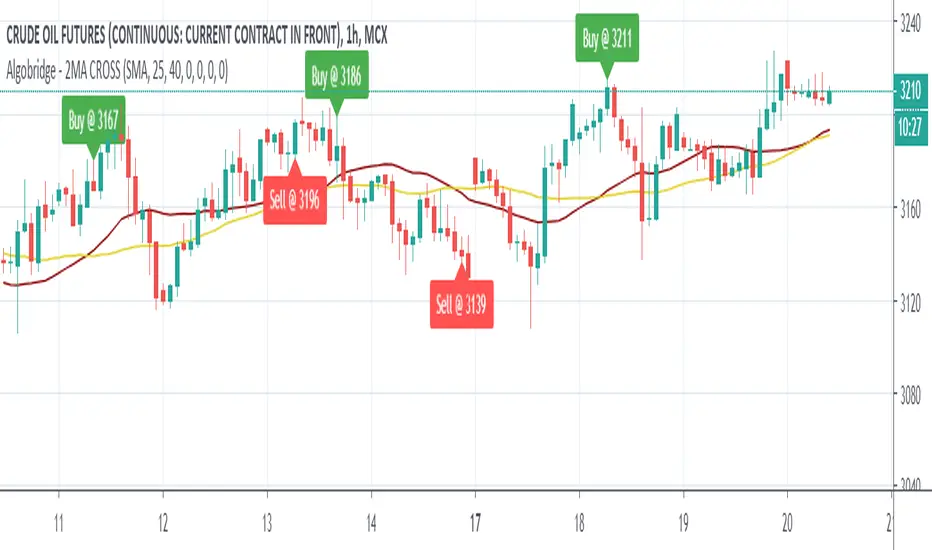
MA_CROSSOVER with SL & TPThis is the Moving Average Script Including the Stoploss and Target Levels. By Default it is working on 25 & 40 Parameters but it can change accordingly.
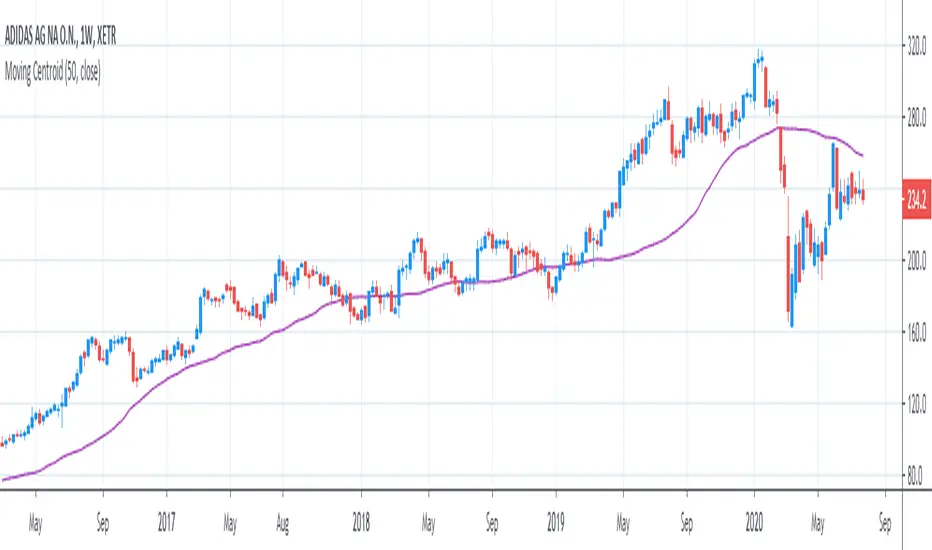
[R&D] Moving CentroidThis script utilizes this concept. Instead of weighting by volume, it weights by amount of price action on every close price of the rolling window. I assume it can be used as an additional reference point for price mode and price antimode.
it is directly connected with Market (not volume) profile, or TPO charts.
The algorithm:
1) takes a rolling window of, for example, 50 data points of close prices:
2) for each of this closing prices, the algorithm will check how many bars touched this close price.
3) then: sum of datapoints * weights/sum of weights
Since the logic is implemented in pretty non-efficient way, the script sometimes can take time to make calculations. Moreover, it calculates the centroid taking into account only close prices, not every tick. of a given rolling window That's why it's still experimental.
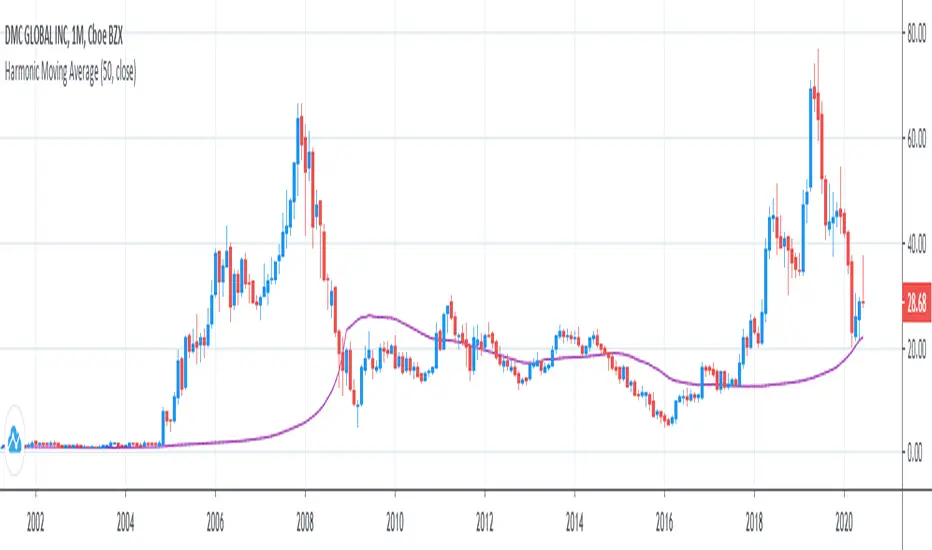
Harmonic MADsNo, it's not a new saturation plugin for your fruity loops.
...
These are Mean Average Deviations calculated from Harmonic Mean.
...
In my previous research I tried to develop "Harmonic Average Deviations", since applying stdevs on Harmonic Mean calculated from reciprocals ain't make sense. Din't work out, prolly cuz by definition stdevs doesn't like negatives. So in the end I ended up using Mean Average Deviations, and turned out it works great. Generally market data doesn't distribute normally, so t's a great tool, now weird kurtosis won't be a problem.

Harmonic Moving AverageI was legitimately surprised no1 has already coded it out on TradingView, but you guys can copypaste & include it in Pine 5 if your see this xd
Here is it.
I've checked and double checked everything, the calculations are right, it can be proved by plotting mean, geometric mean & harmonic mean together and noticing that geometric mean will be always between Harmonic mean, which is always below, and Mean, which is always above.
...
Other central tendency measures are also here as well for usability.
RAT Momentum Squeeze BETAV1.0
MAs are a great tool to measure the market's momentum. I created this indicator to graphically depict bullish and banishment movements with the moving averages.
Using the 50, 100, & 200 day MA in conjunction with the RSI we are able to find great swing setups. This is used best on the 30min & up to the daily chart.
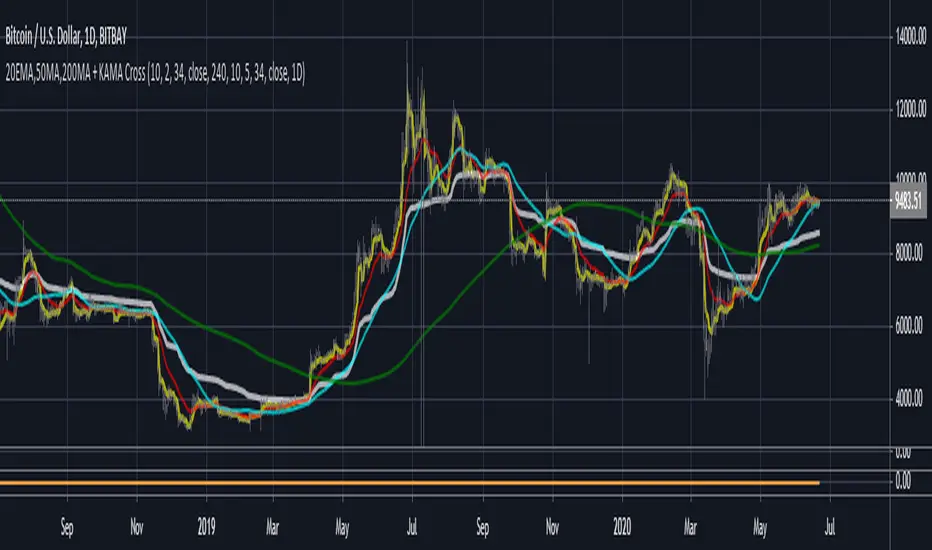
3MA'S + KAMA Trend (20EMA,50MA,200MA + KAMA Trend)This indicator, combines the traditional FOREX moving averages (20EMA, 50ma, 200ma) into a single indicator with
an adaptive moving average (AMA) taken from a user defined timeframe to show trend direction (by default, it plots
the daily 10/2/34 KAMA overlayed on any timeframe chart.
An AMA moves slowly when markets are sideways but swiftly during periods of volatility as a result it reacts much fast than
traditional options for moving average trends.
If the price is above the KAMA, trend is up. Below the KAMA, trend is down.
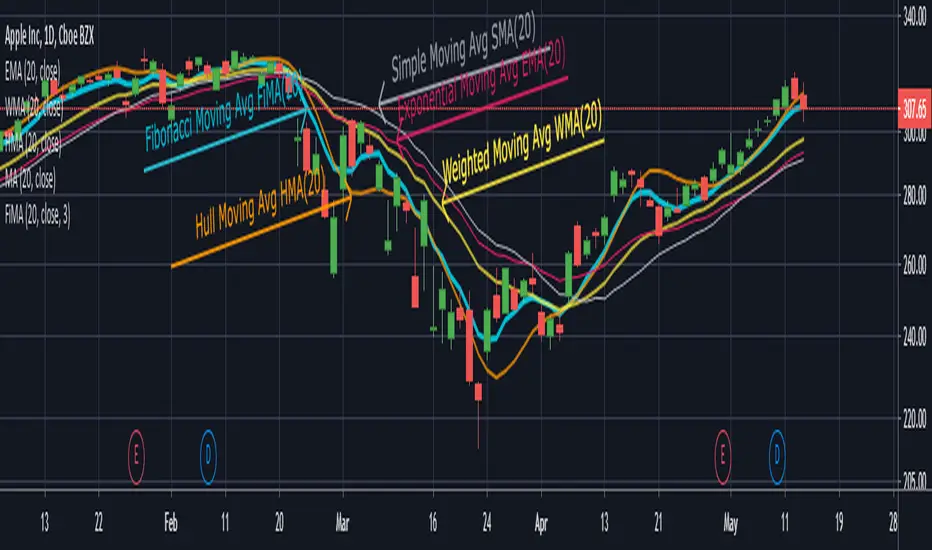
TA Basics: Creating a Fibonacci Weighted Moving AverageIn the previous 2 posts in this series, we played around with simple math concepts to create a zero-lag moving average that can deliver fast response and less lag - that we can use to enable better trend following, or as filter / signal.
here we take a step further - instead of using equal weight for the moving average (as in the Simple moving average) or linear weights (as in the weighted moving average), we get to pick THE MAGIC SEQUENCE, Fibonacci.
we will use the Fibonacci Sequence as weights to produce our moving average - so practically, we create a "Fibonacci Weighted Moving Average" (let's call it FiMA) - and compare the result with other commonly-used moving averages of the same length
in a Fibonacci moving average, the data will be weighted based on the Fibonacci Series starting from 1 (for the furthest data point)
so for example, if we use a length of 10, the weights will be 1, 1, 2, 3, 5, 8, 13, 21, 34, 55 with the 55 being the weight applied to the most recent / current bar's selected value (close, hl2, hc3..etc) and moving backward
before i posted this script, i searched around to see if someone else has already wrote this - i found a couple, but the approach we use here in this code is different - i can't claim it to be more efficient - i honestly don't know - but the resulting code here, IMHO, is more compact and easier to integrate in other studies that you may like to put together to leverage this idea, to create your own indicators and strategies.
the reason the code here is more compact, is that it utilizes a shorter formula to calculate the FIb(n) - i included the source where i found that formula, and i tested it before using it in the code.
i also added an optional "extra smoothing" for the resulting MA, by simply calling the fima() function a second time (so like doing a 2-pass filter), with a smaller length on the result of the 1st pass. keep this smoothing small not to produce too much lag.
i like the outcome when compared to other moving averages - it has a fast response to data/trend change and less overshoot - but honesty i didn't see any real "Fibonacci Magic" :) .. but i'll leave the final judgement to those who use it - this is more of an experimental code in all cases - please feel free to use, change and share feedback.
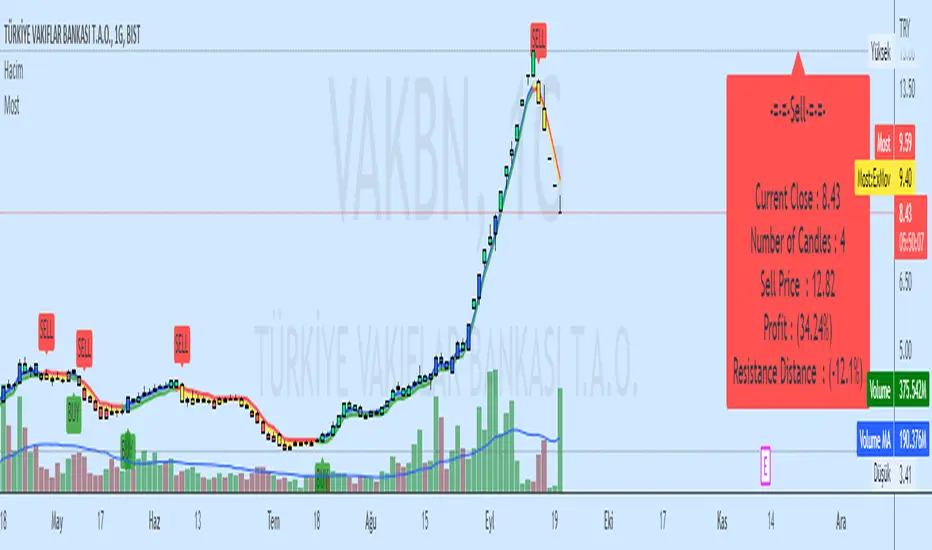
Moving Stop Loss (Most) by ceyhunATR is an indicator that has been removed and replaced with a moving average.Bar colors and infopanel have been added.
//Barcolor
Green = ExMov > Most and close > Most and low > Most
Blue = ExMov > Most and close > Most and low < Most
Red = Most > ExMov and close < Most and high < Most
Yellow = Most > ExMov and close < Most and high > Most
//It gives White color where there is deterioration.
//InfoPanel
Buy Price = Blue draws the circles at the purchase price.
Profit Long>20 = Risk level taken as a percentage, I got the highest 20%, you can determine as you wish.
Sell Price = Red draws the circles at the purchase price.
Profit Short>20 = Risk level taken as a percentage, I got the highest 20%, you can determine as you wish.
==Atr Original Code==
CDC ATR Trailing Stop V2.1 (2013)
==Most Code==
MOST by Anıl ÖZEKŞİ
Barcolor
Barcolor
Moving Average Compendium===========
Moving Average Compendium (16 MA Types)
===========
A selection of the most popular, widely used, interesting and most powerful Moving Averages we can think of. We've compiled 16 MA's into this script, and allowed full access to the source code so you can use what you need, as you need it.
-----------
From very simple moving averages using built-in functions, all the way through to Fractal Adaptive Averages, we've tried to cover as much as we can think of! BUT, if you would like to make a suggestion or recommendation to be added to this compendium of MA's please let us know! Together we can get a complete list of many dozens of types of Moving Average.
Full List (so far)
---
SMA - Simple Moving Average
EMA - Exponential Moving Average
WMA - Weighted Moving Average
VWMA - Volume Weighted Moving Average
DEMA - Double Exponential Moving Average
TEMA - Triple Exponential Moving Average
SMMA - Smoothed Moving Average
HMA - Hull Moving Average
ZLEMA - Zero-Lag Exponential Moving Average
KAMA - Kaufman Adaptive Moving Average
JMA - Jurik Moving Average
SWMA - Sine-Weighted Moving Average
TriMA - Triangular Moving Average
MedMA - Moving Median Average
GeoMA - Geometric Mean Moving Average
FRAMA - Fractal Adaptive Moving Average
Line color changes from green (upward) to red (downward) - some of the MA types will "linger" without moving up or down and when they are in this state they should appear gray in color.
Thanks to all involved -
Good Luck and Happy Trading!

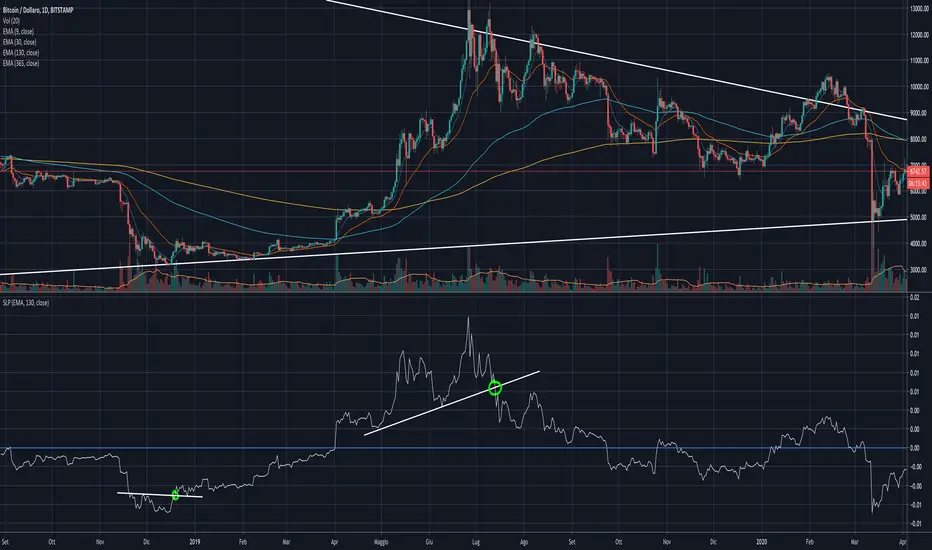
Moving Average SlopeA simple calculation and plotting of the slope of a Moving Average.
You'll be amazed looking at how accurate it is signaling early entries and exits from trend follower positions, just by applying some basic TA to it (support, resistance, trend lines).
Have a look:
In the settings, you can choose to use it on EMA on SMA, and the length of the MA involved.
I recommend using it on a medium-long sampling MA, to minimize noise.
Superstock 10-30 WMA Band script I was reading Jesse Stine's Insider Buy Superstocks book, and one of the technical traits he mentioned of a superstock (read the book, seriously, very strongly recommended) was a breakout above the 30 weekly moving average. He goes on to mention that after breakout, the 10 WMA often acts as a support line where you can add to your position. This script is inspired by the visual direction of Chris Moody's slingshot system, and how it displays MA's. The skinny line is the 10 WMA and the bigger line is the 30.

Multiple Timeframe Five Moving AveragesThis allows you to plot up to 5 moving averages on your chart at once. You can either use the chart's current timeframe or select a custom timeframe for your 5 moving averages (for example, you can see the 200DMA on your 4h chart without having to adjust the moving average length). You can also choose amongst SMA , EMA , and HULLMA for each MA.

Slow Heiken Ashi and Exponential Moving average Strategy 2.2Strategy using Slow Heiken Ashi by Glaz and Exponential moving averages. Looking for someone to help me turn the strategy into non-reoccuring alerts as I am having trouble doing so.