Volume towers by GSK-VIZAG-AP-INDIAVolume Towers by GSK-VIZAG-AP-INDIA
Overview :
This Pine Script visualizes volume activity and provides insights into market sentiment through the display of buying and selling volume, alongside moving averages. It highlights high and low volume candles, enabling traders to make informed decisions based on volume anomalies. The script is designed to identify key volume conditions, such as below-average volume, high-volume candles, and their relationship to price movement.
Script Details:
The script calculates a Simple Moving Average (SMA) of the volume over a user-defined period and categorizes volume into several states:
Below Average Volume: Volume is below the moving average.
High Volume: Volume exceeds the moving average by a multiplier (configurable by the user).
Low Volume: Volume that doesn’t qualify as either high or below average.
Additionally, the script distinguishes between buying volume (when the close is higher than the open) and selling volume (when the close is lower than the open). This categorization is color-coded for better visualization:
Green: Below average buying volume.
Red: Below average selling volume.
Blue: High-volume buying.
Purple: High-volume selling.
Black: Low volume.
The Volume Moving Average (SMA) is plotted as a reference line, helping users identify trends in volume over time.
Features & Customization:
Customizable Inputs:
Volume MA Length: The period for calculating the volume moving average (default is 20).
High Volume Multiplier: A multiplier for defining high volume conditions (default is 2.0).
Color-Coded Volume Histograms:
Different colors are used for buying and selling volume, as well as high and low-volume candles, for quick visual analysis.
Alerts:
Alerts can be set for the following conditions:
Below-average buying volume.
Below-average selling volume.
High-volume conditions.
How It Works:
Volume Moving Average (SMA) is calculated using the user-defined period (length), and it acts as the baseline for categorizing volume.
Volume Conditions:
Below Average Volume: Identifies candles with volume below the SMA.
High Volume: Identifies candles where volume exceeds the SMA by the set multiplier (highVolumeMultiplier).
Low Volume: When volume is neither high nor below average.
Buying and Selling Volume:
The script identifies buying and selling volume based on the closing price relative to the opening price:
Buying Volume: When the close is greater than the open.
Selling Volume: When the close is less than the open.
Volume histograms are then plotted using the respective colors for quick visualization of volume trends.
User Interface & Settings:
Inputs:
Volume MA Length: Adjust the period for the volume moving average.
High Volume Multiplier: Define the multiplier for high volume conditions.
Plots:
Buying Volume: Green bars indicate buying volume.
Selling Volume: Red bars indicate selling volume.
High Volume: Blue or purple bars for high-volume candles.
Low Volume: Black bars for low-volume candles.
Volume Moving Average Line: Displays the moving average line for reference.
Source Code / Authorship:
Author: prowelltraders
Disclaimer:
This script is intended for educational purposes only. While it visualizes important volume data, users are encouraged to perform their own research and testing before applying this script for trading decisions. No guarantees are made regarding the effectiveness of this script for real-world trading.
Contact & Support:
For questions, support, or feedback, please reach out to the author directly through TradingView (prowelltraders).
Signature:
GSK-VIZAG-AP-INDIA
Moving Averages

Price-Confirmed Hull Moving AverageThis is a modified HULL moving average that adds some enhancements providing visual clues as to a change in trend direction. The user can add slight modifications to the abruptness of trend change indications, which are clearly seen by the color change of the hull line itself. The user can also choose to have the background color change for easier visual indication that the hull line has changed slope direction. In addition, the user can either have both the line and the background visuals on, or turn one or the other (or both) off.
The purpose of this HULL moving average is to provide easy identification of trend direction within the scope of the moving average values provided in settings.

Fibonacci + TP/SL Strategy [Backtest]✅ Key Features Added and Adjusted:
Fibonacci Retracement Levels:
Automatically calculated based on the last 100 bars' high/low
Plotted levels: 0%, 23.6%, 38.2%, 50%, 61.8%, 78.6%, 100%
Extension targets: 161.8%, 261.8%, 423.6%
Buy/Sell Signal Logic:
Buy: Price is between 78.6% and 38.2% levels
Sell: Price is between 61.8% and 23.6% levels
Both depend on a can_trade time filter to avoid overtrading
ATR-based Stop-Loss:
Stop-loss dynamically adapts to market volatility:
SL = Entry - ATR * 1.5 (long)
SL = Entry + ATR * 1.5 (short)
Fixed Take-Profit:
Configurable via input: default is 4%
Can be changed in TradingView UI
Golden/Death Cross Indicator (Visual Only):
EMA 50 crossing EMA 200 plotted on chart:
Golden Cross = Buy signal (green triangle)
Death Cross = Sell signal (red triangle)
Weekly Profit Cap:
Prevents new trades if weekly profit exceeds 15%
Resets at the start of every week
Visual Elements:
All Fibonacci levels are plotted
Buy/Sell signals are labeled on the chart (BUY, SELL)

Weekly Moving Averages (MAs) to Intraday ChartThis indicator overlays key weekly timeframe moving averages onto your intraday chart, allowing you to visualize important long-term support and resistance levels while trading shorter timeframes. The indicator includes:
330-period Simple Moving Average (white): Ultra long-term trend indicator
200-period Simple Moving Average (fuchsia): Major long-term trend indicator often watched by institutional traders
100-period Simple Moving Average (purple): Medium-to-long term trend indicator
50-period Exponential Moving Average (blue): Medium-term trend indicator, more responsive to recent price action
21-period Exponential Moving Average (teal): Short-to-medium term trend indicator
9-period Exponential Moving Average (aqua): Short-term trend indicator, highly responsive to recent price movements
This multi-timeframe approach helps identify significant support/resistance zones that might not be visible on your current timeframe. When price interacts with these weekly moving averages during intraday trading, it often signals important areas where institutional orders may be placed.
The indicator uses color-coding with increasing line thickness to help you quickly distinguish between different moving averages. Consider areas where multiple MAs cluster together as particularly strong support/resistance zones.
Perfect for day traders and swing traders who want to maintain awareness of the bigger picture while focusing on shorter-term price action.

Hull Moving Average with Cloud📈 Hull Moving Average with Cloud – Adaptive Trend Visualization
This indicator combines the power of the Hull Moving Average (HMA) with a visual signal line and trend cloud, giving traders a clearer view of market direction, momentum shifts, and potential reversals.
🔍 Key Features:
Dynamic HMA Length (optional): Adjusts the HMA period based on ATR volatility, allowing the moving average to adapt to changing market conditions.
Custom Smoothing Options: Smooth the main HMA with your choice of SMA, EMA, or WMA for a tailored trend line.
Signal Line (Orange HMA): A shorter-period Hull MA that acts as a trigger line for crossovers and trend changes.
Color-Coded Trend Cloud:
🟩 Green Cloud: Bullish – main HMA is above the signal HMA.
🟥 Red Cloud: Bearish – main HMA is below the signal HMA.
Real-Time Trend Coloring: Both lines dynamically change color based on slope (green for rising, red/purple for falling).
Offset Capability: Shift the HMA forward to visualize trend development and potential future direction.
✅ Use Cases:
Identify trend direction with cloud coloration.
Spot early reversals through HMA crossover signals.
Filter trades with volatility-aware moving average responsiveness.

RSI-EMA-Crossing with Donchian-Stop-LossThe Donchian RSI Indicator is a visual tool that combines momentum and trend analysis to identify high-quality long opportunities based on RSI crossovers, price action, and Donchian channel dynamics.
How It Works
Momentum Signal: A bullish RSI crossover is detected when the RSI crosses above its moving average.
Trend Filter: A signal is only valid if the crossover occurs while the price is above its moving average – filtering out entries against the prevailing trend.
Signal Candle: The high of the crossover candle is stored.
Entry Trigger: A valid signal occurs when a later candle closes above that signal high.
Stop-Loss (Visual Only)
The lower band of the Donchian Channel acts as a visual reference for a dynamic stop-loss level.
Features
Customizable RSI, Donchian Channel, and moving average lengths
Selectable MA types: SMA, EMA, WMA, VWMA, HMA
Signal candle highlighted (yellow background)
Entry points labeled on the chart
Price MA and Donchian Channel plotted
Trend filter improves signal quality by confirming upward bias
Use Case
Designed for swing and position traders
Optimized for use on daily or 4H charts

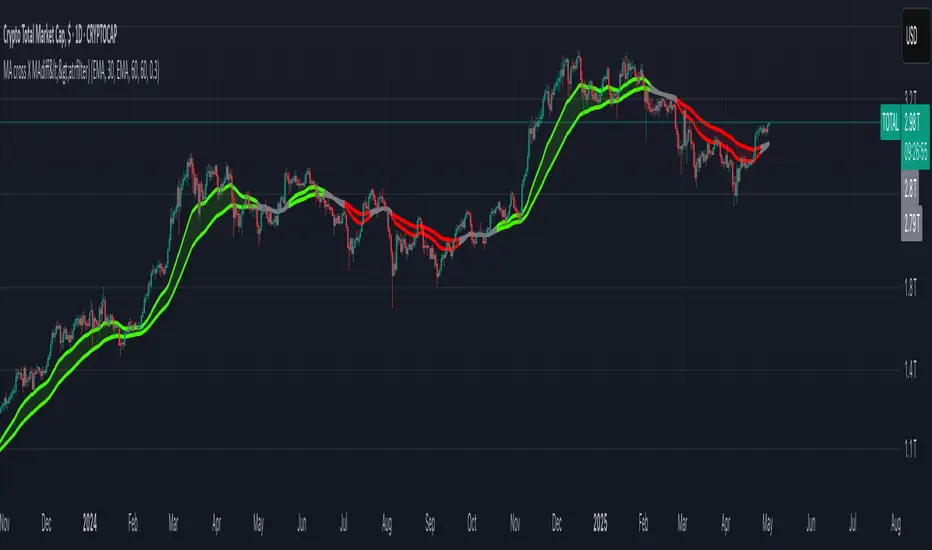
MA cross X MAdiff<>atrfilter)📈 MA cross X MAdiff<>ATR filter
Smarter Trend Confirmation Using Adaptive Volatility Thresholds
🔍 What It Does
This indicator upgrades classic moving average crossovers by adding volatility awareness via ATR filtering. Instead of reacting to every small crossover, it waits for the distance between two moving averages to exceed a volatility-adjusted threshold, making signals more meaningful and less noisy.
⚙️ Core Logic
Calculates the difference between a Fast MA and a Slow MA.
Uses Average True Range (ATR) as a dynamic volatility filter.
Confirms trend only when MA difference exceeds:
diff > ATR × multiplier → Bullish
diff < -ATR × multiplier → Bearish
Otherwise: Neutral (gray zone)
The gray zone avoids false signals by detecting indecision or choppy markets.
🧠 Customizable Inputs
Choose any MA type independently for Fast and Slow:
SMA, EMA, WMA, VWMA, RMA, DEMA, TEMA, LSMA, Kijun
Control sensitivity via:
ATR Length
ATR Multiplier
✅ Why It Works
Reduces fake outs in ranging markets.
Adapts to volatility automatically.
Fully customizable for any asset or style.
Ideal for trend traders, momentum entries, or as a confluence layer.
EMA/SMA Combo + ADR (v6)This script combines popular moving averages with a clean, info-rich ADR table – perfect for traders who trade breakouts.
✳️ Features:
• 🟦 EMA 10 / 20 / 50 / 100 / 200 → shown as dotted points
• 🔷 SMA 10 / 20 / 50 / 100 / 200 → shown as solid lines
• 🎛️ All lines can be individually toggled on/off
• 📊 ADR info table shows average range, today’s range & % of ADR
🎯 Ideal for:
• Intraday traders looking for clean MAs & volatility reference
• Swing traders seeking strong confluence zones
• Anyone who prefers a minimalistic, customizable overlay
🧠 Pro Tip: The ADR table is styled for light charts – black text, no background. You can customize the MA display exactly as you like.
Trade smart, stay sharp! 🚀

30-70 RSI Strategy with Colored BarThis script colors price bars based on Relative Strength Index (RSI) levels, giving traders a quick and visual way to assess overbought or oversold market conditions directly on the chart.
📈 Key Features:
✅ RSI-Based Bar Coloring:
Green bars when RSI is above the upper threshold (default 70) – suggests bullish momentum.
Red bars when RSI is below the lower threshold (default 30) – indicates bearish pressure.
Bars remain uncolored when RSI is between thresholds – a neutral zone.
🔧 Customizable RSI Settings:
Adjustable RSI length (default: 14 periods)
Adjustable overbought/oversold levels (default: 70/30)
🧠 Helps traders:
Quickly spot potential reversals or trend continuations
Visually align price action with momentum
🛠️ Usage:
Ideal for trend-following, reversal, and momentum strategies.
Works across any timeframe (1m, 5m, 1h, daily, etc.).

Z-Score Trend Monitor [EdgeTerminal]The Z-Score Trend Monitor measures how far the short-term moving average deviates from the long-term moving average using the spread difference of the two — in standardized units. It’s designed to detect overextension, momentum exhaustion, and potential mean-reversion points by converting the spread between two moving averages into a normalized Z-score and tracking its change and direction over time.
The idea behind this is to catch the changes in the direction of a trend earlier than the usual and lagging moving average lines, allowing you to react faster.
The math behind the indicator itself is very simple. We take the simple moving average of the spread between a long term and short term moving average, and divide it by the difference between the spread and spread mean.
This results in a relatively accurate and early acting trend detector that can easily identify overbought and oversold levels in any timeframe. From our own testing, we recommend using this indicator as a trend confirmation tool.
How to Use It:
Keep an eye on the Z-Score or the blue line. When it goes over 2, it indicates an overbought or near top level, and when it goes below -2, it indicates an oversold or near bottom.
When Z-Score returns to zero or grey line, it suggests mean reversion is in progress.
You can also change the Z-Score criteria from 2 and -2 in the settings to any number you’d like for tighter or wider levels.
For scalping and fast trading setups, we recommend shorter SMAs, such as 5 and 20, and for longer trading setups such as swing trades, we recommend 20 and 100.
Settings:
Short SMA: Lookback period of short term simple moving average for the lower side of the SMA spread.
Short Term Weight: Additional weight or multiplier to suppress the short term SMA calculation. This is used to refine the SMA calculation for more granular and edge cases when needed, usually left at 1, meaning it will take the entire given value in the short SMA field.
Long SMA: Lookback period of long term simple moving average for the upper side of the SMA spread.
Long Term Weight: Additional weight or multiplier to suppress the long term SMA calculation. This is used to refine the long SMA calculation for more granular and edge cases when needed, usually left at 1, meaning it will take the entire given value in the long SMA field.
Z-Score Threshold: The threshold for upper (oversold) and lower (overbought) levels. This can also be set individually from the style page.
Z-Score Lookback Window: The lookback period to calculate spread mean and spread standard deviation

C&B Auto MK5C&B Auto MK5.2ema BullBear
Overview
The C&B Auto MK5.2ema BullBear is a versatile Pine Script indicator designed to help traders identify bullish and bearish market conditions across various timeframes. It combines Exponential Moving Averages (EMAs), Relative Strength Index (RSI), Average True Range (ATR), and customizable time filters to generate actionable signals. The indicator overlays on the price chart, displaying EMAs, a dynamic cloud, scaled RSI levels, bull/bear signals, and market condition labels, making it suitable for swing trading, day trading, or scalping in trending or volatile markets.
What It Does
This indicator generates bull and bear signals based on the interaction of two EMAs, filtered by RSI thresholds, ATR-based volatility, a 50/200 EMA trend filter, and user-defined time windows. It adapts to market volatility by adjusting EMA lengths and RSI thresholds. A dynamic cloud highlights trend direction or neutral zones, with candlestick coloring in neutral conditions. Market condition labels (current and historical) provide real-time trend and volatility context, displayed above the chart.
How It Works
The indicator uses the following components:
EMAs: Two EMAs (short and long) are calculated on a user-selected timeframe (1, 5, 15, 30, or 60 minutes). Their crossover or crossunder triggers potential bull/bear signals. EMA lengths adjust based on volatility (e.g., 10/20 for volatile markets, 5/10 for non-volatile).
Dynamic Cloud: The area between the EMAs forms a cloud, colored green for bullish trends, red for bearish trends, or a user-defined color (default yellow) for neutral zones (when EMAs are close, determined by an ATR-based threshold). Users can widen the cloud for visibility.
RSI Filter: RSI is scaled to price levels and plotted on the chart (optional). Signals are filtered to ensure RSI is within volatility-adjusted bull/bear thresholds and not in overbought/oversold zones.
ATR Volatility Filter: An optional filter ensures signals occur during sufficient volatility (ATR(14) > SMA(ATR, 20)).
50/200 EMA Trend Filter: An optional filter restricts bull signals to bullish trends (50 EMA > 200 EMA) and bear signals to bearish trends (50 EMA < 200 EMA).
Time Filter: Signals are restricted to a user-defined UTC time window (default 9:00–15:00), aligning with active trading sessions.
Market Condition Labels: Labels above the chart display the current trend (Bullish, Bearish, Neutral) and optionally volatility (e.g., “Bullish Volatile”). Up to two historical labels persist for a user-defined number of bars (default 5) to show recent trend changes.
Visual Aids: Bull signals appear as green triangles/labels below the bar, bear signals as red triangles/labels above. Candlesticks in neutral zones are colored (default yellow).
The indicator ensures compatibility with standard chart types (e.g., candlestick or bar charts) to produce realistic signals, avoiding non-standard types like Heikin Ashi or Renko.
How to Use It
Add to Chart: Apply the indicator to a candlestick or bar chart on TradingView.
Configure Settings:
Timeframe: Choose a timeframe (1, 5, 15, 30, or 60 minutes) to match your trading style.
Filters:
Enable/disable the ATR volatility filter to focus on high-volatility periods.
Enable/disable the 50/200 EMA trend filter to align signals with the broader trend.
Enable the time filter and set custom UTC hours/minutes (default 9:00–15:00).
Cloud Settings: Adjust the cloud width, neutral zone threshold, color, and transparency.
EMA Colors: Use default trend-based colors or set custom colors for short/long EMAs.
RSI Display: Toggle the scaled RSI and its thresholds, with customizable colors.
Signal Settings: Toggle bull/bear labels and set signal colors.
Market Condition Labels: Toggle current/historical labels, include/exclude volatility, and adjust decay period.
Interpret Signals:
Bull Signal: A green triangle or “Bull” label below the bar indicates potential bullish momentum (EMA crossover, RSI above bull threshold, within time window, passing filters).
Bear Signal: A red triangle or “Bear” label above the bar indicates potential bearish momentum (EMA crossunder, RSI below bear threshold, within time window, passing filters).
Neutral Zone: Yellow candlesticks and cloud (if enabled) suggest a lack of clear trend; consider range-bound strategies or avoid trading.
Market Condition Labels: Check labels above the chart for real-time trend (Bullish, Bearish, Neutral) and volatility status to confirm market context.
Monitor Context: Use the cloud, RSI, and labels to assess trend strength and volatility before acting on signals.
Unique Features
Volatility-Adaptive EMAs: Automatically adjusts EMA lengths based on ATR to suit volatile or non-volatile markets, reducing manual configuration.
Neutral Zone Detection: Uses an ATR-based threshold to identify low-trend periods, helping traders avoid choppy markets.
Scaled RSI Visualization: Plots RSI and thresholds directly on the price chart, simplifying momentum analysis relative to price.
Flexible Time Filtering: Supports precise UTC-based trading windows, ideal for day traders targeting specific sessions.
Historical Market Labels: Displays recent trend changes (up to two) with a decay period, providing context for market shifts.
50/200 EMA Trend Filter: Aligns signals with the broader market trend, enhancing signal reliability.
Notes
Use on standard candlestick or bar charts to ensure accurate signals.
Test the indicator on a demo account to optimize settings for your market and timeframe.
Combine with other analysis (e.g., support/resistance, volume) for better decision-making.
The indicator is not a standalone system; use it as part of a broader trading strategy.
Limitations
Signals may lag in fast-moving markets due to EMA-based calculations.
Neutral zone detection may vary in extremely volatile or illiquid markets.
Time filters are UTC-based; ensure your platform’s timezone settings align.
This indicator is designed for traders seeking a customizable, trend-following tool that adapts to volatility and provides clear visual cues with robust filtering for bullish and bearish market conditions.

MTF VEGASThe MTF Tunnel Vegas indicator is a multi-timeframe (MTF) technical analysis tool designed to help traders identify trends and key price zones. It is based on the Vegas Tunnel system, which uses three key exponential moving averages (EMAs) — the 144, 169, and 233-period EMAs — to create a dynamic tunnel or channel on the price chart.
The purpose of this tunnel is to highlight zones where price may react, either as support/resistance or as breakout levels. When price approaches, bounces off, or crosses the tunnel, it can signal potential trading opportunities, whether for continuation or reversal setups.
The MTF component means that the indicator overlays the tunnel from a higher timeframe directly onto the current chart, giving traders a clear view of the larger trend context without needing to switch between multiple charts. This allows for better alignment of short-term decisions with long-term trend dynamics.
Key features:
✅ Plots 144, 169, and 233-period EMA tunnels from higher timeframes
✅ Highlights dynamic zones of support and resistance
✅ Helps traders stay aligned with the dominant trend
✅ Reduces chart noise and improves trade filtering

6 Dynamic EMAs by Koenigsegg🚀 6 Dynamic EMAs by Koenigsegg
Take control of your chart with ultimate flexibility. This tool gives you 6 customizable EMAs across any timeframe, helping you read the market like a pro — whether you're scalping seconds or swinging days. Built for precision, designed for dominance.
The combinations? Endless. Mix and match any EMA lengths and timeframes for tailored confluence — exactly how elite traders operate.
🔑 Key Features
✅ 6 Fully Customizable EMAs
⏳ Multi-Timeframe Support (from seconds to months)
🎨 Custom Colors & Thickness for each EMA
🚨 Built-in Cross Alerts for instant trade signals
🧠 Clean, efficient logic using request.security()
🔁 Dynamically toggle EMAs on/off
⚙️ Lightweight for smooth chart performance
🧩 Endless combo potential — confluence on your terms
📈 What Is an EMA?
The EMA is a type of moving average that adjusts more quickly to recent price changes than a Simple Moving Average (SMA). It does this by giving exponentially more weight to the most recent candles.
⚙️ How Does It Function?
Smoothing Price Data:
It takes the average of closing prices over a chosen period (like 20 or 50 candles), but gives more influence to the latest prices.
Reacts Quickly to Price Shifts:
Since recent data is weighted more heavily, the EMA adjusts faster to sudden price changes — helping you spot trend reversals or momentum shifts earlier.
Dynamic Support & Resistance:
Traders often use EMAs as moving support/resistance levels. Price often "respects" EMAs in trending markets — bouncing off them during pullbacks.
Trend Confirmation:
- If price is above the EMA, the market is likely in an uptrend.
- If price is below the EMA, the market is likely in a downtrend.
- Multiple EMAs (like 12/21 or 50/200) crossing each other are used for entry/exit signals.
💡 Example:
If you use a 21 EMA on a chart, it shows you the average price of the last 21 candles, but the most recent ones weigh heavier. This makes the EMA more responsive than an SMA, and better for short-term or active trading.
📊 Why EMAs Matter — and How Multi-Timeframe EMAs Give You the Edge
Exponential Moving Averages (EMAs) are essential tools for identifying trend direction, momentum shifts, and dynamic support/resistance. Because they weight recent price data more heavily, EMAs adapt quickly to changing market conditions, giving traders early insight into reversals or continuations.
Where this script shines is in its multi-timeframe (MTF) capability. For example, plotting a daily EMA on a 4H chart gives you high-level directional guidance while still allowing precision entries. This enables confluence between LTF (low timeframe) signals and HTF (high timeframe) momentum — a crucial edge used by institutional-level traders.
You can configure the tool to run classic combos like the 12/21 crossover on your current chart, while layering in a 50 or 200 EMA from a higher timeframe for macro confirmation. The 6th EMA, colored light blue by default, is perfect for adding one final level of structure insight — often used as a long-term anchor or trend bias marker.
Whether you're riding the wave or catching the reversal, these EMAs serve as your adaptable compass in every environment.
🎯 Purpose
This indicator was built to give traders a clear, responsive, and multi-timeframe edge using dynamic Exponential Moving Averages. Whether you're trend-following, identifying momentum shifts, or building a confluence system — these 6 EMAs are here to align with your strategy and style.
💡 Pro Tip
Instead of cluttering your chart with multiple EMA indicators, this script consolidates all into one sleek tool. You can toggle off bands you don't currently need, like running only the 12/21 EMAs on your active chart timeframe, while adding the 12/21 EMAs from a higher timeframe to guide trade decisions.
With this setup, you're not just reacting — you're orchestrating your trades with intention.
⚠️ Disclaimer
This script is for educational and informational purposes only. It does not constitute financial advice. Always do your own research and trade responsibly. Past performance does not guarantee future results.

Multi-Symbol Trend DashboardMulti-Symbol Trend Dashboard - MA Cross Trend Monitor
Short Description
A customizable dashboard that displays trend direction across multiple symbols and timeframes using moving average crossovers.
Full Description
Overview
This Multi-Symbol Trend Dashboard allows you to monitor trend direction across 7 different symbols and 5 timeframes simultaneously in a single view. The dashboard uses moving average crossovers to determine trend direction, displaying bullish trends in green and bearish trends in red.
Key Features
Multi-Symbol Monitoring : Track up to 7 different trading instruments at once
Multi-Timeframe Analysis: View 5 different timeframes simultaneously for each instrument
Customizable Moving Averages: Choose between SMA, EMA, or WMA with adjustable periods
Visual Clarity: Color-coded cells provide immediate trend identification
Flexible Positioning: Place the dashboard anywhere on your chart
Customizable Appearance: Adjust sizes, colors, and text formatting
How It Works
The dashboard calculates a fast MA and slow MA for each symbol-timeframe combination. When the fast MA is above the slow MA, the cell shows green (bullish). When the fast MA is below the slow MA, the cell shows red (bearish).
Use Cases
Get a bird's-eye view of market trends across multiple instruments
Identify potential trading opportunities where multiple timeframes align
Monitor your watchlist without switching between charts
Spot divergences between related instruments
Track market breadth across sectors or related instruments
Notes and Limitations
Limited to 7 symbols and 5 timeframes due to TradingView's security request limits
Uses simple MA crossover as trend determination method
Dashboard is most effective when displayed on a dedicated chart
Performance may vary on lower-end devices due to multiple security requests
Settings Explanation
MA Settings: Configure the periods and types of moving averages
Display Settings: Adjust dashboard positioning and visual elements
Trading Instruments: Select which symbols to monitor (defaults to major forex pairs)
Timeframes: Choose which timeframes to display (default: M15, H1, H4, D1, W1)
Colors: Customize the color scheme for bullish/bearish indications and headers
This dashboard provides a straightforward way to maintain situational awareness across multiple markets and timeframes, helping traders identify potential setups and market conditions at a glance.

MTF PO (3TF)Title: SmartMA Multi-Timeframe Signal Strategy
Description (English):
This indicator provides buy/sell signals based on a multi-timeframe adaptive moving average. It allows traders to align short-term entries with higher time-frame trends. The script integrates a trend-following logic that reacts to price crossovers and adaptive MA slope, helping traders reduce noise and improve entry precision.
概要(日本語)
このインジケーターは、複数時間足の適応型移動平均線(SmartMA)を用いて売買シグナルを生成します。下位足でのエントリーが、上位足のトレンドと一致するよう設計されており、ノイズの除去とトレード精度の向上に貢献します。価格のクロスとMAの傾きを用いたトレンドフォロー型ロジックを搭載しています。
特徴
上位時間足の移動平均(SmartMA)と価格のクロスを検出
傾きフィルターによるトレンド整合性チェック
上位足に合わせて下位足のシグナルを制限
チャート上にシンプルなBuy/Sellラベルを表示
EMA, SMA, RMAなどのカスタム選択が可能
使用方法
チャートにインジケーターを追加し、上位足(例:1時間)と現在の時間足(例:5分)を設定
トレンド方向に沿ったタイミングでエントリーを検討
複数フィルターを用いることで、レンジ相場での誤認識を回避可能
注意事項
本インジケーターは補助的な分析ツールです。過去のパフォーマンスが将来を保証するものではありません。
スクリプトは再描画しない設計ですが、時間足の切り替え等で見た目が変わる可能性があります。
戦略構築には他のリスク管理指標との併用を推奨します。
PowerHouse SwiftEdge AI v2.10 StrategyOverview
The PowerHouse SwiftEdge AI v2.10 Strategy is a sophisticated trading system designed to identify high-probability trade setups in forex, stocks, and cryptocurrencies. By combining multi-timeframe trend analysis, momentum signals, volume confirmation, and smart money concepts (Change of Character and Break of Structure ), this strategy offers traders a robust tool to capitalize on market trends while minimizing false signals. The strategy’s unique “AI” component analyzes trends across multiple timeframes to provide a clear, actionable dashboard, making it accessible for both novice and experienced traders. The strategy is fully customizable, allowing users to tailor its filters to their trading style.
What It Does
This strategy generates Buy and Sell signals based on a confluence of technical indicators and smart money concepts. It uses:
Multi-Timeframe Trend Analysis: Confirms the market’s direction by analyzing trends on the 1-hour (60M), 4-hour (240M), and daily (D) timeframes.
Momentum Filter: Ensures trades align with strong price movements to avoid choppy markets.
Volume Filter: Validates signals with above-average volume to confirm market participation.
Breakout Filter: Requires price to break key levels for added confirmation.
Smart Money Signals (CHoCH/BOS): Identifies reversals (CHoCH) and trend continuations (BOS) based on pivot points.
AI Trend Dashboard: Summarizes trend strength, confidence, and predictions across timeframes, helping traders make informed decisions without needing to analyze complex data manually.
The strategy also plots dynamic support and resistance trendlines, take-profit (TP) levels, and “Get Ready” signals to alert users of potential setups before they fully develop. Trades are executed with predefined take-profit and stop-loss levels for disciplined risk management.
How It Works
The strategy integrates multiple components to create a cohesive trading system:
Multi-Timeframe Trend Analysis:
The strategy evaluates trends on three timeframes (1H, 4H, Daily) using Exponential Moving Averages (EMA) and Volume-Weighted Average Price (VWAP). A trend is considered bullish if the price is above both the EMA and VWAP, bearish if below, or neutral otherwise.
Signals are only generated when the trend on the user-selected higher timeframe aligns with the trade direction (e.g., Buy signals require a bullish higher timeframe trend). This reduces noise and ensures trades follow the broader market context.
Momentum Filter:
Measures the percentage price change between consecutive bars and compares it to a volatility-adjusted threshold (based on the Average True Range ). This ensures trades are taken only during significant price movements, filtering out low-momentum conditions.
Volume Filter (Optional):
Checks if the current volume exceeds a long-term average and shows positive short-term volume change. This confirms strong market participation, reducing the risk of false breakouts.
Breakout Filter (Optional):
Requires the price to break above (for Buy) or below (for Sell) recent highs/lows, ensuring the signal aligns with a structural shift in the market.
Smart Money Concepts (CHoCH/BOS):
Change of Character (CHoCH): Detects potential reversals when the price crosses under a recent pivot high (for Sell) or over a recent pivot low (for Buy) with a bearish or bullish candle, respectively.
Break of Structure (BOS): Confirms trend continuations when the price breaks below a recent pivot low (for Sell) or above a recent pivot high (for Buy) with strong momentum.
These signals are plotted as horizontal lines with labels, making it easy to visualize key levels.
AI Trend Dashboard:
Combines trend direction, momentum, and volatility (ATR) across timeframes to calculate a trend score. Scores above 0.5 indicate an “Up” trend, below -0.5 indicate a “Down” trend, and otherwise “Neutral.”
Displays a table summarizing trend strength (as a percentage), AI confidence (based on trend alignment), and Cumulative Volume Delta (CVD) for market context.
A second table (optional) shows trend predictions for 1H, 4H, and Daily timeframes, helping traders anticipate future market direction.
Dynamic Trendlines:
Plots support and resistance lines based on recent swing lows and highs within user-defined periods (shortTrendPeriod, longTrendPeriod). These lines adapt to market conditions and are colored based on trend strength.
Why This Combination?
The PowerHouse SwiftEdge AI v2.10 Strategy is original because it seamlessly integrates traditional technical analysis (EMA, VWAP, ATR, volume) with smart money concepts (CHoCH, BOS) and a proprietary AI-driven trend analysis. Unlike standalone indicators, this strategy:
Reduces False Signals: By requiring confluence across trend, momentum, volume, and breakout filters, it minimizes trades in choppy or low-conviction markets.
Adapts to Market Context: The ATR-based momentum threshold adjusts dynamically to volatility, ensuring signals remain relevant in both trending and ranging markets.
Simplifies Decision-Making: The AI dashboard distills complex multi-timeframe data into a user-friendly table, eliminating the need for manual analysis.
Leverages Smart Money: CHoCH and BOS signals capture institutional price action patterns, giving traders an edge in identifying reversals and continuations.
The combination of these components creates a balanced system that aligns short-term trade entries with longer-term market trends, offering a unique blend of precision, adaptability, and clarity.
How to Use
Add to Chart:
Apply the strategy to your TradingView chart on a liquid symbol (e.g., EURUSD, BTCUSD, AAPL) with a timeframe of 60 minutes or lower (e.g., 15M, 60M).
Configure Inputs:
Pivot Length: Adjust the number of bars (default: 5) to detect pivot highs/lows for CHoCH/BOS signals. Higher values reduce noise but may delay signals.
Momentum Threshold: Set the base percentage (default: 0.01%) for momentum confirmation. Increase for stricter signals.
Take Profit/Stop Loss: Define TP and SL in points (default: 10 each) for risk management.
Higher/Lower Timeframe: Choose timeframes (60M, 240M, D) for trend filtering. Ensure the chart timeframe is lower than or equal to the higher timeframe.
Filters: Enable/disable momentum, volume, or breakout filters to suit your trading style.
Trend Periods: Set shortTrendPeriod (default: 30) and longTrendPeriod (default: 100) for trendline plotting. Keep below 2000 to avoid buffer errors.
AI Dashboard: Toggle Enable AI Market Analysis to show/hide the prediction table and adjust its position.
Interpret Signals:
Buy/Sell Labels: Green "Buy" or red "Sell" labels indicate trade entries with predefined TP/SL levels plotted.
Get Ready Signals: Yellow "Get Ready BUY" or orange "Get Ready SELL" labels warn of potential setups.
CHoCH/BOS Lines: Aqua (CHoCH Sell), lime (CHoCH Buy), fuchsia (BOS Sell), or teal (BOS Buy) lines mark key levels.
Trendlines: Green/lime (support) or fuchsia/purple (resistance) dashed lines show dynamic support/resistance.
AI Dashboard: Check the top-right table for trend strength, confidence, and CVD. The optional bottom table shows trend predictions (Up, Down, Neutral).
Backtest and Trade:
Use TradingView’s Strategy Tester to evaluate performance. Adjust TP/SL and filters based on results.
Trade manually based on signals or automate with TradingView alerts (set alerts for Buy/Sell labels).
Originality and Value
The PowerHouse SwiftEdge AI v2.10 Strategy stands out by combining multi-timeframe analysis, smart money concepts, and an AI-driven dashboard into a single, user-friendly system. Its adaptive momentum threshold, robust filtering, and clear visualizations empower traders to make confident decisions without needing advanced technical knowledge. Whether you’re a day trader or swing trader, this strategy provides a versatile, data-driven approach to navigating dynamic markets.
Important Notes:
Risk Management: Always use appropriate position sizing and risk management, as the strategy’s TP/SL levels are customizable.
Symbol Compatibility: Test on liquid symbols with sufficient historical data (at least 2000 bars) to avoid buffer errors.
Performance: Backtest thoroughly to optimize settings for your market and timeframe.

Multi-Timeframe EMAs with Cross Alerts (Up & Down)📌 Indicator Name:
Multi-Timeframe EMAs with Cross Alerts (Up & Down)
🛠️ Core Features:
✅ 1. Multi-Timeframe EMA Display
The script calculates and displays 6 different Exponential Moving Averages (EMAs).
Each EMA has:
Custom length input (e.g., 9, 21, etc.).
Custom timeframe selection (e.g., 1H, 4H, 1D).
Custom color for easy identification on the chart.
✅ 2. EMA Visualization
Each of the six EMAs is plotted on the chart using the selected color and thickness.
They respond dynamically to different timeframes (current or higher/lower).
✅ 3. Cross Detection Logic
The script can detect crossover and crossunder between EMA pairs:
EMA 1 and EMA 2
EMA 3 and EMA 4
EMA 5 and EMA 6
(Optional: can be extended to other combinations.)
✅ 4. Alert Toggles
Users can enable or disable alerts for each pair independently:
Alert: EMA 1 crosses EMA 2
Alert: EMA 3 crosses EMA 4
Alert: EMA 5 crosses EMA 6
(You added an additional option for EMA 4 vs EMA 6 later.)
✅ 5. Visual Alert Markers
The script uses alert() function to send alert messages when:
An EMA crosses above another (crossover)
An EMA crosses below another (crossunder)
Alerts include clear icons like 🔼 and 🔽 in the messages.
🔔 Use Case Scenarios
Swing traders: Identify longer-term cross signals on higher timeframes.
Scalpers: Use lower-timeframe EMAs with fast alert reactions.
Multi-timeframe analysis: Spot alignment between trend-following EMAs across different periods.
✅ Bonus
Fully customizable — great for adapting to your own strategy, whether it's trend confirmation, re-entry signals, or early reversals
📌 اسم المؤشر:
المتوسطات المتحركة الأسية (EMA) متعددة الفريمات مع تنبيهات تقاطع صاعدة وهابطة
🛠️ الميزات الأساسية:
✅ 1. دعم متعدد للفريمات الزمنية
يقوم السكربت بحساب وعرض 6 متوسطات متحركة أسية (EMA) مختلفة.
يمكن تخصيص كل EMA من حيث:
الطول (مثل: 9، 21...).
الفريم الزمني (مثل: الساعة، الأربع ساعات، اليومي...).
اللون، لتسهيل التمييز بين الخطوط على الشارت.
✅ 2. عرض المتوسطات على الرسم البياني
يتم رسم كل من المتوسطات الستة باستخدام اللون والتنسيق الذي تختاره.
المتوسطات تتفاعل تلقائيًا مع التغييرات في الفريم الزمني.
✅ 3. كشف التقاطعات
يمكن للسكربت كشف تقاطعات (صعودًا أو هبوطًا) بين أزواج المتوسطات التالية:
EMA 1 و EMA 2
EMA 3 و EMA 4
EMA 5 و EMA 6
(ويمكنك إضافة المزيد مثل EMA 4 مع EMA 6 حسب الحاجة)
✅ 4. التحكم في التنبيهات
يمكن للمستخدم تفعيل أو تعطيل التنبيهات لكل زوج من المتوسطات على حدة:
تنبيه عند تقاطع EMA 1 و EMA 2
تنبيه عند تقاطع EMA 3 و EMA 4
تنبيه عند تقاطع EMA 5 و EMA 6
(وأي أزواج إضافية يتم إضافتها لاحقًا)
✅ 5. تنبيهات مرئية برسائل واضحة
السكربت يرسل تنبيهات عبر وظيفة alert() عند حدوث:
تقاطع صاعد (EMA يتقاطع من الأسفل إلى الأعلى).
تقاطع هابط (EMA يتقاطع من الأعلى إلى الأسفل).
التنبيه يحتوي على رموز توضيحية مثل 🔼 و 🔽 ليسهل قراءته.
🎯 مناسب لـ:
المتداولين المتأرجحين (Swing Traders): لاكتشاف تقاطعات على الفريمات الكبرى.
المضاربين (Scalpers): باستخدام EMA سريعة على فريمات صغيرة مع تنبيهات فورية.
محللي الفريمات المتعددة: لتأكيد الاتجاه أو الانعكاس بناءً على تقاطع متوسطات من فريمات مختلفة.
✅ مزايا إضافية:
قابل للتخصيص بشكل كامل حسب استراتيجيتك.
مناسب لعدة أساليب: تأكيد الترند، إعادة الدخول، أو إشارات الانعكاس المبكر.

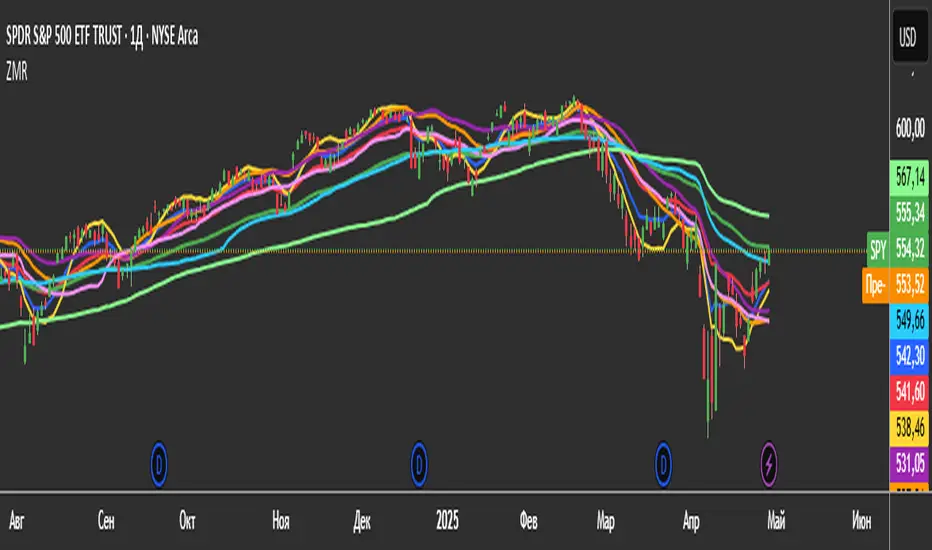
3 Zero Lag + 3 Moving Averages + 3 RVWAPThe "3 Zero Lag + 3 Moving Averages + 3 RVWAP" (ZMR) indicator combines three groups of tools for technical analysis.
1. Three Customizable Moving Averages (MAs):
Configuration for Each MA:
Choice of 7 types (SMA, EMA, WMA, HMA, VWMA, LSMA, SMMA).
Independent periods and price sources for each line.
Visualization:
MA1 (Blue), MA2 (Red), MA3 (Green).
2. Three Zero Lag EMAs (ZLEMA) with Individual Settings:
Lag Reduction: Corrects traditional EMA lag using:
Adjusted Price = 2 * Current Price - Price .
Flexibility:
Unique lengths (20, 50, 70) and individual price sources for each ZLEMA (HLC3, HL2, Close, etc.).
Colors:
ZLEMA1 (Yellow), ZLEMA2 (Orange), ZLEMA3 (Purple).
3. Three Rolling VWAPs with Custom Parameters:
Volume-Weighted Average Price (VWAP):
Calculated for three periods (20, 50, 100) with dedicated price sources for each VWAP.
Colors:
VWAP1 (Pink), VWAP2 (Light Blue), VWAP3 (Neon Green).
Price Change Sentiment Index [tradeviZion]Price Change Sentiment Index
A technical indicator that measures price changes relative to the day's range.
Indicator Overview
Normalizes price changes on a 0-100 scale
Uses a smoothing period for signal clarity
Shows potential overbought/oversold conditions
Inputs
Smoothing Period (default: 3)
Show Background Colors (on/off)
Overbought Level (default: 75)
Oversold Level (default: 25)
Reading the Indicator
Values above 75: Price change showing strong upward movement
Values below 25: Price change showing strong downward movement
Around 50: Neutral price movement
Technical Details
// Core calculation
changePct = (currClose - prevClose) / (high - low)
normalized = 50 + (changePct * 50)
smoothedNormalized = ta.sma(normalizedClamped, smoothingPeriod)
Usage Notes
Best used with other technical analysis tools
Adjustable smoothing period affects signal sensitivity
Background colors highlight extreme readings
Works on any timeframe
Settings Guide
Smoothing Period:
- Lower values (1-3): More responsive
- Higher values (5-10): Smoother output
Visual Settings: Toggle background colors
Levels: Adjust overbought/oversold thresholds
This indicator is a technical analysis tool. Please conduct your own research and testing before use.

Dskyz (DAFE) Adaptive Regime - Quant Machine ProDskyz (DAFE) Adaptive Regime - Quant Machine Pro:
Buckle up for the Dskyz (DAFE) Adaptive Regime - Quant Machine Pro, is a strategy that’s your ultimate edge for conquering futures markets like ES, MES, NQ, and MNQ. This isn’t just another script—it’s a quant-grade powerhouse, crafted with precision to adapt to market regimes, deliver multi-factor signals, and protect your capital with futures-tuned risk management. With its shimmering DAFE visuals, dual dashboards, and glowing watermark, it turns your charts into a cyberpunk command center, making trading as thrilling as it is profitable.
Unlike generic scripts clogging up the space, the Adaptive Regime is a DAFE original, built from the ground up to tackle the chaos of futures trading. It identifies market regimes (Trending, Range, Volatile, Quiet) using ADX, Bollinger Bands, and HTF indicators, then fires trades based on a weighted scoring system that blends candlestick patterns, RSI, MACD, and more. Add in dynamic stops, trailing exits, and a 5% drawdown circuit breaker, and you’ve got a system that’s as safe as it is aggressive. Whether you’re a newbie or a prop desk pro, this strat’s your ticket to outsmarting the markets. Let’s break down every detail and see why it’s a must-have.
Why Traders Need This Strategy
Futures markets are a gauntlet—fast moves, volatility spikes (like the April 28, 2025 NQ 1k-point drop), and institutional traps that punish the unprepared. Meanwhile, platforms are flooded with low-effort scripts that recycle old ideas with zero innovation. The Adaptive Regime stands tall, offering:
Adaptive Intelligence: Detects market regimes (Trending, Range, Volatile, Quiet) to optimize signals, unlike one-size-fits-all scripts.
Multi-Factor Precision: Combines candlestick patterns, MA trends, RSI, MACD, volume, and HTF confirmation for high-probability trades.
Futures-Optimized Risk: Calculates position sizes based on $ risk (default: $300), with ATR or fixed stops/TPs tailored for ES/MES.
Bulletproof Safety: 5% daily drawdown circuit breaker and trailing stops keep your account intact, even in chaos.
DAFE Visual Mastery: Pulsing Bollinger Band fills, dynamic SL/TP lines, and dual dashboards (metrics + position) make signals crystal-clear and charts a work of art.
Original Craftsmanship: A DAFE creation, built with community passion, not a rehashed clone of generic code.
Traders need this because it’s a complete, adaptive system that blends quant smarts, user-friendly design, and DAFE flair. It’s your edge to trade with confidence, cut through market noise, and leave the copycats in the dust.
Strategy Components
1. Market Regime Detection
The strategy’s brain is its ability to classify market conditions into five regimes, ensuring signals match the environment.
How It Works:
Trending (Regime 1): ADX > 20, fast/slow EMA spread > 0.3x ATR, HTF RSI > 50 or MACD bullish (htf_trend_bull/bear).
Range (Regime 2): ADX < 25, price range < 3% of close, no HTF trend.
Volatile (Regime 3): BB width > 1.5x avg, ATR > 1.2x avg, HTF RSI overbought/oversold.
Quiet (Regime 4): BB width < 0.8x avg, ATR < 0.9x avg.
Other (Regime 5): Default for unclear conditions.
Indicators: ADX (14), BB width (20), ATR (14, 50-bar SMA), HTF RSI (14, daily default), HTF MACD (12,26,9).
Why It’s Brilliant:
Regime detection adapts signals to market context, boosting win rates in trending or volatile conditions.
HTF RSI/MACD add a big-picture filter, rare in basic scripts.
Visualized via gradient background (green for Trending, orange for Range, red for Volatile, gray for Quiet, navy for Other).
2. Multi-Factor Signal Scoring
Entries are driven by a weighted scoring system that combines candlestick patterns, trend, momentum, and volume for robust signals.
Candlestick Patterns:
Bullish: Engulfing (0.5), hammer (0.4 in Range, 0.2 else), morning star (0.2), piercing (0.2), double bottom (0.3 in Volatile, 0.15 else). Must be near support (low ≤ 1.01x 20-bar low) with volume spike (>1.5x 20-bar avg).
Bearish: Engulfing (0.5), shooting star (0.4 in Range, 0.2 else), evening star (0.2), dark cloud (0.2), double top (0.3 in Volatile, 0.15 else). Must be near resistance (high ≥ 0.99x 20-bar high) with volume spike.
Logic: Patterns are weighted higher in specific regimes (e.g., hammer in Range, double bottom in Volatile).
Additional Factors:
Trend: Fast EMA (20) > slow EMA (50) + 0.5x ATR (trend_bull, +0.2); opposite for trend_bear.
RSI: RSI (14) < 30 (rsi_bull, +0.15); > 70 (rsi_bear, +0.15).
MACD: MACD line > signal (12,26,9, macd_bull, +0.15); opposite for macd_bear.
Volume: ATR > 1.2x 50-bar avg (vol_expansion, +0.1).
HTF Confirmation: HTF RSI < 70 and MACD bullish (htf_bull_confirm, +0.2); RSI > 30 and MACD bearish (htf_bear_confirm, +0.2).
Scoring:
bull_score = sum of bullish factors; bear_score = sum of bearish. Entry requires score ≥ 1.0.
Example: Bullish engulfing (0.5) + trend_bull (0.2) + rsi_bull (0.15) + htf_bull_confirm (0.2) = 1.05, triggers long.
Why It’s Brilliant:
Multi-factor scoring ensures signals are confirmed by multiple market dynamics, reducing false positives.
Regime-specific weights make patterns more relevant (e.g., hammers shine in Range markets).
HTF confirmation aligns with the big picture, a quant edge over simplistic scripts.
3. Futures-Tuned Risk Management
The risk system is built for futures, calculating position sizes based on $ risk and offering flexible stops/TPs.
Position Sizing:
Logic: Risk per trade (default: $300) ÷ (stop distance in points * point value) = contracts, capped at max_contracts (default: 5). Point value = tick value (e.g., $12.5 for ES) * ticks per point (4) * contract multiplier (1 for ES, 0.1 for MES).
Example: $300 risk, 8-point stop, ES ($50/point) → 0.75 contracts, rounded to 1.
Impact: Precise sizing prevents over-leverage, critical for micro contracts like MES.
Stops and Take-Profits:
Fixed: Default stop = 8 points, TP = 16 points (2:1 reward/risk).
ATR-Based: Stop = 1.5x ATR (default), TP = 3x ATR, enabled via use_atr_for_stops.
Logic: Stops set at swing low/high ± stop distance; TPs at 2x stop distance from entry.
Impact: ATR stops adapt to volatility, while fixed stops suit stable markets.
Trailing Stops:
Logic: Activates at 50% of TP distance. Trails at close ± 1.5x ATR (atr_multiplier). Longs: max(trail_stop_long, close - ATR * 1.5); shorts: min(trail_stop_short, close + ATR * 1.5).
Impact: Locks in profits during trends, a game-changer in volatile sessions.
Circuit Breaker:
Logic: Pauses trading if daily drawdown > 5% (daily_drawdown = (max_equity - equity) / max_equity).
Impact: Protects capital during black swan events (e.g., April 27, 2025 ES slippage).
Why It’s Brilliant:
Futures-specific inputs (tick value, multiplier) make it plug-and-play for ES/MES.
Trailing stops and circuit breaker add pro-level safety, rare in off-the-shelf scripts.
Flexible stops (ATR or fixed) suit different trading styles.
4. Trade Entry and Exit Logic
Entries and exits are precise, driven by bull_score/bear_score and protected by drawdown checks.
Entry Conditions:
Long: bull_score ≥ 1.0, no position (position_size <= 0), drawdown < 5% (not pause_trading). Calculates contracts, sets stop at swing low - stop points, TP at 2x stop distance.
Short: bear_score ≥ 1.0, position_size >= 0, drawdown < 5%. Stop at swing high + stop points, TP at 2x stop distance.
Logic: Tracks entry_regime for PNL arrays. Closes opposite positions before entering.
Exit Conditions:
Stop-Loss/Take-Profit: Hits stop or TP (strategy.exit).
Trailing Stop: Activates at 50% TP, trails by ATR * 1.5.
Emergency Exit: Closes if price breaches stop (close < long_stop_price or close > short_stop_price).
Reset: Clears stop/TP prices when flat (position_size = 0).
Why It’s Brilliant:
Score-based entries ensure multi-factor confirmation, filtering out weak signals.
Trailing stops maximize profits in trends, unlike static exits in basic scripts.
Emergency exits add an extra safety layer, critical for futures volatility.
5. DAFE Visuals
The visuals are pure DAFE magic, blending function with cyberpunk flair to make signals intuitive and charts stunning.
Shimmering Bollinger Band Fill:
Display: BB basis (20, white), upper/lower (green/red, 45% transparent). Fill pulses (30–50 alpha) by regime, with glow (60–95 alpha) near bands (close ≥ 0.995x upper or ≤ 1.005x lower).
Purpose: Highlights volatility and key levels with a futuristic glow.
Visuals make complex regimes and signals instantly clear, even for newbies.
Pulsing effects and regime-specific colors add a DAFE signature, setting it apart from generic scripts.
BB glow emphasizes tradeable levels, enhancing decision-making.
Chart Background (Regime Heatmap):
Green — Trending Market: Strong, sustained price movement in one direction. The market is in a trend phase—momentum follows through.
Orange — Range-Bound: Market is consolidating or moving sideways, with no clear up/down trend. Great for mean reversion setups.
Red — Volatile Regime: High volatility, heightened risk, and larger/faster price swings—trade with caution.
Gray — Quiet/Low Volatility: Market is calm and inactive, with small moves—often poor conditions for most strategies.
Navy — Other/Neutral: Regime is uncertain or mixed; signals may be less reliable.
Bollinger Bands Glow (Dynamic Fill):
Neon Red Glow — Warning!: Price is near or breaking above the upper band; momentum is overstretched, watch for overbought conditions or reversals.
Bright Green Glow — Opportunity!: Price is near or breaking below the lower band; market could be oversold, prime for bounce or reversal.
Trend Green Fill — Trending Regime: Fills between bands with green when the market is trending, showing clear momentum.
Gold/Yellow Fill — Range Regime: Fills with gold/aqua in range conditions, showing the market is sideways/oscillating.
Magenta/Red Fill — Volatility Spike: Fills with vivid magenta/red during highly volatile regimes.
Blue Fill — Neutral/Quiet: A soft blue glow for other or uncertain market states.
Moving Averages:
Display: Blue fast EMA (20), red slow EMA (50), 2px.
Purpose: Shows trend direction, with trend_dir requiring ATR-scaled spread.
Dynamic SL/TP Lines:
Display: Pulsing colors (red SL, green TP for Trending; yellow/orange for Range, etc.), 3px, with pulse_alpha for shimmer.
Purpose: Tracks stops/TPs in real-time, color-coded by regime.
6. Dual Dashboards
Two dashboards deliver real-time insights, making the strat a quant command center.
Bottom-Left Metrics Dashboard (2x13):
Metrics: Mode (Active/Paused), trend (Bullish/Bearish/Neutral), ATR, ATR avg, volume spike (YES/NO), RSI (value + Oversold/Overbought/Neutral), HTF RSI, HTF trend, last signal (Buy/Sell/None), regime, bull score.
Display: Black (29% transparent), purple title, color-coded (green for bullish, red for bearish).
Purpose: Consolidates market context and signal strength.
Top-Right Position Dashboard (2x7):
Metrics: Regime, position side (Long/Short/None), position PNL ($), SL, TP, daily PNL ($).
Display: Black (29% transparent), purple title, color-coded (lime for Long, red for Short).
Purpose: Tracks live trades and profitability.
Why It’s Brilliant:
Dual dashboards cover market context and trade status, a rare feature.
Color-coding and concise metrics guide beginners (e.g., green “Buy” = go).
Real-time PNL and SL/TP visibility empower disciplined trading.
7. Performance Tracking
Logic: Arrays (regime_pnl_long/short, regime_win/loss_long/short) track PNL and win/loss by regime (1–5). Updated on trade close (barstate.isconfirmed).
Purpose: Prepares for future adaptive thresholds (e.g., adjust bull_score min based on regime performance).
Why It’s Brilliant: Lays the groundwork for self-optimizing logic, a quant edge over static scripts.
Key Features
Regime-Adaptive: Optimizes signals for Trending, Range, Volatile, Quiet markets.
Futures-Optimized: Precise sizing for ES/MES with tick-based risk inputs.
Multi-Factor Signals: Candlestick patterns, RSI, MACD, and HTF confirmation for robust entries.
Dynamic Exits: ATR/fixed stops, 2:1 TPs, and trailing stops maximize profits.
Safe and Smart: 5% drawdown breaker and emergency exits protect capital.
DAFE Visuals: Shimmering BB fill, pulsing SL/TP, and dual dashboards.
Backtest-Ready: Fixed qty and tick calc for accurate historical testing.
How to Use
Add to Chart: Load on a 5min ES/MES chart in TradingView.
Configure Inputs: Set instrument (ES/MES), tick value ($12.5/$1.25), multiplier (1/0.1), risk ($300 default). Enable ATR stops for volatility.
Monitor Dashboards: Bottom-left for regime/signals, top-right for position/PNL.
Backtest: Run in strategy tester to compare regimes.
Live Trade: Connect to Tradovate or similar. Watch for slippage (e.g., April 27, 2025 ES issues).
Replay Test: Try April 28, 2025 NQ drop to see regime shifts and stops.
Disclaimer
Trading futures involves significant risk of loss and is not suitable for all investors. Past performance does not guarantee future results. Backtest results may differ from live trading due to slippage, fees, or market conditions. Use this strategy at your own risk, and consult a financial advisor before trading. Dskyz (DAFE) Trading Systems is not responsible for any losses incurred.
Backtesting:
Frame: 2023-09-20 - 2025-04-29
Slippage: 3
Fee Typical Range (per side, per contract)
CME Exchange $1.14 – $1.20
Clearing $0.10 – $0.30
NFA Regulatory $0.02
Firm/Broker Commis. $0.25 – $0.80 (retail prop)
TOTAL $1.60 – $2.30 per side
Round Turn: (enter+exit) = $3.20 – $4.60 per contract
Final Notes
The Dskyz (DAFE) Adaptive Regime - Quant Machine Pro is more than a strategy—it’s a revolution. Crafted with DAFE’s signature precision, it rises above generic scripts with adaptive regimes, quant-grade signals, and visuals that make trading a thrill. Whether you’re scalping MES or swinging ES, this system empowers you to navigate markets with confidence and style. Join the DAFE crew, light up your charts, and let’s dominate the futures game!
(This publishing will most likely be taken down do to some miscellaneous rule about properly displaying charting symbols, or whatever. Once I've identified what part of the publishing they want to pick on, I'll adjust and repost.)
Use it with discipline. Use it with clarity. Trade smarter.
**I will continue to release incredible strategies and indicators until I turn this into a brand or until someone offers me a contract.
Created by Dskyz, powered by DAFE Trading Systems. Trade smart, trade bold.

Dskyz (DAFE) Quantum Sentiment Flux - Beginners Dskyz (DAFE) Quantum Sentiment Flux - Beginners:
Welcome to the Dskyz (DAFE) Quantum Sentiment Flux - Beginners , a strategy and concept that’s your ultimate wingman for trading futures like MNQ, NQ, MES, and ES. This gem combines lightning-fast momentum signals, market sentiment smarts, and bulletproof risk management into a system so intuitive, even newbies can trade like pros. With clean DAFE visuals, preset modes for every vibe, and a revamped dashboard that’s basically a market GPS, this strategy makes futures trading feel like a high-octane sci-fi mission.
Built on the Dskyz (DAFE) legacy of Aurora Divergence, the Quantum Sentiment Flux is designed to empower beginners while giving seasoned traders a lean, sentiment-driven edge. It uses fast/slow EMA crossovers for entries, filters trades with VIX, SPX trends, and sector breadth, and keeps your account safe with adaptive stops and cooldowns. Tuned for more action with faster signals and a slick bottom-left dashboard, this updated version is ready to light up your charts and outsmart institutional traps. Let’s dive into why this strat’s a must-have and break down its brilliance.
Why Traders Need This Strategy
Futures markets are a wild ride—fast moves, volatility spikes (like the April 28, 2025 NQ 1k-point drop), and institutional games that can wreck unprepared traders. Beginners often get lost in complex systems or burned by impulsive trades. The Quantum Sentiment Flux is the antidote, offering:
Dead-Simple Setup: Preset modes (Aggressive, Balanced, Conservative) auto-tune signals, risk, and sizing, so you can trade without a quant degree.
Sentiment Superpower: VIX filter, SPX trend, and sector breadth visuals keep you aligned with market health, dodging chop and riding trends.
Ironclad Safety: Tighter ATR-based stops, 2:1 take-profits, and preset cooldowns protect your capital, even in chaotic sessions.
Next-Level Visuals: Green/red entry triangles, vibrant EMAs, a sector breadth background, and a beefed-up dashboard make signals and context pop.
DAFE Swagger: The clean aesthetics, sleek dashboard—ties it to Dskyz’s elite brand, making your charts a work of art.
Traders need this because it’s a plug-and-play system that blends beginner-friendly simplicity with pro-level market awareness. Whether you’re just starting or scalping 5min MNQ, this strat’s your key to trading with confidence and style.
Strategy Components
1. Core Signal Logic (High-Speed Momentum)
The strategy’s engine is a momentum-based system using fast and slow Exponential Moving Averages (EMAs), now tuned for faster, more frequent trades.
How It Works:
Fast/Slow EMAs: Fast EMA (Aggressive: 5, Balanced: 7, Conservative: 9 bars) and slow EMA (12/14/18 bars) track short-term vs. longer-term momentum.
Crossover Signals:
Buy: Fast EMA crosses above slow EMA, and trend_dir = 1 (fast EMA > slow EMA + ATR * strength threshold).
Sell: Fast EMA crosses below slow EMA, and trend_dir = -1 (fast EMA < slow EMA - ATR * strength threshold).
Strength Filter: ma_strength = fast EMA - slow EMA must exceed an ATR-scaled threshold (Aggressive: 0.15, Balanced: 0.18, Conservative: 0.25) for robust signals.
Trend Direction: trend_dir confirms momentum, filtering out weak crossovers in choppy markets.
Evolution:
Faster EMAs (down from 7–10/21–50) catch short-term trends, perfect for active futures markets.
Lower strength thresholds (0.15–0.25 vs. 0.3–0.5) make signals more sensitive, boosting trade frequency without sacrificing quality.
Preset tuning ensures beginners get optimized settings, while pros can tweak via mode selection.
2. Market Sentiment Filters
The strategy leans hard into market sentiment with a VIX filter, SPX trend analysis, and sector breadth visuals, keeping trades aligned with the big picture.
VIX Filter:
Logic: Blocks long entries if VIX > threshold (default: 20, can_long = vix_close < vix_limit). Shorts are always allowed (can_short = true).
Impact: Prevents longs during high-fear markets (e.g., VIX spikes in crashes), while allowing shorts to capitalize on downturns.
SPX Trend Filter:
Logic: Compares S&P 500 (SPX) close to its SMA (Aggressive: 5, Balanced: 8, Conservative: 12 bars). spx_trend = 1 (UP) if close > SMA, -1 (DOWN) if < SMA, 0 (FLAT) if neutral.
Impact: Provides dashboard context, encouraging trades that align with market direction (e.g., longs in UP trend).
Sector Breadth (Visual):
Logic: Tracks 10 sector ETFs (XLK, XLF, XLE, etc.) vs. their SMAs (same lengths as SPX). Each sector scores +1 (bullish), -1 (bearish), or 0 (neutral), summed as breadth (-10 to +10).
Display: Green background if breadth > 4, red if breadth < -4, else neutral. Dashboard shows sector trends (↑/↓/-).
Impact: Faster SMA lengths make breadth more responsive, reflecting sector rotations (e.g., tech surging, energy lagging).
Why It’s Brilliant:
- VIX filter adds pro-level volatility awareness, saving beginners from panic-driven losses.
- SPX and sector breadth give a 360° view of market health, boosting signal confidence (e.g., green BG + buy signal = high-probability trade).
- Shorter SMAs make sentiment visuals react faster, perfect for 5min charts.
3. Risk Management
The risk controls are a fortress, now tighter and more dynamic to support frequent trading while keeping accounts safe.
Preset-Based Risk:
Aggressive: Fast EMAs (5/12), tight stops (1.1x ATR), 1-bar cooldown. High trade frequency, higher risk.
Balanced: EMAs (7/14), 1.2x ATR stops, 1-bar cooldown. Versatile for most traders.
Conservative: EMAs (9/18), 1.3x ATR stops, 2-bar cooldown. Safer, fewer trades.
Impact: Auto-scales risk to match style, making it foolproof for beginners.
Adaptive Stops and Take-Profits:
Logic: Stops = entry ± ATR * atr_mult (1.1–1.3x, down from 1.2–2.0x). Take-profits = entry ± ATR * take_mult (2x stop distance, 2:1 reward/risk). Longs: stop below entry, TP above; shorts: vice versa.
Impact: Tighter stops increase trade turnover while maintaining solid risk/reward, adapting to volatility.
Trade Cooldown:
Logic: Preset-driven (Aggressive/Balanced: 1 bar, Conservative: 2 bars vs. old user-input 2). Ensures bar_index - last_trade_bar >= cooldown.
Impact: Faster cooldowns (especially Aggressive/Balanced) allow more trades, balanced by VIX and strength filters.
Contract Sizing:
Logic: User sets contracts (default: 1, max: 10), no preset cap (unlike old 7/5/3 suggestion).
Impact: Flexible but risks over-leverage; beginners should stick to low contracts.
Built To Be Reliable and Consistent:
- Tighter stops and faster cooldowns make it a high-octane system without blowing up accounts.
- Preset-driven risk removes guesswork, letting newbies trade confidently.
- 2:1 TPs ensure profitable trades outweigh losses, even in volatile sessions like April 27, 2025 ES slippage.
4. Trade Entry and Exit Logic
The entry/exit rules are simple yet razor-sharp, now with VIX filtering and faster signals:
Entry Conditions:
Long Entry: buy_signal (fast EMA crosses above slow EMA, trend_dir = 1), no position (strategy.position_size = 0), cooldown passed (can_trade), and VIX < 20 (can_long). Enters with user-defined contracts.
Short Entry: sell_signal (fast EMA crosses below slow EMA, trend_dir = -1), no position, cooldown passed, can_short (always true).
Logic: Tracks last_entry_bar for visuals, last_trade_bar for cooldowns.
Exit Conditions:
Stop-Loss/Take-Profit: ATR-based stops (1.1–1.3x) and TPs (2x stop distance). Longs exit if price hits stop (below) or TP (above); shorts vice versa.
No Other Exits: Keeps it straightforward, relying on stops/TPs.
5. DAFE Visuals
The visuals are pure DAFE magic, blending clean function with informative metrics utilized by professionals, now enhanced by faster signals and a responsive breadth background:
EMA Plots:
Display: Fast EMA (blue, 2px), slow EMA (orange, 2px), using faster lengths (5–9/12–18).
Purpose: Highlights momentum shifts, with crossovers signaling entries.
Sector Breadth Background:
Display: Green (90% transparent) if breadth > 4, red (90%) if breadth < -4, else neutral.
Purpose: Faster breadth_sma_len (5–12 vs. 10–50) reflects sector shifts in real-time, reinforcing signal strength.
- Visuals are intuitive, turning complex signals into clear buy/sell cues.
- Faster breadth background reacts to market rotations (e.g., tech vs. energy), giving a pro-level edge.
6. Sector Breadth Dashboard
The new bottom-left dashboard is a game-changer, a 3x16 table (black/gray theme) that’s your market command center:
Metrics:
VIX: Current VIX (red if > 20, gray if not).
SPX: Trend as “UP” (green), “DOWN” (red), or “FLAT” (gray).
Trade Longs: “OK” (green) if VIX < 20, “BLOCK” (red) if not.
Sector Breadth: 10 sectors (Tech, Financial, etc.) with trend arrows (↑ green, ↓ red, - gray).
Placeholder Row: Empty for future metrics (e.g., ATR, breadth score).
Purpose: Consolidates regime, volatility, market trend, and sector data, making decisions a breeze.
- VIX and SPX metrics add context, helping beginners avoid bad trades (e.g., no longs if “BLOCK”).
Sector arrows show market health at a glance, like a cheat code for sentiment.
Key Features
Beginner-Ready: Preset modes and clear visuals make futures trading a breeze.
Sentiment-Driven: VIX filter, SPX trend, and sector breadth keep you in sync with the market.
High-Frequency: Faster EMAs, tighter stops, and short cooldowns boost trade volume.
Safe and Smart: Adaptive stops/TPs and cooldowns protect capital while maximizing wins.
Visual Mastery: DAFE’s clean flair, EMAs, dashboard—makes trading fun and clear.
Backtestable: Lean code and fixed qty ensure accurate historical testing.
How to Use
Add to Chart: Load on a 5min MNQ/ES chart in TradingView.
Pick Preset: Aggressive (scalping), Balanced (versatile), or Conservative (safe). Balanced is default.
Set Contracts: Default 1, max 10. Stick low for safety.
Check Dashboard: Bottom-left shows preset, VIX, SPX, and sectors. “OK” + green breadth = strong buy.
Backtest: Run in strategy tester to compare modes.
Live Trade: Connect to Tradovate or similar. Watch for slippage (e.g., April 27, 2025 ES issues).
Replay Test: Try April 28, 2025 NQ drop to see VIX filter and stops in action.
Why It’s Brilliant
The Dskyz (DAFE) Quantum Sentiment Flux - Beginners is a masterpiece of simplicity and power. It takes pro-level tools—momentum, VIX, sector breadth—and wraps them in a system anyone can run. Faster signals and tighter stops make it a trading machine, while the VIX filter and dashboard keep you ahead of market chaos. The DAFE visuals and bottom-left command center turn your chart into a futuristic cockpit, guiding you through every trade. For beginners, it’s a safe entry to futures; for pros, it’s a scalping beast with sentiment smarts. This strat doesn’t just trade—it transforms how you see the market.
Final Notes
This is more than a strategy—it’s your launchpad to mastering futures with Dskyz (DAFE) flair. The Quantum Sentiment Flux blends accessibility, speed, and market savvy to help you outsmart the game. Load it, watch those triangles glow, and let’s make the markets your canvas!
Official Statement from Pine Script Team
(see TradingView help docs and forums):
"This warning may appear when you call functions such as ta.sma inside a request.security in a loop. There is no runtime impact. If you need to loop through a dynamic list of tickers, this cannot be avoided in the present version... Values will still be correct. Ignore this warning in such contexts."
(This publishing will most likely be taken down do to some miscellaneous rule about properly displaying charting symbols, or whatever. Once I've identified what part of the publishing they want to pick on, I'll adjust and repost.)
Use it with discipline. Use it with clarity. Trade smarter.
**I will continue to release incredible strategies and indicators until I turn this into a brand or until someone offers me a contract.
Created by Dskyz, powered by DAFE Trading Systems. Trade fast, trade bold.

RTB - Momentum Breakout Strategy V3
📈 RTB - Momentum Breakout Strategy V3 is a directional breakout strategy based on momentum. It combines exponential moving averages (EMAs), RSI, and recent support/resistance levels to detect breakout entries with trend confirmation. The system includes dynamic risk management using ATR-based stop-loss and trailing stop levels. Webhook alerts are supported for external automated trading integrations.
🔎 The strategy was backtested using default parameters on BTCUSDT Futures (Bybit) with 4-hour timeframe and a 0.05% commission per trade.
⚠️ This script is for educational purposes only and does not constitute financial advice. Always do your own research before trading.

Smart Adaptive MACDAn advanced MACD variant that dynamically adapts to market volatility using ATR-based scaling.
Key Features:
Volatility-sensitive MACD and Signal lengths
Optional smoothed MACD line
Dynamic histogram heatmap (strong vs. weak momentum)
Built-in Regular and Hidden Divergence detection
Clear visual signals via solid (regular) and dashed (hidden) divergence lines
What makes this different:
Unlike traditional MACD indicators with fixed-length settings, this version adapts in real time
to changing volatility conditions. It shortens during high-momentum environments for faster
reaction, and lengthens during low-volatility phases to reduce noise. This allows better
alignment with market behavior and cleaner momentum signals.
Divergence Detection – How It Works
The Smart Adaptive MACD detects both regular and hidden divergences by comparing price action with the smoothed MACD line. It uses recent pivot highs and lows to evaluate divergence and draws lines on the chart when conditions are met.
Regular Divergence Detection
This type of divergence signals potential reversals. It occurs when the price moves in one
direction while the MACD moves in the opposite.
Bullish Regular Divergence:
Price makes lower lows, but MACD makes higher lows.
Result: A solid green line is plotted beneath the MACD curve.
Bearish Regular Divergence:
Price makes higher highs, but MACD makes lower highs.
Result: A solid red line is plotted above the MACD curve.
Hidden Divergence Detection
This type of divergence signals trend continuation. It occurs when price pulls back slightly,
but the MACD shows deeper movement in the opposite direction.
Bullish Hidden Divergence:
Price makes higher lows, but MACD makes lower lows.
Result: A dashed green line is plotted below the MACD curve.
Bearish Hidden Divergence:
Price makes lower highs, but MACD makes higher highs.
Result: A dashed red line is plotted above the MACD curve.
How to Use:
This tool is best used alongside price structure, key support/resistance levels, or as a
secondary confirmation for your trend or reversal strategy. It is designed to enhance your
interpretation of market momentum and divergence without needing extra chart clutter.
Disclaimer:
This script is provided for educational and informational purposes only. It is not intended as
financial advice or a recommendation to buy or sell any asset. Always conduct your own
research and consult with a licensed financial advisor before making trading decisions. Use
at your own risk.
License:
This script is published under the Mozilla Public License 2.0 and is fully open-source.
Built by AresIQ | 2025