Moving Averages

Daily 50‑ & 200‑SMA Ceiling Radar — EnhancedDescription:
This custom TradingView indicator, developed by Trader Malik and licensed under Trades Per Minute, is a powerful visual tool for identifying how price behaves relative to major daily moving averages — the 50-SMA and 200-SMA. It helps traders quickly understand key technical dynamics such as trend alignment, MA proximity, and short-term momentum sentiment — all displayed on a clean, minimal overlay with visual alerts and an adjustable data table.
FEATURES
1. Daily 50 & 200 Simple Moving Averages (SMA):**
- Displayed directly on the chart using distinct blue and orange lines.
- These serve as primary trend filters and support/resistance zones.
2. Price Highlighting:
- A red background flashes momentarily when the price crosses either the 50-SMA or 200-SMA.
- A green background fills the chart when price is above both MAs (bullish zone).
- A red background persists if price is below both MAs (bearish zone).
3. MA Gap Analysis Table:
- 50-SMA Row**: Shows % gap between 50-SMA and 200-SMA.
- 200-SMA Row**: Shows % gap between 200-SMA and 50-SMA.
- Sentiment Row**: Displays short-term trend bias based on the slope of the past 7 daily closes — Bullish, Neutral, or Bearish.
USER SETTINGS
Table Location: Choose between **Top Right** or **Bottom Right** of the chart.
Table Size: Select **Small**, **Medium**, or **Large** to suit screen preferences and layout aesthetics.
This script is **intellectual property of Trades Per Minute** and distributed by **Trader Malik** for use under licensing terms. Redistribution or repurposing without authorization is strictly prohibited.

SMA - ATR with Dual SMAs + Candle Body Inside SignalsSMA - ATR with Dual SMAs + Candle Body Inside Signals

AlgoTradar MACD (Auto-Optimized)This is the AlgoTradar MACD Optimized indicator, a finely-tuned tool based on the classic MACD crossover strategy.
The script is designed to provide clear, actionable signals for both manual and automated trading systems.
How to Use
Apply to Chart: For the best results, apply this indicator to your chart on the 8-hour (8H) timeframe. Using it on other timeframes may produce less reliable signals as the parameters are tailored for 4H, 8H, 1D, 1W, 1M.
Interpret the Signals:
🚀 BUY Signal: A green "BUY" label appears when the blue MACD line crosses above the orange Signal line. This indicates potential bullish momentum.
📉 SELL Signal: A red "SELL" label appears when the blue MACD line crosses below the orange Signal line. This indicates potential bearish momentum.
Confirmation is Key: This indicator should not be used in isolation. Always use it in conjunction with other analysis methods, such as trend lines, support and resistance levels, or other indicators, to confirm signals before entering a trade.

AlgoTradar MACD (Auto-Optimized)Description
This is the AlgoTradar MACD (8H Optimized) indicator, a finely-tuned tool based on the classic MACD crossover strategy.
The script is designed to provide clear, actionable signals for both manual and automated trading systems.
How to Use
Apply to Chart: For the best results, apply this indicator to your chart on the 8-hour (8H) timeframe. Using it on other timeframes may produce less reliable signals as the parameters are tailored for 8H.
Interpret the Signals:
🚀 BUY Signal: A green "BUY" label appears when the blue MACD line crosses above the orange Signal line. This indicates potential bullish momentum.
📉 SELL Signal: A red "SELL" label appears when the blue MACD line crosses below the orange Signal line. This indicates potential bearish momentum.
Confirmation is Key: This indicator should not be used in isolation. Always use it in conjunction with other analysis methods, such as trend lines, support and resistance levels, or other indicators, to confirm signals before entering a trade.

Money Flow Liquidity Zones by smaThis indicator visualizes money flow dynamics combined with liquidity zones to help traders identify potential areas of high and low interest on the chart.
It overlays an adaptive cash flow oscillator around a selected price base and highlights possible liquidity areas using adjustable zones.
Traders can use it to spot potential reversals, confirm trends, or refine entry/exit levels by observing how price interacts with these zones.


Multiple MAs for Daily and IntradayMultiple DMAs (5, 8, 10, 21, 50, 65, 200) and their equivalent in lower timeframes (3min, 30min, 65min) with the options to select from SMA or EMA.


BTC Toolkit **Not Financial advice**
BTC 4yr Cycle Toolkit. Includes Pi Cycle Top/Bottom indicator, Puell Multiple, Realized Price, CVDD, 100/200MA, Halving Calendar w/ plot, 200W heatmap.
INSTRUCTIONS
BTCUSD, Set Timeframe to 1D. Toggle Log/reg scale. All user input plots are ON by default.
Only turn ON CVDD, Long MA Top/Bottom, Pi Cycle Top/Bottom, 100 / 200 MA. Use the other tools as you want.
Buy BTC when 1) (pay attention when) price starts heading under 100W MA, then
toward/under 200W MA (early warning), (MACD weekly starts trending up after drop, RSI ~30) 2) When Pi Cycle Bottom alert, then 4) Realized Price 3) Price nears/goes under CVDD green line *FIRESALE* (BTC rarely touches this line). Buy altcoins 1-3 W/M later (see OTHERS.D). MSTR, BITX?
Sell BTC when weekly RSI ~ 75-80 (early warning), MACD weekly starts trending down after massive rally, Pi Cycle Top alert (3D-1W after). Sell Altcoins 2W-30D later (see OTHERS.D). SBIT, BITI?
* Puell is available, but not as oscillator, so make of it what you will. Heatmap dots measure distance from 200W SMA.
CYCLES
-Bottom to Top - Average: 480 days (1 year and 4 months) from halving to market top
-Top to Bottom - Average: 383 days (1 year and 2 weeks) from market top to bottom
-Bottom occurs ~515-523 days before next halving
-Bull markets last 1-2 years, bear markets similar duration or longer
-Bull Market: ~3 years from bottom to top
-Accumulation: ~160D at bottom
-BTC doesn't spend much time below 200 Week MA (5%), and CVDD firesale
-Halving, then 12-18 months later = top (varies by cycle)
-Unstake 3 months before top
**Not Financial advice**


JXMJXRS - EMA Break VelocityEMA Breaks Velocity is a crypto-focused indicator that detects strong momentum breakouts using EMA crossover logic combined with a velocity filter. It is designed to help avoid fakeouts and only react to meaningful price action.
This tool calculates two EMAs (default 20 and 50) and identifies when they cross. However, a signal is only triggered if the price also moves a minimum percentage within the same candle. This ensures that breakouts are only flagged when accompanied by significant momentum.
A bullish breakout is detected when the fast EMA crosses above the slow EMA and the candle’s open-to-close percentage gain exceeds the velocity threshold. A bearish breakout is the opposite. The default velocity threshold is 1.5 percent, but this can be adjusted in the settings.
When a breakout condition is met, a triangle is plotted on the chart to indicate the entry signal. If an EMA crossover happens but the candle is too weak, a light warning label appears to signal a low-strength move that should be treated cautiously.
This indicator works well on 5-minute to 1-hour charts and is ideal for high-volatility altcoins and major pairs like BTC and ETH. Alerts are included for both bullish and bearish velocity-confirmed breakouts.
You can adjust the EMAs and velocity threshold to better suit different market conditions or pairs.
Labels will only remain when breakout strength is confirmed. Quick fades or fakeouts may cause labels to appear briefly and disappear, highlighting potential market indecision during the breakout.

ICT Macro Highlighter + EMA 9/20/200 + Alertstest indicator for Triple ema cross during high probability ICT macros

KHAN ULTIMATEMost Versatile Indicator working on all assets and Time frames, with Two Buy entry Triggers when favorable conditions are met.
Just follow the Labels and exit Long when Sell appears or Price crosses below the Blue line, on the short side enter with Sell and exit when price crosses above the Fuchsia line.
Disclaimer : As everyone knows that indicators are lagging in Nature and always follows the Price action and Price never follows the indicators so a Buy/Sell triggers never guarantees a successful trade, market conditions and several other factors are also needs to be considered and always follow Risk management.
for any clarifications DM me.
I( author) have no responsibility for Profit/Loss booked by using this Indicator, User is solely responsible. for it,

Sentinela
Sentinela is a technical indicator built to precisely detect buy and sell opportunities based on overbought/oversold signals within well-defined trends.
🔍 **Features:**
- Buy (🟢) and sell (🔴) signals with clean visual arrows.
- Optional display of stop and 2× reward target levels.
- Works on all timeframes and assets (crypto, stocks, indices).
- Auto-alert ready for bots and automation.
⚙️ **How to use:**
- Enter trades based on arrows and manage risk using the plotted levels.
- Combine with support/resistance zones or volume for added confluence.
🎯 **Benefits:**
- No user configuration required.
- Internal logic fully protected from reverse-engineering.
- Clean and efficient for scalping, swing trading, or longer holds.

Signalgo MASignalgo MA
Signalgo MA is a next-generation indicator for TradingView that redefines moving average (MA) trading by combining multi-timeframe logic, trend strength filtering, and adaptive trade management. Here’s a deep dive into how it works, its unique features, and why it stands apart from traditional MA indicators.
How Signalgo MA Works
1. Multi-Timeframe Moving Average Analysis
Simultaneous EMA & SMA Tracking: Signalgo MA calculates exponential (EMA) and simple (SMA) moving averages across a wide range of timeframes—from 1 minute to 3 months.
Layered Cross Detection: It detects crossovers and crossunders on each timeframe, allowing for both micro and macro trend detection.
Synchronized Signal Mapping: Instead of acting on a single crossover, the indicator requires agreement across multiple timeframes to trigger meaningful signals, filtering out noise and false positives.
2. Trend Strength & Quality Filtering
ADX Trend Filter: Trades are only considered when the Average Directional Index (ADX) confirms a strong trend, ensuring signals are not triggered during choppy or directionless markets.
Volume & Momentum Confirmation: For the strongest signals, the system requires:
A significant volume spike
Price above/below a longer-term EMA (for buys/sells)
RSI momentum confirmation
One-Time Event Detection: Each crossover event is flagged only once per occurrence, preventing repeated signals from the same move.
Inputs & User Controls
Preset Parameters:
EMA & SMA Lengths: Optimized for both short-term and long-term analysis.
ADX Length & Minimum: Sets the threshold for what is considered a “strong” trend.
Show Labels/Table: Visual toggles for displaying signal and trade management information.
Trade Management:
Show TP/SL Logic: Toggle to display or hide take-profit (TP) and stop-loss (SL) levels.
ATR Length & Multipliers: Fine-tune how SL and TP levels adapt to market volatility.
Enable Trailing Stop: Option to activate dynamic stop movement after TP1.
Entry & Exit Strategy
Entry Logic
Long (Buy) Entry: Triggered when multiple timeframes confirm bullish EMA/SMA crossovers, ADX confirms trend strength, and all volume/momentum filters align.
Short (Sell) Entry: Triggered when multiple timeframes confirm bearish crossunders, with the same strict filtering.
Exit & Trade Management
Stop Loss (SL): Automatically set based on recent volatility (ATR), adapting to current market conditions.
Take Profits (TP1, TP2, TP3): Three profit targets at increasing reward multiples, allowing for flexible trade management.
Trailing Stop: After TP1 is hit, the stop loss moves to breakeven and a trailing stop is activated to lock in further gains.
Event Markers: Each time a TP or SL is hit, a visual label is placed on the chart for full transparency.
Strict Signal Quality Filters: Signals are only generated when volume spikes, momentum, and trend strength all align—dramatically reducing false positives.
Adaptive, Automated Trade Management: Built-in TP/SL and trailing logic mean you get not just signals, but a full trade management suite—rarely found in standard MA indicators.
Event-Driven, Not Static: Each signal is triggered only once per event, eliminating repetitive or redundant entries.
Visual & Alert Integration: Every signal and trade event is visually marked and can trigger TradingView alerts, keeping you informed in real time.
Trading Strategy Application
Versatility: Suitable for scalping, day trading, swing trading, and longer-term positions thanks to its multi-timeframe logic.
Systematic Execution: By automating entries, exits, and risk management, Signalgo MA helps you trade with discipline and confidence, minimizing emotional bias.
Noise Reduction: The advanced, layered filtering logic means you only see the highest-probability setups, helping you avoid common MA “fakeouts” and overtrading.

FLUID-TRADES SMC Indicator that works on All TF and assets Trade, source code is Hidden but other adjustments can be made

Trend Dynamics [AlgoXcalibur]A stunning dynamic overlay.
Trend Dynamics combines an ultra-dynamic Ribbon, adaptive supply/demand Zones, and a momentum-based support & resistance Cloud to paint a stunning picture of the market structure. Whether you're riding strong trends or patiently analyzing consolidation, this tool helps visualize the factors that influence the trend and price action.
🧠 Indicator Logic
This indicator integrates three core elements to provide a thorough understanding of trend structure. At the center of attention is the Dynamic Ribbon, which uses multi-layered moving averages rendered as a dynamic ribbon with adaptive color gradients to reveal trend direction, strength, and compression. To further identify bias, the Dynamic Zones introduce volume-weighted supply and demand zones that often guide price action during strong trends. Last but not least, the Dynamic Cloud adds a unique momentum-based support & resistance layer derived from recent price action. This combination ensures a well-rounded analysis that responds and adapts to price action in real-time.
⚙️ User-Adjustable Features
Each of these features can be independently enabled/disabled to your preference.
• Dynamic Ribbon — Enable to visualize trend direction, strength, and compression.
• Dynamic Zones — Enable to reveal volume-weighted supply and demand zones that often guide price action during strong trends.
• Dynamic Cloud — Enable to visualize a momentum-based support and resistance cloud derived from recent price action.
🚀 Ride the Trend
Trend Dynamics is a multi-dimensional overlay — its framework unifies trend direction, expansion/compression, supply & demand, and momentum structure into one cohesive overlay designed to help traders analyze and stay aligned with the trend.
🆓 This indicator is closed-source to protect the work that went into its development, but it's completely free to use. Enjoy!

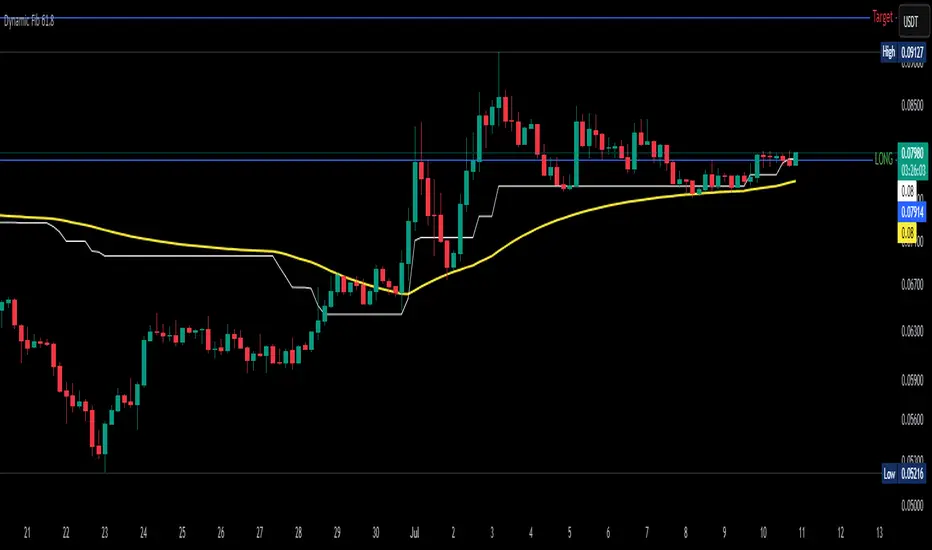
Dynamic Fib 61.8Dynamic Fib 61.8 Indicator – Full Guide
1. Overview
This indicator plots a dynamic 61.8% Fibonacci retracement level, adjusted for market volatility and smoothed using an EMA for cleaner signals. Unlike traditional static Fib levels, this version auto-adjusts based on recent price swings, making it more responsive to changing market conditions.
Key Features:
✅ Auto-Adjusting 61.8% Fib Level – Adapts to the highest high/lowest low over a user-defined period.
✅ EMA Smoothing – Reduces noise for more reliable support/resistance.
✅ Breakout Alerts – Built-in alerts for when price crosses the Fib level.
✅ Inverse Chart Support – Works on both regular and inverse price scales.
2. How to Use This Indicator
Primary Use Case:
Trend Retracement Entry: The 61.8% level often acts as a reversal zone in trending markets.
Breakout Confirmation: A decisive close above/below the smoothed Fib level suggests trend continuation.
Support/Resistance Flip: Watch for price reactions at this level for intraday/swing trades.
Input Parameters:
Input Default Description
Lookback Period 52 Determines how far back the highest high/lowest low is calculated. Higher = slower reaction, lower = more sensitive.
EMA Smoothing 3 Controls how much the Fib level is smoothed (higher = smoother but laggier).
Invert Price Scale Off Flips the calculation for inverse charts (e.g., for crypto perpetuals).
3. Interpretation & Trading Rules
Bullish Scenario (Buy Dips):
Price retraces to the smoothed Fib 61.8 level in an uptrend.
Confirmation: Wait for bullish candlestick patterns (hammer, engulfing) or RSI > 50.
Entry: Long on a bounce, stop-loss below recent swing low.
Bearish Scenario (Sell Rallies):
Price retraces to the smoothed Fib 61.8 level in a downtrend.
Confirmation: Bearish rejection (shooting star, bearish engulfing) or RSI < 50.
Entry: Short on rejection, stop-loss above recent swing high.
Breakout Trading:
If price closes decisively above/below the smoothed Fib level, it may signal trend continuation.
Volume & Momentum Confirmation: Use with MACD/RSI for stronger signals.
4. Best Confluence Indicators
This indicator works best when combined with:
A. Momentum Oscillators
RSI (14):
Look for oversold (RSI < 30) near Fib support in uptrends.
Look for overbought (RSI > 70) near Fib resistance in downtrends.
MACD:
Bullish: MACD crossing above signal line near Fib support.
Bearish: MACD crossing below signal line near Fib resistance.
B. Volume Analysis
Volume Spike + Fib Bounce = Strong Reversal Signal
Low Volume at Fib Retest = Potential Fakeout
C. Moving Averages
50 EMA/200 EMA Alignment:
If price is above 200 EMA and retests Fib 61.8, it’s a high-probability long.
If price is below 200 EMA and rejects Fib 61.8, it’s a high-probability short.
D. Price Action Patterns
Engulfing, Pin Bars, Inside Bars at the Fib level add confirmation.
5. Example Strategy
Setup:
Trend Identification – Price is above 200 EMA (uptrend).
Retracement to Smoothed Fib 61.8 – Price pulls back to the dynamic level.
Confirmation – Bullish hammer forms + RSI > 50.
Entry – Buy with stop below recent swing low.
Target – Previous high or 1.618 Fib extension.
6. Limitations & Adjustments
Choppy Markets: The Fib level may give false signals (use ATR filter).
Optimal Period Adjustment:
For day trading, reduce Lookback Period (e.g., 20-30).
For swing trading, increase (e.g., 50-100).
EMA Smoothing: If too slow, increase smoothing to 5-10.
Final Thoughts
This indicator is best used as a dynamic support/resistance tool rather than a standalone system. Combining it with momentum filters, volume, and price action significantly improves accuracy.
RippleWave Futures-Aware (1:2 RR + Entry Styles)Using 200 EMA with ATR, i created this to have different modes based on entry, basic when the previous open has a less volume than current and price above average then it buys, it would follow similar concept for selling. I have adapted it for Future contracts trading so you can get the ATR value of the Futures.
It also mapped it drawing trades, its a work in progress not prefect

K-Capital Infinity# **K-Capital Infinity – Advanced Multi-Strategy Trading Indicator**
🚀 **Unlock Precision Trading with Smart Trend Detection, Entry Signals & Profit Targets**
The **K-Capital Infinity** indicator is a powerful, all-in-one trading tool designed to help traders identify high-probability trend reversals, confirm entries with multiple filters, and spot optimal take-profit levels. Combining **Supertrend, Keltner Channels, Moving Average Braid Filter, and RSI Exhaustion Signals**, this indicator provides a complete trading system in one script.
---
## **🔹 Key Features**
### **1. Smart Trend Detection**
- **Modified Supertrend** with **Keltner Channel** adaptation for smoother trend identification.
- Adjustable **sensitivity (0.5-10)** to adapt to different market conditions.
- **Colored candles** (green = bullish, red = bearish) for instant trend visualization.
### **2. High-Confirmation Entry Signals**
- **BUY/SELL labels** triggered only when:
- **Supertrend crossover** confirms trend reversal.
- **Braid Filter** (3 MAs) aligns in the correct order with sufficient separation.
- Eliminates false signals by requiring **strong momentum confirmation**.
### **3. Take Profit & Trend Exhaustion Zones**
- **RSI-based TP signals** at key levels:
- **Long TPs:** RSI crosses **30, 20, or 15** ("Sell TP" signals).
- **Short TPs:** RSI crosses **70, 80, or 85** ("Buy TP" signals).
- Helps lock in profits before reversals.
### **4. Multi-Timeframe Momentum Analysis**
- **13 EMAs (15 to 51 periods)** plotted to visualize stacked momentum.
- Optional **EMA Energy** coloring (green if price > EMA, red if below).
### **5. Adaptive Moving Average Filter**
- Choose from **11 MA types** (EMA, DEMA, McGinley, HMA, etc.).
- Adjustable **filter strength** to control signal strictness.
---
## **🔹 How to Use**
### **For Trend Following:**
✅ **Enter LONG** when:
- Price crosses **above Supertrend** (green candles).
- **Braid Filter** shows **MA3 > MA7** with strong separation.
- **"BUY" label** appears below price.
✅ **Enter SHORT** when:
- Price crosses **below Supertrend** (red candles).
- **Braid Filter** shows **MA7 > MA3** with strong separation.
- **"SELL" label** appears above price.
### **For Profit-Taking:**
💰 **Exit LONG** when **"Sell TP"** appears (RSI crosses 30, 20, or 15).
💰 **Exit SHORT** when **"Buy TP"** appears (RSI crosses 70, 80, or 85).
---
## **🔹 Why K-Capital Infinity?**
✔ **Reduces false signals** with **multi-layered confirmation**.
✔ **Works on all timeframes & instruments** (stocks, forex, crypto).
✔ **Customizable** for scalping, swing trading, or long-term investing.
✔ **Clear visual signals** – no guesswork!
📈 **Perfect for traders who want:**
- Reliable trend reversals.
- Confirmed entries with strong momentum.
- Smart profit-taking zones.
---
### **📥 Try It Now & Elevate Your Trading!**
🔹 **Like & Favorite** if you find it useful!
🔹 **Leave a comment** with your feedback or suggestions.
🔹 **Adjust settings** to match your trading style.
**Happy Trading! 🚀**
---
**#Supertrend #KeltnerChannel #RSI #MovingAverages #TradingStrategy #TechnicalAnalysis #ProfitTargets #TrendFollowing**

Multi-EMA with Daily EMA(8,13,21,50,200) OverlayThis indicator shows 8, 13, 21, 50, 200 EMAs on the current timeframe. It also shows the daily 8, 13, 21, 50, 200 EMAs. They can be toggled and this indicator helps intraday traders as they can see the important daily barrier EMAs and is useful for any swing trader who needs this information on shorter timeframes.Basicly i created this indicator for the traders who uses EMAs and Daily EMAs for their analysis, and in this indicator you can use many EMAs whatever you want.
