TrendPilot AI v2 - Swing Trading by MeharTrendPilot AI v2 - Swing Trading by Mehar is a high-performance swing trading system built for traders who want clear trend detection, re-entry opportunities, and visual trade management tools — all in one streamlined indicator.
Combining an ATR-based trailing stop, a dynamic EMA channel, and ADX-powered momentum filters, it helps you trade confidently in trending markets. Whether you're a beginner or an advanced user, this tool is designed to elevate your edge.
🚀 Key Features
📈 Core Trend Engine
• Buy/Sell signals powered by refined ATR Trailing Stop logic
• Trend confirmation via 99 EMA and optional ADX filtering
📊 EMA Channel & Signal System
• 99 EMA channel adds market context and trend strength
• ▲ / ▼ Re-entry signals for stacking during trends
• ⚠️ Weak Signal alerts for early warning — filtered with 150 EMA
🧠 Signal Filtering Modes
• Strict Mode (default): Uses ADX for high-momentum setups
• Relaxed Mode : Focuses on price action, shows more signals
🎯 Visual Trade Management
• Auto SL + TP1, TP2, TP3 plotted on signal
• Risk/Reward zones shaded for clarity
• ✓ marks on TP hits in Live Mode
• Full backtest via Historical Review Mode
🔔 Advanced Alerts
• Alerts for Buy, Sell, Re-entry, Weak Signals, TP hits
• Summary Alert option — clean, emoji-rich format with price + time
⏱️ Recommended Time Frames & Assets
Optimized for 10-min, 15-min, and higher time frames
Perfect for swing trading or structured scalping setups
💎 Best Performance On:
SOL, BTC, ETH, AVAX, LTC, BNB, and other high market cap coins
Also performs well on low-noise FX pairs or trending stocks
📖 How to Use
✅ Identify Trend : Watch for Green (Buy) or Red (Sell) signals
✅ Re-Enter Smartly : Use ▲ or ▼ labels during trend continuation
✅ Watch Weakness : ⚠️ labels hint at fading momentum
✅ Manage Visually : SL/TPs and risk zones guide your exits
Mode Tips:
• Use Strict Mode for high-quality filtered entries
• Use Relaxed Mode to see more opportunities via price action
⚙️ Settings Overview
• EMA Filters: Uses 99 & 150 EMA
• SL/TP Zones: Customizable levels with visual zones
• Alert Suite: Full signal and summary alerts
• Bar Coloring: Trend-based (default) or classic
📬 Support & Suggestions
We welcome feedback and feature ideas!
Contact us via the profile message link below to suggest improvements or ask questions.
⚠️ Disclaimer
This tool is for educational and informational purposes only.
It does not constitute financial advice. Use at your own risk — trading involves capital risk.
Past performance is not a guarantee of future results.
Moving Averages

RibbonsRibbons Indicator
The indicator helps traders quickly identify trend direction and potential trend changes by coloring the area between two EMAs.

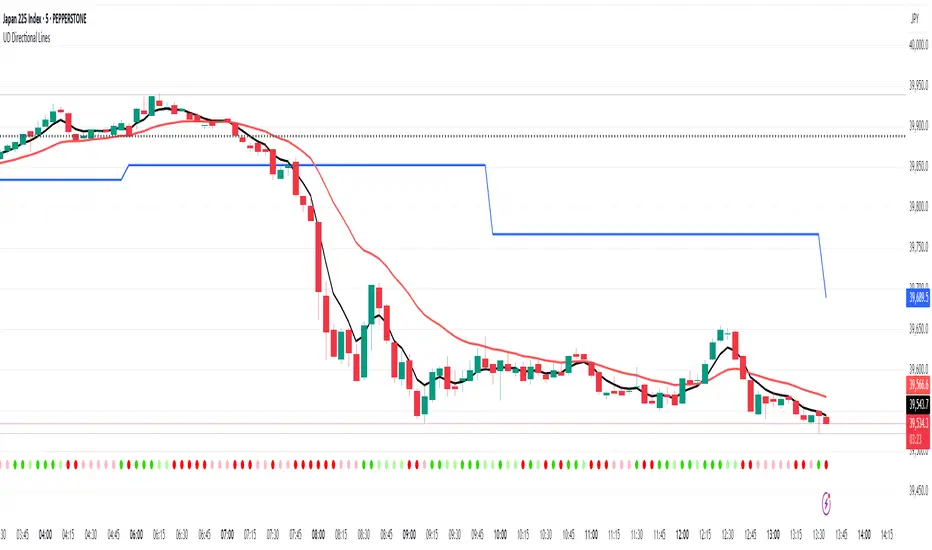
UDI Directional Lines 5/20emaThis indicator uses moving average and macd to determine the direction and momentum of the assets

BanShen MACD Basic[SpeculationLab]This is the basic version of the BanShen MACD indicator.
It includes only two core features: MACD divergence detection and ATR-based stop-loss plotting.
Ideal for users who prefer a clean chart and minimal system load.
⭕️ MACD Divergence Detection
To achieve higher accuracy, three key conditions are used:
The peaks and troughs must be clearly shaped.
The two divergence points should show a significant difference.
The divergence must be consecutive, with no interruptions.
The peak size factor filters out weak signals — by default, the peak must exceed 0.1× the histogram’s standard deviation.
The peak size ratio defines the minimum size difference between two peaks. Divergences with insufficient contrast are automatically filtered.
The noise threshold can be adjusted to ignore minor histogram fluctuations. This setting varies by instrument and defaults to 0 (no filtering).
If two or more consecutive divergences occur, this may indicate a strong mid- to long-term setup. These signals are rare but often high-probability. When enabled, a small arrow will mark the signal on the chart.
⭕️ ATR-Based Dynamic Stop Loss Finder
Assists in visualizing adaptive stop-loss levels.
All parameters, including colors, are fully customizable.
This version is designed for lightweight use and does **not** include additional modules such as RSI/OBV/FVG or Vegas Tunnel.
For the full version, search for “BanShen MACD Ultimate”.
⚠️Disclaimer⚠️
This script is for educational and informational purposes only.
It does not constitute financial advice. Use at your own risk.
这是 BanShen MACD 指标的基础版本。
该版本仅包含两个核心功能:MACD 背离识别 和 基于 ATR 的止损绘制。
适合追求图表简洁、系统资源占用低的用户。
⭕️ MACD 背离识别
为了提高识别准确率,系统采用以下三项条件进行判断:
波峰与波谷的形状需清晰明确;
两个背离点之间必须存在明显的高度差;
背离必须是连续的,中间不能被其他波峰干扰。
参数 peak size factor 用于过滤较弱的信号 —— 默认要求峰值大于 MACD 柱状图标准差的 0.1 倍。
参数 peak size ratio 控制两个波峰之间的最小比例差,若差距不足,则该背离将被自动过滤。
你还可以通过 noise threshold 来忽略柱状图中的轻微噪音。该值与柱状图的高度相关,不同品种之间差异较大,默认设置为 0,表示不过滤任何噪音。
如果系统识别到两次或以上的连续背离,通常代表一个较强的中长线机会。虽然这类信号很少见,但胜率通常较高。启用该功能后,图表上将出现一个小箭头标记提示。
⭕️ 基于 ATR 的动态止损绘制
用于辅助展示动态止损位置。
所有相关参数(包括颜色)均可自由调整。
该版本为轻量化设计,不包含 RSI / OBV / FVG 背离模块及 Vegas 隧道过滤器 等附加功能。
如需完整版本,请搜索 “BanShen MACD Ultimate”。
⚠️免责声明⚠️
本脚本仅供学习与参考使用,不构成任何投资建议。
交易有风险,使用前请自行评估,风险自负。

ADEDA v3ADEDA v3 - Advanced Divergence and Extended Distance Analysis
ADEDA v3 is a versatile TradingView indicator primarily focused on identifying profitable short duration trades by attempting to signal imminent contrarian moves in established price trends. It combines popular technical tools like RSI, MACD, and CCI with unique relativity settings, comparing the current symbol to major index ETFs (SPY, QQQ, IWM, RSP). With customizable trading modes and settings, ADEDA v3 can adapt to various trading styles and markets.
ADEDA v3 overlays five moving averages on your chart and provides visual signals through indicator shapes and detailed tables. It’s designed to help traders of all levels identify overextended market conditions and make informed decisions.
Key Features
Moving Average Analysis:
Plots EMA9, EMA21, EMA34, SMA50, and SMA200. Measures the percentage distance of the price from EMA9 and EMA21 to detect overextension.
Technical Indicators:
Uses RSI, MACD, and optional CCI to confirm signals.
Relativity Settings:
Compares the symbol’s performance to SPY, QQQ, IWM, and RSP using RSI, highlighting overbought or oversold conditions relative to the market.
Customizable Modes:
Offers four modes—Normal, Loose, Strict, and Daytrading—with tailored settings for different strategies.
Volatility Spike Detection (experimental):
Attempts to filter out signals during high volatility periods using ATR and volume analysis, reducing false positives.
Visual Tools:
Displays divergence shapes (! marks) and tables for distances, RSI, and moving average RSI values.
Input Parameters
Customize ADEDA v3 to fit your trading needs with these settings:
Lookback Period (40 default):
Number of bars to calculate historical high absolute distances from EMA9 and EMA21. Increase for more reliability, decrease for faster signals.
Threshold (75 default):
Percentage of the historical high distance that the current distance must exceed to trigger an "extended" signal. Higher values mean fewer, stronger signals.
Mode (Normal default):
Normal: Balanced for most markets.
Loose: More signals, less strict.
Strict: Fewer, high-confidence signals.
Daytrading: Optimized for 5-minute intervals for intraday trading.
CCI Length (20 default):
Adjusts CCI sensitivity (1-2000). *IMPORTANT* -- This setting must be adjusted individually to each symbol for best results.
Use CCI (true default):
Toggle CCI on or off in signal calculations.
Show Divergence Shapes (true default):
Displays buy/sell shapes on the chart.
Show Distance Table (true default):
Shows price distances from EMA9/EMA21 and their status.
Show RSI Table (true default):
Displays RSI of relativities to SPY, QQQ, IWM, RSP.
Show MA RSI Table (true default):
Shows moving averages of relativity RSI values.
Exclude Open & Close (Daytrading) (false default):
In Daytrading mode, skips signals in the first/last 15 minutes of the day.
Relativity Settings:
RSI Length (14): Length for relativity RSI.
MA Length (14): Moving average length for RSI.
Overbought Threshold (70): RSI level for overbought.
Oversold Threshold (35): RSI level for oversold.
Volatility Spike Detection (experimental):
Use Volatility Spike Detection (default false): Enable to filter out signals during periods of high volatility.
ATR Length (8): ATR calculation period.
Baseline Length (50): Baseline for ATR/volume.
ATR Spike Threshold (1.3): Multiplier for ATR spikes.
Volume Spike Threshold (1.2): Multiplier for volume spikes.
How to Interpret Signals
Divergence Shapes:
Downward (!): Potential sell signal (red).
Upward (!): Potential buy signal (green).
Purple (!): Conditions met for 4+ bars. A purple signal indicates unusual momentum/volatility. It is a warning that previous signals have a higher chance of being incorrect/false.
Distance Table:
Shows current distances from EMA9/EMA21 vs. historical highs. "Extended" in red (upside) or green (downside) when the threshold is crossed.
RSI Table:
RSI values for relativities. Red = overbought, green = oversold.
MA RSI Table:
Moving averages of relativity RSI. Same color coding as RSI table.
Volatility Spike:
Red background highlights high volatility periods (if enabled).
Usage Tips
Given the nature of the design of the indicator to signal potential short-term contrarian price action, repeated signaling of overbought or oversold conditions can indicate that the symbol is in a longer-term trend that is opposite to individual signaling. In these cases, intrepid users may use the indicator to execute complementary strategies, e.g. selling short-term covered calls against a long term held position when overbought signals appear.
Also, please keep in mind that ADEDA v3 is not designed to provide exit signaling.
Alerts
Set up alerts in TradingView’s "Alerts" tab:
Current Bar: Triggers on new buy/sell signals.
Last 2 Bars: Triggers if conditions met in the past two bars (great for screeners).
Data Requirements
ADEDA v3 fetches SPY, QQQ, IWM, and RSP data for relativity. These index ETFs have been chosen rather than the indexes themselves as most TradingView users should have access to price data for these ETFs without extra add-ons.
Legal Disclaimer
This script is provided "as is," without any warranties or guarantees of any kind, either express or implied. The author is not a financial advisor, and this script should not be considered financial advice. Users are solely responsible for their own trading decisions and should not rely on this script as the basis for any financial actions. The author shall not be held liable for any losses, damages, or claims arising from the use of this script. By using this script, you agree to assume all risks associated with its use and hold the author harmless from any consequences that may result.

Adaptive Increment SuperTrendThe Adaptive Increment Supertrend a perpetual Trend Following indicator that aims to give faster & more reliable signals relative to the popular TradingView in-built SuperTrend.
Here is a quick visual representation of that difference, and why the AI SuperTrend is a superior version of the classical SuperTrend:
How does the indicator work?
The Adaptive Increment SuperTrend works like so:
1. Find the MA value (this can be WMA, SMA, HMA...)
- This will be the base of the indicator
2. Use For Loop function for finding out the "Boost" Values
- This will be used for figuring out the band distance
3. Find the MATR Value:
- Calculate the ATR and then find the median of it over X period
4. Calculate Lower and Upper Bands
And BOOM! The AI SuperTrend has come to life!
Plotting
The indicator plots a glowing line that will represent the value the candle would have to cross in order to trigger a trend reversel.
The line is than colored where
Bright Green Color => Uptrend
Bright Red Color => Downtrend
Watch out that this indicator is not perfect and investing uppon the data it provides can cause losses of capital
I hope you all will find some good use of this indicator, and wish you all the best of luck!

PTL - Perfect Trend Line [UTS]📈 PTL – Perfect Trendline
📝 Description
The PTL (Perfect Trendline) indicator automatically detects and draws precise trendlines connecting key swing highs and lows to visualize the market’s true direction. It serves as a confirmation and filtering tool, helping traders validate trends, avoid false breakouts, and improve trade accuracy. Designed for simplicity and clarity, PTL enhances discipline by signaling reliable support/resistance and trend strength.
🔧 How to Use
Use PTL primarily to confirm trend direction before trade entries and exits.
Watch for price respecting or breaking PTL trendlines as validation of momentum.
Combine PTL with volume and momentum indicators for stronger trade signals.
Avoid premature entries by waiting for confirmed PTL breakout or bounce signals.
Works across multiple timeframes to support both short-term and long-term strategies.
🎯 Best Use Cases
• Trend Detection & bias identification
• Entry Confirmation — wait for trend flip with different color fill
• Exit Management — wait for trend flip with different color fill
⚙️ Features
• Automatic high-probability trendline detection from swing points
• Dynamic, real-time updating trendlines reflecting current market structure
• Minimizes false signals and noise for increased trader confidence
• Clean, minimalist visual style optimized for easy interpretation
• Customizable alert system on trendline touches and confirmed breaks
🔔 Alerts
• “Long Signal” — fires once when trend flips bullish
• “Short Signal” — fires once when trend flips bearish
Create alerts via the “Add Alert” dialog and select the appropriate signal.
📝 About
• Pine Script®: v6
• Created: 2025-07-04
⚠️ Disclaimer
This indicator is a tool for confirmation and should be combined with your own analysis and risk management. It does not guarantee profitable trades.

HMG MA ZonesIt provides zones of possible peaks and troughs. It is an indicator that might show up at a possible top or bottom. It could be used as an overbought or oversold signal. Does Not necessarily mean that the price is topping or bottoming. It could be used to identify a point of time from where the existing momentum might not be sustainable as much.

MCDX GCGolden Cross will appear when Uptrend begins
If yellow triangle appear, can enter price near support area
This is just a guide. Any trading decision making is under you own risk management

Angular Volatility📘 Angular Volatility – Technical Indicator for Trend Intensity Analysis
Angular Volatility is an advanced technical analysis tool developed specifically for cryptocurrency markets on the Binance platform. Its primary objective is to detect structural shifts in price dynamics with greater precision by analyzing the combined behavior of market volume and the angular slope of a customizable moving average.
Unlike conventional indicators that operate directly over the price chart, this script displays all of its metrics within a dedicated secondary window, allowing a cleaner and more isolated view of critical movements such as acceleration, pause, or potential reversals. In addition, it includes a robust system for volatility intensity classification, automated alerts, and a live technical info table that summarizes key real-time values.
🎯 What does Angular Volatility analyze?
Angular Volatility measures the interaction between traded volume and the angle of a moving average selected by the user from six types (SMA, EMA, WMA, HMA, ALMA, and SWMA). From these variables, the system generates:
- Angular Volatility Index: A composite value representing the product of volume and angular slope, reflecting the true strength behind a move.
- Angular Oscillator: A standalone line that displays the directional angle (in degrees) of the selected moving average, limited between ±90°.
- Volatility Intensity Levels: Automatic classification of peaks into four levels—moderate, elevated, high, and extreme—displayed with distinct colors and geometric shapes.
- Technical Data Table: A real-time panel showing both the current angle of the moving average and the current value of the Angular Volatility Index in a compact, user-friendly format.
- Custom Alerts System: Five built-in alert conditions allow users to monitor key volatility events without needing to watch the chart constantly.
⚙️ Configuration Parameters
The script includes multiple configuration sections that allow users to fine-tune both its analytical precision and visual appearance:
- High Volume Detection: Adjustable historical depth and sensitivity to identify significant volume spikes.
- Initial Moving Average Settings: Selection of MA type, length, offset, and dynamic coloring based on slope angle.
- Volatility Index Options: Fully customizable visuals, synced with the angle values set in the moving average section.
- Volatile Intensity Styling: Choose which levels to display, customize their colors and icons, and optionally color the main chart candles for quick interpretation.
- Information Table: Options to show/hide the table, adjust size and position, and customize background/text colors.
🧠 Compatibility and Technical Recommendations
This indicator was developed to operate exclusively on Binance using the following timeframes only: 1m – 5m – 15m – 30m – 1h – 4h – 1D.
This restriction is deliberate, ensuring consistency in the mathematical model used to calculate angular data. Using this script on other platforms or timeframes may result in inaccurate readings or logic errors, as asset types like stocks, forex, or indices behave differently in terms of volume structure and slope normalization.
If applied to unsupported markets or timeframes, the script will automatically display a warning message without calculating or drawing technical values.
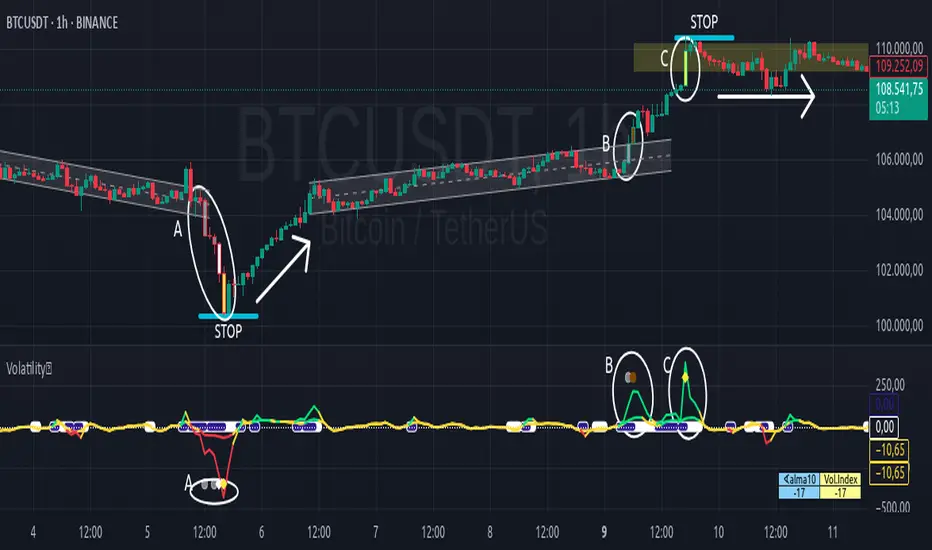
🔬 Practical Example
The following case study—applied to the BTC chart on a 1-hour timeframe—demonstrates how volatility intensity levels behave in structured scenarios such as channel breakdowns, rebound phases, false breakouts, and high-energy consolidation zones:
🔻 Letter A: Downward breakout and full intensity sequence
- The price was moving within a fairly uniform descending channel, which ends with a false breakout to the upside—quickly invalidated as a market trap.
- The true breakout occurs to the downside through a strong red candle, categorized by the system as moderate intensity (gray).
- This candle is followed by a Doji, then a smaller red candle also marked as moderate intensity, followed by a larger red candle showing high intensity (white), and finally a stronger red candle painted yellow, indicating extreme intensity.
- This full sequence (moderate → moderate → high → extreme) marks a technical climax, after which the price begins a progressive reversal.
- Although the drop unfolds over five red candles, the subsequent recovery takes place over 18 candles, mostly green and smaller in size, forming a “V” shape: sharp decline followed by a steady upward climb.
- This entire section is enclosed within an oval labeled A, with the four intensity levels clearly reflected on both the main chart and the Angular Volatility panel.
🔼 Letter B: Ascending channel and breakout with increasing bullish pressure
- After the rebound described in section A, the price begins forming a new ascending channel, marked with the letter B. This channel starts right where the previous range ends, with a very slight upward offset—nearly indistinguishable.
- In the final stage of this channel, a green candle classified as moderate intensity (gray) attempts a breakout. It is followed by a stronger green candle, painted brown, indicating elevated intensity and confirming bullish acceleration.
- Both candles and the corresponding peak on the Angular Volatility indicator are enclosed in an oval labeled B, representing a second wave of directional energy.
⛓️ Letter C: Resistance zone and consolidation following extreme volatility
- The upward movement continues until it reaches a resistance level, where a large green candle emerges, painted yellow to denote extreme intensity.
- Unlike the previous case in section A, this movement does not trigger a sharp reversal, but rather a technical pause followed by sideways consolidation, forming a horizontal range.
- This zone is marked on the chart with an oval labeled C, representing a classic case of stopping volume and range formation.
5/21 EMA Crossover AlertThis is a basic indicator which shows when the 5 EMA crosses through the 21 indicating a possible buy or sell signal. remember, this is only an indicator—indicators indicate and the mroe indicators you have, the more confirmation you may find...all to say, don't just rely on any one "holy grail" indicator.

[GalihRidha] Scalping Dashboard 5m Scalping Dashboard 5m is a practical, real-time, and user-friendly indicator designed for 5-minute intraday scalping strategies. This indicator provides clear, actionable signals along with dynamic risk management levels, all visualized in a single vertical dashboard on your chart.
Key Features:
Actionable Next Signal:
Generates a strong, easy-to-follow trading signal ("LONG" or "SHORT") every 5 minutes, based on a multi-factor algorithm (MA20/MA50 trend, RSI, price/volume strength, candle momentum, and market structure).
Dynamic TP/SL Calculation:
Automatically displays recommended Take Profit (TP) and Stop Loss (SL) price ranges, calculated from recent price action, support/resistance, and volatility (ATR).
Vertical Dashboard Layout:
Information is neatly split between "LAST SECTION" (your most recent executed signal, TP, and SL) and "NEXT SECTION" (real-time signal, recommended TP/SL, and current price). Perfectly formatted for both desktop and mobile TradingView use.
Live "Capturing" Status:
When a new signal is forming (1 minute before candle close), the dashboard shows an animated "Capturing..." status—so you always know when the indicator is preparing the next actionable trade.
Buffered Signal Logic:
Prevents “signal repainting” by ensuring that your "Last Signal" and TP/SL levels are exactly what was shown in the previous Next Signal, never the recalculated value from a new bar. This is vital for honest backtesting and live trade confidence.
Zero Lag, Mobile Ready:
Designed to be lightweight and responsive, with instant dashboard updates and no visual lag—even on slower connections or when switching timeframes.
No repaint, no lagging, pure price action + volatility logic.
How to Use:
Add to Chart
Apply the indicator to any liquid crypto or forex pair on the 5-minute (5m) timeframe.
Watch the Dashboard
1 minute before the close of each 5-minute candle, the "Next Signal" section will activate.
"Capturing..." status (with animated dots) means a new entry signal is forming.
Use the suggested Entry, TP Range, and SL for your scalping strategy.
Follow the Signal
When "Next Signal" appears, you have 1 minute to enter the trade if desired.
After the signal passes, the values are locked into the "Last Section" for reference, record-keeping, or trade management.
Mobile Friendly
The vertical format ensures the dashboard is always visible and readable on both web and mobile versions of TradingView.
No need to manually refresh or guess when a new signal is forming—just watch for "Capturing..."!
Best Practice & Tips:
For best results, use on trending or high-volume assets. Avoid low liquidity or choppy sideways markets.
Combine with your own risk management and execution strategy for maximum performance.
This dashboard is 100% Pine Script v5, fully open-source, and does not repaint. You can customize TP/SL logic or integrate with alerts for even more automation.
Why This Indicator?
Most scalping indicators provide signals, but don't show you the real, actionable context—especially in mobile or fast-moving markets.
This dashboard solves that problem by giving you everything you need for quick, clear, and confident trading—all in one place, with true buffer logic so your entries and results are always honest and reproducible.
Happy scalping and stay disciplined—let the dashboard do the heavy lifting for you! 🚀

TMIVIPThe TMIVIP indicator is a custom trading signal generator that combines Bollinger Bands with a 66-period Exponential Moving Average (EMA) to identify high-probability buy and sell opportunities. This indicator is designed to detect mean-reversion signals when price action sweeps beyond Bollinger Band boundaries and recovers, while confirming trend direction using the 66 EMA filter

Angles and DerivativesAngles and Derivatives
Calculates and plots three smoothed angular derivatives of a chosen price or indicator series.
Inputs:
Source series (EMA, SMA, WMA, VWMA, HMA, RSI, CCI, ATR, CMO, ROC)
Period length (integer)

BskLAB - Signals Assistant 🧠 BSKLab Signal Assistant – Full Description & Usage Guide
BSKLab Signal Assistant is a multi-strategy signal framework developed for traders seeking precise, filtered entries across different market conditions. Rather than being a simple combination of classic indicators, this script integrates custom-built tools and dynamic overlays that work synergistically to improve signal quality and reduce false entries.
It offers two distinct modes — Swing and Following — each designed with its own core logic, ensuring flexibility for traders whether they focus on reversals or trend-following strategies.
🌀 Mode 1: Swing (Reversal-Based Entries)
Objective: Detect price exhaustion and reversal zones.
This mode uses a custom TMA-based dynamic zone system (“Zone Style”) to define potential reversal areas. When price breaks below/above this zone and the Bollinger Band boundary, it suggests overextension. A confirmation from SuperTrend ensures that the price is not just bouncing but showing true directional momentum.
📌 Why this combination?
Each component plays a role:
Zone Style = defines reversal structure dynamically based on recent volatility.
Bollinger Bands = detects price extremes (OB/OS).
SuperTrend = filters noise with momentum confirmation.
🟢 Buy Logic:
Price closes below Zone Style and lower Bollinger Band
Then rebounds upward
SuperTrend shifts to bullish
🔴 Sell Logic:
Price closes above Zone Style and upper Bollinger Band
Then reverses down
SuperTrend shifts to bearish
✅ This helps traders avoid false breakouts or fake reversals in ranging markets.
Enhancing Swing Trade Accuracy with BSKLab - MoneyFlow X (Volume Momentum)
In Swing Trading Mode, we aim to catch price reversals after the market moves beyond extreme zones (TMA-based support/resistance). To avoid premature entries or false reversals, it’s highly recommended to confirm signals using BSKLab - MoneyFlow X in Volume Momentum mode.
📈 Mode 2: Following (Trend-Following System)
Objective: Trade only in the direction of the dominant market trend.
This mode replaces the reversal logic with a trend-filtering mechanism using BskLAB Cloud, a custom-modified version of Ichimoku Cloud. It scores trend strength using ATR-multiplied zones and offers 3 levels of confirmation strictness (Lv1–Lv3).
📌 Why this combination?
BskLAB Cloud provides a structured, flexible trend confirmation.
Bollinger Bands help detect entries during trend pullbacks or breakouts.
SuperTrend (optional) supports directional momentum validation.
🟢 Buy Logic:
Cloud confirms bullish trend (based on level)
Price breaks above Bollinger Band midline or upper zone
Entry is allowed only in the direction of the trend
🔴 Sell Logic:
Cloud confirms bearish trend
Price breaks below midline or lower Bollinger Band zone
✅ Perfect for momentum traders who want to stay in the direction of trend and avoid early reversals.
Advanced Confirmation with Volume Momentum (BSKLab - MoneyFlow X)
Improving Trend Signal Accuracy with BSKLab - MoneyFlow X
To increase confidence in each entry, we recommend using this trend-following mode together with the
BSKLab - MoneyFlow X indicator, set to Volume Momentum mode.
✅ How to use together:
Wait for a valid Buy/Sell signal from the Trend-Following Mode
Check volume reaction on MoneyFlow X:
🟢 Strong green spike = bullish momentum = confirms Buy
🔴 Strong red spike = bearish momentum = confirms Sell
🧩 Component Breakdown & Why They Work Together
📍 Zone Style (TMA + ATR Overlay)
A custom dynamic support/resistance zone using Triangular Moving Average with ATR-based width adjustment. It expands or contracts based on market volatility — making reversal zones adaptive to current conditions.
Prevents entries when price is in the middle of a range
Acts as a volatility filter, removing "weak" signals
☁️ BskLAB Cloud (Custom Ichimoku)
A custom trend engine adapted from Ichimoku Cloud. Uses ATR-weighted midlines to define trend strength with 3 adjustable strictness levels.
Used only in Following Mode
Avoids trendless/noise zones
Helps traders stay aligned with the macro trend
📊 Bollinger Band Behavior
Used in all modes, but especially in Swing and following, to detect overbought/oversold zones.
Provides clear statistical boundaries
Combines well with SuperTrend to detect exhaustion
✅ SuperTrend Confirmation
A momentum-based filter using ATR-based trailing stop logic.
Filters fake reversals
Confirms breakout direction
Used across all modes for high-accuracy entries
🔥 BSKLab Signal Assistant isn’t just another mashup of public indicators — it’s a purpose-built trading framework crafted for real market conditions.
Instead of throwing signals on every move, it combines structure, momentum, volatility, and trend filters to deliver clean, high-conviction entries.
📍 RISK DISCLAIMER
Trading involves significant risk and is not suitable for everyone. All tools, scripts, and educational materials provided by BSKLab are for informational and educational purposes only. We do not offer financial advice.
Past performance does not guarantee future results. Always trade responsibly
📍 CONCLUSION
At BSKLab, we believe that consistent trading success doesn't come from indicators alone — it comes from the trader’s ability to apply them with context, discipline, and understanding. Tools are only as powerful as the hands they’re in.
The goal of the BSKLab Signal Assistant is not to provide magic signals, but to empower traders with a clean, adaptive, and intelligent framework that helps identify high-probability opportunities while filtering out the noise.
Whether you’re a beginner or experienced trader, this tool is designed to support real decisions in real markets — not just theory.
You can request access below to join the BSKLab system and unlock our full trading suite.

TRIPLE Moving AveragesThis Pine Script indicator plots three customizable moving averages (MAs) along with an optional composite MA (average of all three). It provides visual cues, alerts, and trend confirmation based on MA crossovers and price positioning relative to the MAs.
🔹 Key Features
1. Multiple Moving Average Types
Supports 7 different MA types for each line:
EMA (Exponential Moving Average)
SMA (Simple Moving Average)
SMMA / RMA (Smoothed / Regular Moving Average)
WMA (Weighted Moving Average)
VWMA (Volume Weighted Moving Average)
HMA (Hull Moving Average)
2. Three Independent MAs
MA1, MA2, MA3 can each be enabled/disabled
Custom lengths (default: 12, 21, 50)
Different price sources (close, open, high, low, etc.)
3. Composite Moving Average (Optional)
Calculates (MA1 + MA2 + MA3) / 3
Acts as a consensus trend filter
4. Visual & Alert Features
✅ Color-Coded Lines (Yellow = Price Above MA, Red = Price Below MA)
✅ Thick Line Width (3) for better visibility
✅ Background Highlights for crossovers/crossunders
✅ Alerts for All Crossover Combinations
🔹 How It Works
📈 MA Crossovers & Trend Signals
Bullish Signal: When a faster MA crosses above a slower MA
Bearish Signal: When a faster MA crosses below a slower MA
Trend Confirmation: All MAs aligned in the same direction (e.g., MA1 > MA2 > MA3 = Strong Uptrend)
🎨 Visual Indicators
Green Background → Bullish crossover detected
Red Background → Bearish crossover detected
Yellow Line → Price is above the MA (bullish)
Red Line → Price is below the MA (bearish)
🔔 Alert Conditions
Alerts are triggered for all possible MA crossover combinations, including:
MA1 crossing MA2
MA1 crossing MA3
MA2 crossing MA3
Any MA crossing the Composite MA

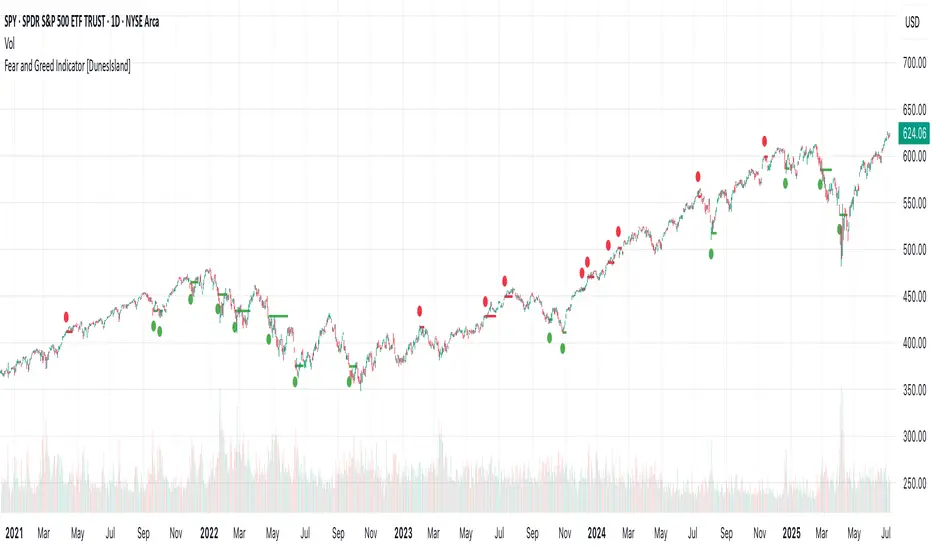
Fear and Greed Indicator [DunesIsland]The Fear and Greed Indicator is a TradingView indicator that measures market sentiment using five metrics. It displays:
Tiny green circles below candles when the market is in "Extreme Fear" (index ≤ 25), signalling potential buys.
Tiny red circles above candles when the market is in "Greed" (index > 75), indicating potential sells.
Purpose: Helps traders spot market extremes for contrarian trading opportunities.Components (each weighted 20%):
Market Momentum: S&P 500 (SPX) vs. its 125-day SMA, normalized over 252 days.
Stock Price Strength: Net NYSE 52-week highs (INDEX:HIGN) minus lows (INDEX:LOWN), normalized.
Put/Call Ratio: 5-day SMA of Put/Call Ratio (USI:PC).
Market Volatility: VIX (VIX), inverted and normalized.
Stochastic RSI: 14-period RSI on SPX with 3-period Stochastic SMA.
Alerts:
Buy: Index ≤ 25 ("Extreme Fear - Potential Buy").
Sell: Index > 75 ("Greed - Potential Sell").
EMA-Pack MTFEMA-Pack MTF
This TradingView Pine Script defines a custom indicator called "EMA-Pack MTF" that overlays various types of moving averages and Bollinger Bands across multiple timeframes on a chart. It begins by importing the built-in technical analysis library and defining a custom ma function that calculates several types of moving averages (SMA, EMA, TEMA, DEMA, HMA, and ALMA) based on user input. The ema function is the core logic, retrieving market data for the specified timeframe and calculating fast, mid, slow, 50, 100, and 200-period moving averages along with Bollinger Band components (basis, upper, and lower bands). The function adjusts values to the nearest valid price tick and returns them.
User input fields allow customization of timeframes, source data, moving average types, and Bollinger Band parameters. The script calls the ema function for each selected timeframe (1 minute, 5 minutes, 15 minutes, 1 hour, 4 hours, and 1 day), storing their respective computed values. It then plots the calculated moving averages and Bollinger Band basis lines on the chart, using different colors and line widths to distinguish between them. Some plots are hidden by default (display.none) to reduce chart clutter. This script is useful for multi-timeframe trend analysis using customizable moving averages and Bollinger Bands.

Super Neema!🟧 Super Neema! — Multi-Timeframe EMA-9 Overlay
🔍 What is "Neema"?
The term "Neema" has recently emerged among traders such as Jeff Holden—a top proprietary trading firm trader—whose colleagues colloquially use "Neema" as shorthand for the 9-period Exponential Moving Average (EMA). Due to its increasing popularity and reliability, the phrase caught on quickly as traders needed a quick, memorable name for such an essential tool.
📚 Why the 9-EMA?
Scalping around the 9-EMA is now one of the most widely used intraday trading techniques. Traders of various experience levels frequently rely on it because it effectively highlights short-term momentum shifts.
But there's a crucial nuance: traders across different assets or market periods don't always agree on which timeframe’s 9-EMA to follow. Depending on who's currently active in the market, the dominant "Neema" could be the 1-minute, 2-minute, 3-minute, or 5-minute 9-EMA. This variation arises naturally due to differences in trader populations, risk tolerance, style, and current market conditions.
👥 Social Convention & Normative Social Influence
Trading is fundamentally a social activity, and normative social influence plays a critical role in market behavior. Traders don’t operate in isolation; they follow patterns, respond to cues, and rely on shared conventions. The popularity of any given indicator—like the 9-EMA—is not just technical, but deeply social. Traders adapt to what's socially accepted, recognizable, and effective.
Over time, these conventions shift. What once was "the standard" timeframe can subtly evolve as dominant traders or institutions shift their preferred style or timeframe, creating "variants" of established trends. Understanding this dynamic is essential for market participants because recognizing where the majority of traders currently focus gives a critical edge.
📈 Why Does This Matter? (Market Evolution & Trader Adaptability)
Market trends aren't just technical—they're social constructs. As markets evolve, participants adapt their methods to fit new norms. Traders who recognize and adapt quickly to these evolving norms gain a decisive advantage.
By clearly visualizing multiple Neemas (9-EMAs across timeframes) simultaneously, you don't merely see EMA levels—you visually sense the current social convention of the market. This heightened awareness helps you stay adaptive and flexible, aligning your strategy dynamically with the broader community of traders.
🎨 Transparency Scheme (Visual Identification):
5-minute Neema: Most opaque, brightest line (slowest, most significant trend)
3-minute Neema: Slightly more transparent
2-minute Neema: Even more transparent
1-minute Neema: Most transparent, subtle background hint (fastest, quickest reaction)
This deliberate visual hierarchy makes it intuitive to identify immediately which timeframe is currently dominant, and therefore, which timeframe other traders are using most actively.
✅ Works on:
Any timeframe, any chart. Automatically plots the 1m–5m EMA-9 lines regardless of your current chart.
🧠 Key Insight:
Markets are driven by social trends and normative influence.
Identifying the currently dominant timeframe (the Neema most respected by traders at that moment) is a powerful, socially-informed edge.
Trader adaptability isn't just technical—it's social awareness in action.
Enjoy your trading, and welcome to Super Neema! ⚡

The Frendicator#1 Indicator for all Frens
This indicator was made for the one and only Master Fren
This indicator revolves around two things: Time and Price
This indicator also splits days into easy to understand segments!

ma rationing🧠 MA Rationing Indicator – Multi-Averaged Momentum + Divergence Zones
This script blends various moving average ratios (SMA, EMA, WMA, RMA) to create a smoothed and zero-centered momentum oscillator. Its goal is to highlight shifts in trend strength and spot possible divergences confirmed by volume.
🔍 Key Features:
• MA Ratio Core: Composite of multiple MA types across a short vs. long smoothing window, plotted against zero for trend clarity.
• Visual Acceleration Markers: Circle color intensity reflects momentum acceleration or deceleration.
• Volume-Supported Divergence: Highlights when price diverges from momentum and volume supports the signal.
• RSI Zone Highlighting: Dynamically draws boxes over RSI Overbought/Oversold regions as sentiment zones form.
• Custom Alerts: Includes alerts for zero-line crosses and divergence + volume confirmation.
This tool is designed for users seeking to combine price action, momentum, and volume into one clear visualization. It does not provide direct trade signals and should be used alongside your broader analysis.

HTF EMAs (20–400) with Single Labels✅ Benefits of This Indicator
📊 1. Multi-Timeframe Awareness
You can watch higher timeframe trend directions (e.g., 4H or 1D) while trading on lower timeframes like 5M or 15M — a critical edge in trading.
🧭 2. Trend Confirmation
If price is above all HTF EMAs, it's a strong uptrend.
If price is below, it's a strong downtrend.
EMA crossovers (e.g., 20 over 200) often indicate trend shifts.
🧹 3. Clutter-Free Display
Only one set of right-end labels keeps your chart clean and easy to interpret — helpful for scalpers and intraday traders.
🎯 4. Dynamic Support/Resistance
Higher timeframe EMAs often act as strong support or resistance, especially EMA 200 and EMA 400.
🔧 5. Customizable Timeframe
You can track EMAs from any higher timeframe (e.g., Daily, 4H, 1H) while staying on your preferred execution chart.
🖥️ How to Use
Apply on a lower timeframe chart (e.g., 5M).
Set the HTF input to your preferred higher timeframe (default is 4H).
Use the EMAs as:
Dynamic support/resistance
Trend filters (only take longs above EMAs, shorts below)
Reversal zones if price reaches EMA 400 or 200.
