MULTI INDICATOR BY DEEPANINDIAThis TradingView strategy combines EMA, SuperTrend, and swing high/low to identify trend breakouts. A long trade is triggered when the previous candle closes above the EMA High and the current candle breaks the prior high. A short trade occurs (if not in Long Only mode) when the opposite happens with the EMA Low. The SuperTrend confirms trend direction, while swing points act as dynamic stop-loss levels. The script includes customizable inputs for EMA lengths, SuperTrend settings, and swing lookback. It helps traders capture strong trends with defined entries and exits using a rules-based, multi-indicator approach.
Moving Averages

Single EMA Buy/Sell + Touch + Alerts + Signal Candle Colorsthis is pure buy sell indicator based on ema
you'll use this with the help of volume
risk reward ratio 1:1.5

Smooth MTF CloudsThe smoothness of the "clouds" in the script you provided comes from the combination of plotting moving averages (typically EMA or SMA) and using the fill() function to visually create smooth, overlapping areas between two lines. Additionally, EMAs naturally create smoother curves as they respond to price changes in a lagged, less abrupt way compared to traditional plots.

VWMA + ML RSI StrategyVWMA + ML RSI Strategy
This strategy combines the power of Volume-Weighted Moving Average (VWMA) with a Machine Learning-enhanced RSI to generate high-probability long entries.
✅ Buy Logic:
A buy signal is triggered when:
The candle closes above the VWMA
The ML RSI (smoothed using advanced moving averages) is above 60
If only one of the above conditions is met, the strategy waits for the second to confirm before entering.
❌ Sell Logic:
The position is closed when:
The candle closes below the VWMA, and
The ML RSI falls below 40
🎯 Risk Management:
Take Profit: 1.5% above entry
Stop Loss: 1.5% below entry
🤖 ML RSI Explanation:
The ML RSI is a refined version of the traditional RSI using smoothing techniques (like ALMA, EMA, etc.) to reduce noise and enhance responsiveness to price action. It helps filter out weak signals and improves trend confirmation.
🔧 Customization:
Adjustable VWMA length
Configurable ML RSI smoothing method, length, and ALMA sigma
Thresholds for entry/exit RSI levels

Sistema de Trading Juan José - Cruce de EMAs + SMA + RSICruce de EMas + SMA +RSI para determinar los puntos de entrada y salida

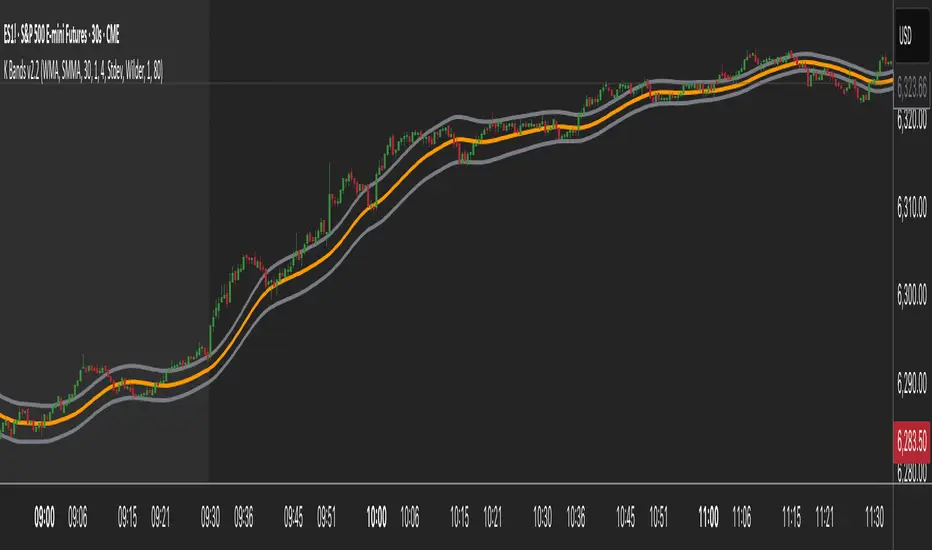
K Bands v2.2K Bands v2 - Settings Breakdown (Timeframe Agnostic)
K Bands v2 is an adaptive volatility envelope tool designed for flexibility across different trading
styles and timeframes.
The settings below allow complete control over how the bands are constructed, smoothed, and how
they respond to market volatility.
1. Upstream MA Type
Controls the core smoothing applied to price before calculating the bands.
Options:
- EMA: Fast, responsive, reacts quickly to price changes.
- SMA: Classic moving average, slower but provides stability.
- Hull: Ultra smooth, reduces noise significantly but may react differently to choppy conditions.
- GeoMean: Geometric mean smoothing, creates a unique, slightly smoother line.
- SMMA: Wilder-style smoothing, balances noise reduction and responsiveness.
- WMA: Weighted Moving Average, emphasizes recent price action for sharper responsiveness.
2. Smoothing Length
Lookback period for the upstream moving average.
- Lower values: Faster reaction, captures short-term shifts.
- Higher values: Smoother trend depiction, filters out noise.
3. Multiplier
Determines the width of the bands relative to calculated volatility.
- Lower multiplier: Tighter bands, more signals, but increased false breakouts.
- Higher multiplier: Wider bands, fewer false signals, more conservative.
4. Downstream MA Type
Applies final smoothing to the band plots after initial calculation.
Same options as Upstream MA.
5. Downstream Smoothing Length
Lookback period for downstream smoothing.
- Lower: More responsive bands.
- Higher: Smoother, visually cleaner bands.
6. Band Width Source
Selects the method used to calculate band width based on market volatility.
Options:
- ATR (Average True Range): Smooth, stable bands based on price range expansion.
- Stdev (Standard Deviation): More reactive bands highlighting short-term volatility spikes.
7. ATR Smoothing Type
Controls how the ATR or Stdev value is smoothed before applying to band width.
Options:
- Wilder: Classic, stable smoothing.
- SMA: Simple moving average smoothing.
- EMA: Faster, more reactive smoothing.
- Hull: Ultra-smooth, noise-reducing smoothing.
- GeoMean: Geometric mean smoothing.
8. ATR Length
Lookback period for smoothing the volatility measurement (ATR or Stdev).
- Lower: More reactive bands, captures quick shifts.
- Higher: Smoother, more stable bands.
9. Dynamic Multiplier Based on Volatility
Allows the band multiplier to adapt automatically to changes in market volatility.
- ON: Bands expand during high volatility and contract during low volatility.
- OFF: Bands remain fixed based on the set multiplier.
10. Dynamic Multiplier Sensitivity
Controls how aggressively the dynamic multiplier responds to volatility changes.
- Lower values: Subtle adjustments.
- Higher values: More aggressive band expansion/contraction.
K Bands v2 is designed to be adaptable across any market or timeframe, helping visualize price
structure, trend, and volatility behavior.
Volume Spikes with EMA LabelVolume Spikes with EMA Label (by Emilio TRIUNFO)
Highlights significant volume surges by comparing real-time volume against a customizable EMA threshold multiplied by 1.5 (default).
Visually marks high-volume bars with colored labels on the chart to help identify strong market activity and trading opportunities.
Adjustable EMA length and multiplier allow flexibility for different strategies.

Improved Breakout-Retest Strategy (5M Entry)This strategy combines the strength of a higher timeframe structure with precision 5-minute entries. It identifies consolidation zones on the 4H chart, waits for a strong breakout in the direction of the trend, and then enters on a retest confirmed by an engulfing candle on the 5-minute timeframe. A 200 EMA filter ensures trades align with the dominant trend, while a strict 1:3 risk-to-reward ratio maximizes profitability. It's designed to reduce false breakouts and optimize small account growth with tight stop losses and high probability setups during active trading hours.

10/21 EMA Cross10/21 EMA crossover and crossunder indicator. Not timeframe specific. Shows a small arrow at top and bottom of the chart indicating the crossover has occurred.

5,8,10,13 EMA Cluster CrossThis is a rough cross signal or signals for the 5,8,10,13 emas to be bullish or bearish, a secondary caution indicator is programed in for the 5,8,10 cross like a yellow caution light. This is not timeframe specific and this indicator is meant to show momentum changes near pivotal points.
Any updates and improvement welcome.

MACD HTF Crossover SignalsHigher time frame MACD, I like it
/
/
/
/
Trading view wants me to elaborate so in my opinion indicators on higher time frames work better on smaller time frames. Good

EMAs + LSMA Cross Alert (Mejorado)his indicator is designed to identify buy and sell signals based on the behavior of multiple exponential moving averages (EMAs) and a Least Squares Moving Average (LSMA). It includes 5 EMAs and one LSMA, with visual and alert features.
📌 Components:
EMA 4 (purple)
EMA 9 (Fuchsia)
EMA 21 (blue)
EMA 50 (Green)
EMA 200 (maroon)
LSMA 30 (Orange)
🔍 Signal Logic:
✅ Buy Signal:
The LSMA (30) must be below both EMA 4 and EMA 9.
A bullish crossover occurs: EMA 4 crosses above EMA 9.
Only one signal is triggered per crossover, avoiding repeated alerts during trend continuation.
❌ Sell Signal:
The LSMA (30) must be above both EMA 4 and EMA 9.
A bearish crossover occurs: EMA 4 crosses below EMA 9.
Only one signal is triggered per crossover, avoiding repeated alerts during trend continuation.
🖥️ Visual Features:
Option to show/hide each EMA and the LSMA.
Buy/Sell markers appear at cross points.
A white background highlight marks the candle where the signal occurs (optional).
Visuals scale dynamically with the chart zoom and axes.
🔔 Alerts:
Custom alert conditions for Buy and Sell.
Alerts can trigger push notifications to the TradingView mobile app, email, or webhook.
Configured to avoid repeating alerts unless the trend resets and a new valid crossover occurs.

Auto-Length Anchored Multiple EMA (Hour-Based)# Auto-Length Anchored Multiple EMA (Hour-Based)
## Overview
This advanced EMA indicator automatically calculates Exponential Moving Average lengths based on the time elapsed since user-defined anchor dates. Unlike traditional fixed-length EMAs, this indicator dynamically adjusts EMA periods based on actual trading hours, making it ideal for event-based analysis and time-sensitive trading strategies.
## Key Features
### 🎯 **Dual Mode Operation**
- **Auto Mode**: EMA length automatically calculated from anchor date to current time
- **Manual Mode**: Traditional fixed-length EMA calculation
- Switch between modes independently for each EMA
### 📊 **Multiple EMA Support**
- Up to 4 independent EMAs with individual configurations
- Each EMA can have its own anchor date and settings
- Individual enable/disable controls for each EMA
### ⏰ **Smart Time Calculation**
- Accounts for actual trading hours (customizable)
- Weekend exclusion with Saturday trading option (for markets like NSE/BSE)
- Hour multiplier for fine-tuning EMA sensitivity
- Minimum EMA length protection to prevent calculation errors
### 🎨 **Visual Enhancements**
- **Dynamic Fill Colors**: Fill between EMA1 and EMA3 changes color based on price position
- **Customizable Colors**: Individual color settings for each EMA
- **Anchor Visualization**: Optional vertical lines and labels at anchor dates
- **Real-time Table**: Shows current EMA lengths, modes, and values
## Configuration Options
### Trading Session Settings
- **Trading Hours Per Day**: Set your market's trading hours (1-24)
- **Trading Days Per Week**: Configure for different markets (5 for Mon-Fri, 6 for Mon-Sat)
- **Include Saturday**: Enable for markets that trade on Saturday
- **Hour Multiplier**: Fine-tune EMA sensitivity (0.1x to 10x)
### EMA Configuration
- **Anchor Dates**: Set specific start dates for each EMA calculation
- **Manual Lengths**: Override with traditional fixed periods when needed
- **Enable/Disable**: Individual control for each EMA
- **Color Customization**: Personalize appearance for each EMA
### Visual Options
- **Fill Settings**: Toggle and customize fill colors between EMAs
- **Anchor Lines**: Show vertical lines at anchor dates
- **Anchor Labels**: Display formatted anchor date information
- **Length Table**: Real-time display of current EMA parameters
## Use Cases
### 📈 **Event-Based Analysis**
- Anchor EMAs to earnings announcements, policy decisions, or market events
- Track price behavior relative to specific time periods
- Analyze momentum changes from key market catalysts
### 🕐 **Time-Sensitive Trading**
- Perfect for intraday strategies where timing is crucial
- Automatically adjusts to market hours and trading sessions
- Eliminates manual EMA length recalculation
### 🌍 **Multi-Market Support**
- Configurable for different global markets
- Saturday trading support for Asian markets
- Flexible trading hour settings
## Technical Details
### Calculation Method
The indicator calculates trading bars elapsed since anchor date using:
```
Total Trading Bars = (Days Since Anchor × Trading Days Per Week ÷ 7) × Trading Hours Per Day × Hour Multiplier
```
### EMA Formula
Uses standard EMA calculation with dynamically calculated alpha:
```
Alpha = 2 ÷ (Current Length + 1)
EMA = Alpha × Current Price + (1 - Alpha) × Previous EMA
```
### Weekend Handling
- Automatically excludes weekends from calculation
- Optional Saturday inclusion for specific markets
- Accurate trading day counting
## Installation & Setup
1. **Add to Chart**: Apply the indicator to your desired timeframe
2. **Set Anchor Dates**: Configure anchor dates for each EMA you want to use
3. **Adjust Trading Hours**: Set your market's trading session parameters
4. **Customize Appearance**: Choose colors and visual options
5. **Enable Features**: Turn on fills, anchor lines, and information table as needed
## Best Practices
- **Anchor Selection**: Choose significant market events or technical breakouts as anchor points
- **Multiple Timeframes**: Use different anchor dates for short, medium, and long-term analysis
- **Hour Multiplier**: Start with 1.0 and adjust based on market volatility and your trading style
- **Visual Clarity**: Use contrasting colors for different EMAs to improve readability
## Compatibility
- **Pine Script Version**: v6
- **Chart Types**: All chart types supported
- **Timeframes**: Works on all timeframes (optimal on intraday charts)
- **Markets**: Suitable for stocks, forex, crypto, and commodities
## Notes
- Indicator starts calculation from the anchor date forward
- Minimum EMA length prevents calculation errors with very recent anchor dates
- Table display updates in real-time showing current EMA parameters
- Fill colors dynamically change based on price position relative to EMA1
---
*This indicator is perfect for traders who want to combine the power of EMAs with event-driven analysis and precise time-based calculations.*

Fear and Greed Index [DunesIsland]The Fear and Greed Index is a sentiment indicator designed to measure the emotions driving the stock market, specifically investor fear and greed. Fear represents pessimism and caution, while greed reflects optimism and risk-taking. This indicator aggregates multiple market metrics to provide a comprehensive view of market sentiment, helping traders and investors gauge whether the market is overly fearful or excessively greedy.How It WorksThe Fear and Greed Index is calculated using four key market indicators, each capturing a different aspect of market sentiment:
Market Momentum (30% weight)
Measures how the S&P 500 (SPX) is performing relative to its 125-day simple moving average (SMA).
A higher value indicates that the market is trading well above its moving average, signaling greed.
Stock Price Strength (20% weight)
Calculates the net number of stocks hitting 52-week highs minus those hitting 52-week lows on the NYSE.
A greater number of net highs suggests strong market breadth and greed.
Put/Call Options (30% weight)
Uses the 5-day average of the put/call ratio.
A lower ratio (more call options being bought) indicates greed, as investors are betting on rising prices.
Market Volatility (20% weight)
Utilizes the VIX index, which measures market volatility.
Lower volatility is associated with greed, as investors are less fearful of large market swings.
Each component is normalized using a z-score over a 252-day lookback period (approximately one trading year) and scaled to a range of 0 to 100. The final Fear and Greed Index is a weighted average of these four components, with the weights specified above.Key FeaturesIndex Range: The index value ranges from 0 to 100:
0–25: Extreme Fear (red)
25–50: Fear (orange)
50–75: Neutral (yellow)
75–100: Greed (green)
Dynamic Plot Color: The plot line changes color based on the index value, visually indicating the current sentiment zone.
Reference Lines: Horizontal lines are plotted at 0, 25, 50, 75, and 100 to represent the different sentiment levels: Extreme Fear, Fear, Neutral, Greed, and Extreme Greed.
How to Interpret
Low Values (0–25): Indicate extreme fear, which may suggest that the market is oversold and could be due for a rebound.
High Values (75–100): Indicate greed, which may signal that the market is overbought and could be at risk of a correction.
Neutral Range (25–75): Suggests a balanced market sentiment, neither overly fearful nor greedy.
This indicator is a valuable tool for contrarian investors, as extreme readings often precede market reversals. However, it should be used in conjunction with other technical and fundamental analysis tools for a well-rounded view of the market.

MTF_MA RibbonThis script plots a ribbon of Moving Averages for Daily, Weekly and Monthly timeframes and helps in Multi-timeframe analysis of securities for swing & positional trades. once applied to chart, the moving averages change automatically according to the selected timeframe.
Following are the default moving averages :
Daily TF EMAs: 5D, 10D, 20D
Daily TF SMAs: 50D, 100D, 150D, 200D
Weekly TF SMAs: 10W, 20W, 30W, 40W
Monthly TF SMAs: 3M, 5M, 8M, 11M

SMA Crossing Background Color (Multi-Timeframe)When day trading or scalping on lower timeframes, it’s often difficult to determine whether the broader market trend is moving upward or downward. To address this, I usually check higher timeframes. However, splitting the layout makes the charts too small and hard to read.
To solve this issue, I created an indicator that uses the background color to show whether the current price is above or below a moving average from a higher timeframe.
For example, if you set the SMA Length to 200 and the MT Timeframe to 5 minutes, the indicator will display a red background on the 1-minute chart when the price drops below the 200 SMA on the 5-minute chart. This helps you quickly recognize that the trend on the higher timeframe has turned bearish—without having to open a separate chart.
デイトレード、スキャルピングで短いタイムフレームでトレードをするときに、大きな動きは上に向いているのか下に向いているのかトレンドがわからなくなることがあります。
その時に上位足を確認するのですが、レイアウトをスプリットすると画面が小さくて見えにくくなるので、バックグラウンドの色で上位足の移動平均線では価格が上なのか下なのかを表示させるインジケーターを作りました。
例えば、SMA Length で200を選び、MT Timeframeで5分を選べば、1分足タイムフレームでトレードしていて雲行きが怪しくなってくるとBGが赤になり、5分足では200線以下に突入しているようだと把握することができます。

EMA Shadow Trading_TixThis TradingView indicator, named "EMA Shadow Trading_Tix", combines Exponential Moving Averages (EMAs) with VWAP (Volume-Weighted Average Price) and a shadow fill between EMAs to help traders identify trends, momentum, and potential reversal zones. Below is a breakdown of its key functions:
1. EMA (Exponential Moving Average) Settings
The indicator allows customization of four EMAs with different lengths and colors:
EMA 1 (Default: 9, Green) – Short-term trend filter.
EMA 2 (Default: 21, Red) – Medium-term trend filter.
EMA 3 (Default: 50, Blue) – Mid-to-long-term trend filter.
EMA 4 (Default: 200, Orange) – Long-term trend filter (often used as a "bull/bear market" indicator).
Key Features:
Global EMA Source: All EMAs use the same source (default: close), ensuring consistency.
Toggle Visibility: Each EMA can be independently shown/hidden.
Precision Calculation: EMAs are rounded to the minimum tick size for accuracy.
Customizable Colors & Widths: Helps in distinguishing different EMAs easily.
How Traders Use EMAs:
Trend Identification:
If price is above all EMAs, the trend is bullish.
If price is below all EMAs, the trend is bearish.
Crossovers:
A shorter EMA crossing above a longer EMA (e.g., EMA 9 > EMA 21) suggests bullish momentum.
A shorter EMA crossing below a longer EMA (e.g., EMA 9 < EMA 21) suggests bearish momentum.
Dynamic Support/Resistance:
EMAs often act as support in uptrends and resistance in downtrends.
2. Shadow Fill Between EMA 1 & EMA 2
The indicator includes a colored fill (shadow) between EMA 1 (9-period) and EMA 2 (21-period) to enhance trend visualization.
How It Works:
Bullish Shadow (Green): Applies when EMA 1 > EMA 2, indicating a bullish trend.
Bearish Shadow (Red): Applies when EMA 1 < EMA 2, indicating a bearish trend.
Why It’s Useful:
Trend Confirmation: The shadow helps traders quickly assess whether the short-term trend is bullish or bearish.
Visual Clarity: The fill makes it easier to spot EMA crossovers and trend shifts.
3. VWAP (Volume-Weighted Average Price) Integration
The indicator includes an optional VWAP overlay, which is useful for intraday traders.
Key Features:
Customizable Anchor Periods: Options include Session, Week, Month, Quarter, Year, Decade, Century, Earnings, Dividends, Splits.
Hide on Higher Timeframes: Can be disabled on 1D or higher charts to avoid clutter.
Adjustable Color & Width: Default is purple, but users can change it.
How Traders Use VWAP:
Mean Reversion: Price tends to revert to VWAP.
Trend Confirmation:
Price above VWAP = Bullish bias.
Price below VWAP = Bearish bias.
Breakout/Rejection Signals: Strong moves away from VWAP may indicate continuation or exhaustion.
4. Practical Trading Applications
Trend-Following Strategy:
Long Entry: Price above all EMAs + EMA 1 > EMA 2 (green shadow). Optional: Price above VWAP for intraday trades.
Short Entry: Price below all EMAs + EMA 1 < EMA 2 (red shadow). Optional: Price below VWAP for intraday trades.
Mean Reversion Strategy:
Pullback to EMA 9/21/VWAP: Look for bounces near EMAs or VWAP in a strong trend.
Multi-Timeframe Confirmation:
Higher timeframe EMAs (50, 200) can be used to filter trades (e.g., only trade longs if price is above EMA 200).
Conclusion
This EMA Shadow Trading Indicator is a versatile tool that combines:
✔ Multiple EMAs for trend analysis
✔ Shadow fill for quick trend visualization
✔ VWAP integration for intraday trading
It is useful for swing traders, day traders, and investors looking for trend confirmation, momentum shifts, and dynamic support/resistance levels.

Volume MAs Oscillator | Lyro RSVolume MAs Oscillator | Lyro RS
Overview
The Volume MAs Oscillator is a powerful volume‑adjusted momentum tool that combines custom‑weighted moving averages on volume‑weighted price with smoothed deviation bands. It offers dynamic insights into trend direction, overbought/oversold conditions, and relative valuation — all within a single indicator
Key Features
Volume‑Adjusted Moving Averages: Moving averages can be volume‑weighted using the following formula: a moving average of (Price × Volume) divided by a moving average of Volume. This formula is applied across more than 14 different moving averages; however, it is not used with the VWMA, as VWMA is inherently a volume-weighted moving average.
Percentage Oscillator: Displays the normalized difference: (source – MA) / MA * 100, centered around zero for easy interpretation of strength and direction.
Deviation Bands: Builds upper and lower bands from standard deviation of the oscillator over a selected lookback, with distinct positive/negative multipliers and optional smoothing to reduce noise.
Inputs: Band Length, Band Smoothing, Positive Band Multiplier, Negative Band Multiplier.
Multi‑Mode Signal System:
1. Trend Mode – Colors oscillator according to breaks above (bullish) or below (bearish) respective bands.
2. Reversion Mode – Inverses color logic: signals overextensions beyond bands as reversion opportunities, greys inside the bands.
3. Valuation Mode – Applies a gradient color scale (UpC ⇄ DnC) to reflect relative valuation strength.
Customizable Visuals: Select from 5 pre‑set palettes—Classic, Mystic, Major Themes, Accented, Royal—or define your own custom bullish/bearish colors.
Chart enhancements include color‑coded oscillator line, deviation bands, glow‑effect midline at zero, background shading and candlestick/bar coloring aligned to signal mode.
Built‑In Signals: Automatically plots ▲ oversold and ▼ overbought markers upon crosses of lower/upper bands (in trend or reversion modes), enhancing signal clarity.
How It Works
MA Calculation – Applies the selected MA type to price × volume (normalized by MA of volume) or direct VWMA.
Oscillator Output – Calculates the % difference of source vs. derived MA.
Band Construction – Computes rolling standard deviation; applies user‑defined multipliers; smooths bands with exponential blending.
Mode-Dependent Coloring & Signals –
• Trend: Highlights strength trends via band cross coloring.
• Reversion: Flags extremes beyond bands as potential pullbacks.
• Valuation: Uses gradient to reflect oscillator’s position relative to recent range.
Signal Markers – Deploys arrows and color rules to flag overbought (▼) or oversold (▲) conditions when bands are breached.
Practical Use
Trend Confirmation – In Trend Mode, use upward price_diff cross above upper band as bullish; downward cross below lower band as bearish.
Mean Reversion – In Reversion Mode, fading extremes beyond bands may precede a retracement.
Relative Valuation – Valuation Mode shines when assessing how extended price_diff is, with gradient colors indicating valuation zones.
Bars/candles color‑coded to oscillator state boosts clarity of market tone and allows for rapid visual scanning.
Customization
Adjust MA type/length to tune responsiveness vs. smoothing.
Configure band settings for volatility sensitivity.
Toggle between signal modes for trend-following or reversion strategies.
Stylish visuals: pick or customize color schemes to match your chart setup.
⚠️Disclaimer
This indicator is a tool for technical analysis and does not provide guaranteed results. It should be used in conjunction with other analysis methods and proper risk management practices. The creators of this indicator are not responsible for any financial decisions made based on its signals.

Intermarket Analysis ProIntermarket Analysis Pro Indicator
Overview
The Intermarket Analysis Pro is a sophisticated trading indicator designed for forex traders, integrating technical analysis with comprehensive macroeconomic insights. This tool features Exponential Moving Averages (EMA 10/20) for trend detection, a consolidated table combining timeframe biases, trading signals, and intermarket data, delivering a holistic view to optimize decision-making in volatile markets.
Usage Instructions
Installation: Access TradingView, navigate to the Pine Editor, paste the script, and save it as "Intermarket_Analysis_Pro". Apply it to your desired forex chart (e.g., EURUSD on a 5-minute timeframe).
Configuration:
EMA Settings: Select EMA Source as "close" for precise alignment with candle closes, adjust EMA 10 Period (default 10) and EMA 20 Period (default 20) to suit your strategy, and toggle Show EMA Value Labels or Show (B)/(S) Signal Labels for enhanced visibility.
Table Settings: Enable Show Combined Table, select Combined Table Position (e.g., "Bottom Right"), and choose Text Size (e.g., "Small") for optimal display.
Intermarket Parameters: Fine-tune Bias Threshold (default 0.3) and Score Change Threshold (default 10) to refine intermarket bias sensitivity.
Display Options: Switch between "Light" or "Dark" themes to match your chart environment.
Signal Interpretation:
EMA Indicators: A crossover of EMA 10 (orange) above EMA 20 (blue) signals a potential BUY, while a crossunder indicates a SELL. Confirm with "(B)" or "(S)" labels on the chart.
Combined Table: Analyze timeframe biases (e.g., "BULLISH" on 1m), logic signals (e.g., "BUY" on 5m), and intermarket trends (e.g., "EUR Rise (+30)") to align with market conditions.
Strategic Application: Utilize on lower timeframes (1m, 5m) for scalping or higher timeframes (1h, 4h) for swing trading. Ensure smooth scrolling to verify EMA and table synchronization with candles.
Alert Setup: Configure alerts for "Buy Signal" or "Sell Signal" on your preferred timeframe to receive real-time notifications.
Key Features
EMA 10/20: Provides customizable short-term trend analysis with optional value labels.
Unified Table: Merges SimpleBias (timeframe trends), Logic (trading signals), and Intermarket (global currency, index, and bond movements) into a single, scrollable interface.
Intermarket Insights: Evaluates 18 assets (e.g., DXY, SPX500, EUR, XAUUSD) for macroeconomic sentiment, updated hourly with color-coded change indicators.
Customization: Offers adjustable positions, sizes, and thresholds to adapt to individual trading preferences.
Market Context: Reflects current sentiment, such as a bullish EURUSD trend supported by weak NFP data and hawkish ECB policies (as of July 2025).
Best Practices
Timeframe Alignment: Match the chart timeframe with your analysis to ensure accurate EMA and table data representation.
Optimal Trading Hours: Maximize effectiveness during the NY session (08:00-17:00 EST) when intermarket activity is most pronounced.
Troubleshooting: If EMA lags during scrolling, disable labels or reduce additional indicators. Report discrepancies (e.g., "EMA 10 at 1.08840, candle at 1.08850") for further optimization.
Additional Notes
The Intermarket Analysis Pro is tailored for traders seeking to integrate global sentiment with technical signals. Test thoroughly on a demo account and adjust settings to align with your trading strategy. As of July 5, 2025, 04:04 AM WIB, the market indicates a bullish EURUSD outlook, with intermarket data reinforcing BUY opportunities on lower timeframes.

Enhanced Ichimoku Cloud Strategy V1 [Quant Trading]Overview
This strategy combines the powerful Ichimoku Kinko Hyo system with a 171-period Exponential Moving Average (EMA) filter to create a robust trend-following approach. The strategy is designed for traders seeking to capitalize on strong momentum moves while using the Ichimoku cloud structure to identify optimal entry and exit points.
This is a patient, low-frequency trading system that prioritizes quality over quantity. In backtesting on Solana, the strategy achieved impressive results with approximately 3600% profit over just 29 trades, demonstrating its effectiveness at capturing major trend movements rather than attempting to profit from every market fluctuation. The extended parameters and strict entry criteria are specifically optimized for Solana's price action characteristics, making it well-suited for traders who prefer fewer, higher-conviction positions over high-frequency trading approaches.
What Makes This Strategy Original
This implementation enhances the traditional Ichimoku system by:
Custom Ichimoku Parameters: Uses non-standard periods (Conversion: 7, Base: 211, Lagging Span 2: 120, Displacement: 41) optimized for different market conditions
EMA Confirmation Filter: Incorporates a 171-period EMA as an additional trend confirmation layer
State Memory System: Implements a sophisticated memory system to track buy/sell states and prevent false signals
Dual Trade Modes: Offers both traditional Ichimoku signals ("Ichi") and cloud-based signals ("Cloud")
Breakout Confirmation: Requires price to break above the 25-period high for long entries
How It Works
Core Components
Ichimoku Elements:
-Conversion Line (Tenkan-sen): 7-period Donchian midpoint
-Base Line (Kijun-sen): 211-period Donchian midpoint
-Span A (Senkou Span A): Average of Conversion and Base lines, plotted 41 periods ahead
-Span B (Senkou Span B): 120-period Donchian midpoint, plotted 41 periods ahead
-Lagging Span (Chikou Span): Current close plotted 41 periods back
EMA Filter: 171-period EMA acts as a long-term trend filter
Entry Logic (Ichi Mode - Default)
A long position is triggered when ALL conditions are met:
Cloud Bullish: Span A > Span B (41 periods ago)
Breakout Confirmation: Current close > 25-period high
Ichimoku Bullish: Conversion Line > Base Line
Trend Alignment: Current close > 171-period EMA
State Memory: No previous buy signal is still active
Exit Logic
Positions are closed when:
Ichimoku Bearish: Conversion Line < Base Line
Alternative Cloud Mode
When "Cloud" mode is selected, the strategy uses:
Entry: Span A crosses above Span B with additional cloud and EMA confirmations
Exit: Span A crosses below Span B with cloud and EMA confirmations
Default Settings Explained
Strategy Properties
Initial Capital: $1,000 (realistic for average traders)
Position Size: 100% of equity (appropriate for backtesting single-asset strategies)
Commission: 0.1% (realistic for most brokers)
Slippage: 3 ticks (accounts for realistic execution costs)
Date Range: January 1, 2018 to December 31, 2069
Key Parameters
Conversion Periods: 7 (faster than traditional 9, more responsive to price changes)
Base Periods: 211 (much longer than traditional 26, provides stronger trend confirmation)
Lagging Span 2 Periods: 120 (custom period for stronger support/resistance levels)
Displacement: 41 (projects cloud further into future than standard 26)
EMA Period: 171 (long-term trend filter, approximately 8.5 months of daily data)
How to Use This Strategy
Best Market Conditions
Trending Markets: Works best in clearly trending markets where the cloud provides strong directional bias
Medium to Long-term Timeframes: Optimized for daily charts and higher timeframes
Volatile Assets: The breakout confirmation helps filter out weak signals in choppy markets
Risk Management
The strategy uses 100% equity allocation, suitable for backtesting single strategies
Consider reducing position size when implementing with real capital
Monitor the 25-period high breakout requirement as it may delay entries in fast-moving markets
Visual Elements
Green/Red Cloud: Shows bullish/bearish cloud conditions
Yellow Line: Conversion Line (Tenkan-sen)
Blue Line: Base Line (Kijun-sen)
Orange Line: 171-period EMA trend filter
Gray Line: Lagging Span (Chikou Span)
Important Considerations
Limitations
Lagging Nature: Like all Ichimoku strategies, signals may lag significant price moves
Whipsaw Risk: Extended periods of consolidation may generate false signals
Parameter Sensitivity: Custom parameters may not work equally well across all market conditions
Backtesting Notes
Results are based on historical data and past performance does not guarantee future results
The strategy includes realistic slippage and commission costs
Default settings are optimized for backtesting and may need adjustment for live trading
Risk Disclaimer
This strategy is for educational purposes only and should not be considered financial advice. Always conduct your own analysis and risk management before implementing any trading strategy. The unique parameter combinations used may not be suitable for all market conditions or trading styles.
Customization Options
Trade Mode: Switch between "Ichi" and "Cloud" signal generation
Short Trading: Option to enable short positions (disabled by default)
Date Range: Customize backtesting period
All Ichimoku Parameters: Fully customizable for different market conditions
This enhanced Ichimoku implementation provides a structured approach to trend following while maintaining the flexibility to adapt to different trading styles and market conditions.

EMA Cross IndicatorHow to Use the Indicator
Interpreting Signals:
Bullish Crosses: Look for green triangles below the bars, indicating a shorter EMA crossing above a longer EMA (e.g., EMA 10 > EMA 20).
Bearish Crosses: Look for red triangles above the bars, indicating a shorter EMA crossing below a longer EMA (e.g., EMA 10 < EMA 20).
Setting Alerts: In TradingView, click the "Alerts" icon, select the condition (e.g., "Bullish Cross: EMA50 > EMA100"), and configure your notification preferences (e.g., email, popup).
Customization: Adjust the EMA lengths in the indicator settings to experiment with different periods if desired.
This indicator is designed to work on any timeframe and asset, including BTC/USDT, which you use to gauge trends for other coins. Let me know if you'd like to tweak it further or add more features!

Normalized Volume EMA FilterTrade towards volume at liquidity levels (Trend Liquidity Zones indi), unless value states otherwise.

Normalized Volume with Stripe FilterNvol with stripe function price chart ema defined. Trade the liquidity levels (trend liquidity zones indi) towards volume, unless your value says otherwise.
