Auto-Length Anchored Multiple EMA (Hour-Based)# Auto-Length Anchored Multiple EMA (Hour-Based)
## Overview
This advanced EMA indicator automatically calculates Exponential Moving Average lengths based on the time elapsed since user-defined anchor dates. Unlike traditional fixed-length EMAs, this indicator dynamically adjusts EMA periods based on actual trading hours, making it ideal for event-based analysis and time-sensitive trading strategies.
## Key Features
### 🎯 **Dual Mode Operation**
- **Auto Mode**: EMA length automatically calculated from anchor date to current time
- **Manual Mode**: Traditional fixed-length EMA calculation
- Switch between modes independently for each EMA
### 📊 **Multiple EMA Support**
- Up to 4 independent EMAs with individual configurations
- Each EMA can have its own anchor date and settings
- Individual enable/disable controls for each EMA
### ⏰ **Smart Time Calculation**
- Accounts for actual trading hours (customizable)
- Weekend exclusion with Saturday trading option (for markets like NSE/BSE)
- Hour multiplier for fine-tuning EMA sensitivity
- Minimum EMA length protection to prevent calculation errors
### 🎨 **Visual Enhancements**
- **Dynamic Fill Colors**: Fill between EMA1 and EMA3 changes color based on price position
- **Customizable Colors**: Individual color settings for each EMA
- **Anchor Visualization**: Optional vertical lines and labels at anchor dates
- **Real-time Table**: Shows current EMA lengths, modes, and values
## Configuration Options
### Trading Session Settings
- **Trading Hours Per Day**: Set your market's trading hours (1-24)
- **Trading Days Per Week**: Configure for different markets (5 for Mon-Fri, 6 for Mon-Sat)
- **Include Saturday**: Enable for markets that trade on Saturday
- **Hour Multiplier**: Fine-tune EMA sensitivity (0.1x to 10x)
### EMA Configuration
- **Anchor Dates**: Set specific start dates for each EMA calculation
- **Manual Lengths**: Override with traditional fixed periods when needed
- **Enable/Disable**: Individual control for each EMA
- **Color Customization**: Personalize appearance for each EMA
### Visual Options
- **Fill Settings**: Toggle and customize fill colors between EMAs
- **Anchor Lines**: Show vertical lines at anchor dates
- **Anchor Labels**: Display formatted anchor date information
- **Length Table**: Real-time display of current EMA parameters
## Use Cases
### 📈 **Event-Based Analysis**
- Anchor EMAs to earnings announcements, policy decisions, or market events
- Track price behavior relative to specific time periods
- Analyze momentum changes from key market catalysts
### 🕐 **Time-Sensitive Trading**
- Perfect for intraday strategies where timing is crucial
- Automatically adjusts to market hours and trading sessions
- Eliminates manual EMA length recalculation
### 🌍 **Multi-Market Support**
- Configurable for different global markets
- Saturday trading support for Asian markets
- Flexible trading hour settings
## Technical Details
### Calculation Method
The indicator calculates trading bars elapsed since anchor date using:
```
Total Trading Bars = (Days Since Anchor × Trading Days Per Week ÷ 7) × Trading Hours Per Day × Hour Multiplier
```
### EMA Formula
Uses standard EMA calculation with dynamically calculated alpha:
```
Alpha = 2 ÷ (Current Length + 1)
EMA = Alpha × Current Price + (1 - Alpha) × Previous EMA
```
### Weekend Handling
- Automatically excludes weekends from calculation
- Optional Saturday inclusion for specific markets
- Accurate trading day counting
## Installation & Setup
1. **Add to Chart**: Apply the indicator to your desired timeframe
2. **Set Anchor Dates**: Configure anchor dates for each EMA you want to use
3. **Adjust Trading Hours**: Set your market's trading session parameters
4. **Customize Appearance**: Choose colors and visual options
5. **Enable Features**: Turn on fills, anchor lines, and information table as needed
## Best Practices
- **Anchor Selection**: Choose significant market events or technical breakouts as anchor points
- **Multiple Timeframes**: Use different anchor dates for short, medium, and long-term analysis
- **Hour Multiplier**: Start with 1.0 and adjust based on market volatility and your trading style
- **Visual Clarity**: Use contrasting colors for different EMAs to improve readability
## Compatibility
- **Pine Script Version**: v6
- **Chart Types**: All chart types supported
- **Timeframes**: Works on all timeframes (optimal on intraday charts)
- **Markets**: Suitable for stocks, forex, crypto, and commodities
## Notes
- Indicator starts calculation from the anchor date forward
- Minimum EMA length prevents calculation errors with very recent anchor dates
- Table display updates in real-time showing current EMA parameters
- Fill colors dynamically change based on price position relative to EMA1
---
*This indicator is perfect for traders who want to combine the power of EMAs with event-driven analysis and precise time-based calculations.*
Moving Averages

Fear and Greed Index [DunesIsland]The Fear and Greed Index is a sentiment indicator designed to measure the emotions driving the stock market, specifically investor fear and greed. Fear represents pessimism and caution, while greed reflects optimism and risk-taking. This indicator aggregates multiple market metrics to provide a comprehensive view of market sentiment, helping traders and investors gauge whether the market is overly fearful or excessively greedy.How It WorksThe Fear and Greed Index is calculated using four key market indicators, each capturing a different aspect of market sentiment:
Market Momentum (30% weight)
Measures how the S&P 500 (SPX) is performing relative to its 125-day simple moving average (SMA).
A higher value indicates that the market is trading well above its moving average, signaling greed.
Stock Price Strength (20% weight)
Calculates the net number of stocks hitting 52-week highs minus those hitting 52-week lows on the NYSE.
A greater number of net highs suggests strong market breadth and greed.
Put/Call Options (30% weight)
Uses the 5-day average of the put/call ratio.
A lower ratio (more call options being bought) indicates greed, as investors are betting on rising prices.
Market Volatility (20% weight)
Utilizes the VIX index, which measures market volatility.
Lower volatility is associated with greed, as investors are less fearful of large market swings.
Each component is normalized using a z-score over a 252-day lookback period (approximately one trading year) and scaled to a range of 0 to 100. The final Fear and Greed Index is a weighted average of these four components, with the weights specified above.Key FeaturesIndex Range: The index value ranges from 0 to 100:
0–25: Extreme Fear (red)
25–50: Fear (orange)
50–75: Neutral (yellow)
75–100: Greed (green)
Dynamic Plot Color: The plot line changes color based on the index value, visually indicating the current sentiment zone.
Reference Lines: Horizontal lines are plotted at 0, 25, 50, 75, and 100 to represent the different sentiment levels: Extreme Fear, Fear, Neutral, Greed, and Extreme Greed.
How to Interpret
Low Values (0–25): Indicate extreme fear, which may suggest that the market is oversold and could be due for a rebound.
High Values (75–100): Indicate greed, which may signal that the market is overbought and could be at risk of a correction.
Neutral Range (25–75): Suggests a balanced market sentiment, neither overly fearful nor greedy.
This indicator is a valuable tool for contrarian investors, as extreme readings often precede market reversals. However, it should be used in conjunction with other technical and fundamental analysis tools for a well-rounded view of the market.

EMA34/89/200 (by Lê Văn Nam)This indicator displays three widely-used Exponential Moving Averages (EMAs): 34, 89, and 200 periods.
It is designed to help traders easily follow the market trend and spot potential momentum changes using EMA crossovers.
Features:
• Plots EMA34 (blue), EMA89 (green), and EMA200 (red) directly on your chart.
• Highlights crossovers between EMA34 & EMA89 (purple/orange) and between EMA89 & EMA200 (green/red).
• Includes built-in alert conditions for all crossover events.
Developed by Lê Văn Nam.
Free to use and share.
For feedback or collaboration, please contact me.

CPR + SR Breaks with OBV DivergenceCore Features
Central Pivot Range (CPR)
Plots daily pivot (CP), bottom central (BC), and top central (TC) levels.
Key for intraday support/resistance. Price reactions near these levels signal opportunities.
Support/Resistance Tools
S/R: Auto-detects swing highs/lows as dynamic support/resistance.
S/R Re-Test: Highlights retest zones with customizable aging/deletion rules.
CISD: Marks intraday structural levels (breakout points).
Trend Indicators
SuperTrend: Follows trend direction (green = uptrend, red = downtrend).
Moving Averages: Multiple EMAs/SMAs (e.g., 20, 50, 100, 200) for confluence.
VWAP: Volume-weighted average price for dynamic support/resistance.
Advanced MAs
SALMA: Adaptive moving average with volatility filter (colored by trend).
VIDYA: Smooth trend-following MA with liquidity zones.
OBV Divergence
Detects hidden divergences between price and On-Balance Volume (OBV):
Bullish Divergence: Price makes lower lows, OBV makes higher lows (green labels).
Bearish Divergence: Price makes higher highs, OBV makes lower highs (red labels).
Table at bottom-right shows divergence strength and frequency.
Trend Strength Table
Top-right table summarizes:
Trend direction (Bullish/Bearish/Sideways)
Strength (Strong/Weak)
EMA Crosses & ADX momentum
How to Trade
Breakouts:
Enter trades when price breaks S/R levels with high volume (blue/green arrows).
Confirm with CPR/TC (resistance) or CPR/BC (support) breaks.
Reversals:
Watch for OBV divergences at key S/R levels (CISD or CPR).
Combine with SuperTrend flip (e.g., green to red = sell signal).
Trend Confluence:
Trade in the direction of the trend table (e.g., "Strong Bull" + EMA cross up).
Use SALMA/VIDYA as dynamic support in uptrends (or resistance in downtrends).

MTF_MA RibbonThis script plots a ribbon of Moving Averages for Daily, Weekly and Monthly timeframes and helps in Multi-timeframe analysis of securities for swing & positional trades. once applied to chart, the moving averages change automatically according to the selected timeframe.
Following are the default moving averages :
Daily TF EMAs: 5D, 10D, 20D
Daily TF SMAs: 50D, 100D, 150D, 200D
Weekly TF SMAs: 10W, 20W, 30W, 40W
Monthly TF SMAs: 3M, 5M, 8M, 11M

SMA Crossing Background Color (Multi-Timeframe)When day trading or scalping on lower timeframes, it’s often difficult to determine whether the broader market trend is moving upward or downward. To address this, I usually check higher timeframes. However, splitting the layout makes the charts too small and hard to read.
To solve this issue, I created an indicator that uses the background color to show whether the current price is above or below a moving average from a higher timeframe.
For example, if you set the SMA Length to 200 and the MT Timeframe to 5 minutes, the indicator will display a red background on the 1-minute chart when the price drops below the 200 SMA on the 5-minute chart. This helps you quickly recognize that the trend on the higher timeframe has turned bearish—without having to open a separate chart.
デイトレード、スキャルピングで短いタイムフレームでトレードをするときに、大きな動きは上に向いているのか下に向いているのかトレンドがわからなくなることがあります。
その時に上位足を確認するのですが、レイアウトをスプリットすると画面が小さくて見えにくくなるので、バックグラウンドの色で上位足の移動平均線では価格が上なのか下なのかを表示させるインジケーターを作りました。
例えば、SMA Length で200を選び、MT Timeframeで5分を選べば、1分足タイムフレームでトレードしていて雲行きが怪しくなってくるとBGが赤になり、5分足では200線以下に突入しているようだと把握することができます。

EMA Shadow Trading_TixThis TradingView indicator, named "EMA Shadow Trading_Tix", combines Exponential Moving Averages (EMAs) with VWAP (Volume-Weighted Average Price) and a shadow fill between EMAs to help traders identify trends, momentum, and potential reversal zones. Below is a breakdown of its key functions:
1. EMA (Exponential Moving Average) Settings
The indicator allows customization of four EMAs with different lengths and colors:
EMA 1 (Default: 9, Green) – Short-term trend filter.
EMA 2 (Default: 21, Red) – Medium-term trend filter.
EMA 3 (Default: 50, Blue) – Mid-to-long-term trend filter.
EMA 4 (Default: 200, Orange) – Long-term trend filter (often used as a "bull/bear market" indicator).
Key Features:
Global EMA Source: All EMAs use the same source (default: close), ensuring consistency.
Toggle Visibility: Each EMA can be independently shown/hidden.
Precision Calculation: EMAs are rounded to the minimum tick size for accuracy.
Customizable Colors & Widths: Helps in distinguishing different EMAs easily.
How Traders Use EMAs:
Trend Identification:
If price is above all EMAs, the trend is bullish.
If price is below all EMAs, the trend is bearish.
Crossovers:
A shorter EMA crossing above a longer EMA (e.g., EMA 9 > EMA 21) suggests bullish momentum.
A shorter EMA crossing below a longer EMA (e.g., EMA 9 < EMA 21) suggests bearish momentum.
Dynamic Support/Resistance:
EMAs often act as support in uptrends and resistance in downtrends.
2. Shadow Fill Between EMA 1 & EMA 2
The indicator includes a colored fill (shadow) between EMA 1 (9-period) and EMA 2 (21-period) to enhance trend visualization.
How It Works:
Bullish Shadow (Green): Applies when EMA 1 > EMA 2, indicating a bullish trend.
Bearish Shadow (Red): Applies when EMA 1 < EMA 2, indicating a bearish trend.
Why It’s Useful:
Trend Confirmation: The shadow helps traders quickly assess whether the short-term trend is bullish or bearish.
Visual Clarity: The fill makes it easier to spot EMA crossovers and trend shifts.
3. VWAP (Volume-Weighted Average Price) Integration
The indicator includes an optional VWAP overlay, which is useful for intraday traders.
Key Features:
Customizable Anchor Periods: Options include Session, Week, Month, Quarter, Year, Decade, Century, Earnings, Dividends, Splits.
Hide on Higher Timeframes: Can be disabled on 1D or higher charts to avoid clutter.
Adjustable Color & Width: Default is purple, but users can change it.
How Traders Use VWAP:
Mean Reversion: Price tends to revert to VWAP.
Trend Confirmation:
Price above VWAP = Bullish bias.
Price below VWAP = Bearish bias.
Breakout/Rejection Signals: Strong moves away from VWAP may indicate continuation or exhaustion.
4. Practical Trading Applications
Trend-Following Strategy:
Long Entry: Price above all EMAs + EMA 1 > EMA 2 (green shadow). Optional: Price above VWAP for intraday trades.
Short Entry: Price below all EMAs + EMA 1 < EMA 2 (red shadow). Optional: Price below VWAP for intraday trades.
Mean Reversion Strategy:
Pullback to EMA 9/21/VWAP: Look for bounces near EMAs or VWAP in a strong trend.
Multi-Timeframe Confirmation:
Higher timeframe EMAs (50, 200) can be used to filter trades (e.g., only trade longs if price is above EMA 200).
Conclusion
This EMA Shadow Trading Indicator is a versatile tool that combines:
✔ Multiple EMAs for trend analysis
✔ Shadow fill for quick trend visualization
✔ VWAP integration for intraday trading
It is useful for swing traders, day traders, and investors looking for trend confirmation, momentum shifts, and dynamic support/resistance levels.

VMATOR v1VMATOR
Originally based on a personal strategy that i designed as i'm not familiar with every candlestick pattern and other strategies. This indicator is a something i created for my self trying to get better entries with lower risk. In my research and test back i found out that the lowest risk is found when entering to a position when price is close to VWAP and EMA 50 and 200. Hence the name of this indicator: VMATOR.
The indicator looks for the closest price to VWAP and those EMAs and generates a signal. It also makes an attempt to estimate exits based on the amount of times price retracts to the closest EMA.
This indicator works best if there are defined uptrends or downtrends. It may not work well during consolidations or accumulations.
If you trade Options consider that when the market opens you may have already a signal before. If by the time market opens price has not retracted to EMA 50 is safe to enter but it's up to you to define your risk.
Contact me if you have any questions.

Volume MAs Oscillator | Lyro RSVolume MAs Oscillator | Lyro RS
Overview
The Volume MAs Oscillator is a powerful volume‑adjusted momentum tool that combines custom‑weighted moving averages on volume‑weighted price with smoothed deviation bands. It offers dynamic insights into trend direction, overbought/oversold conditions, and relative valuation — all within a single indicator
Key Features
Volume‑Adjusted Moving Averages: Moving averages can be volume‑weighted using the following formula: a moving average of (Price × Volume) divided by a moving average of Volume. This formula is applied across more than 14 different moving averages; however, it is not used with the VWMA, as VWMA is inherently a volume-weighted moving average.
Percentage Oscillator: Displays the normalized difference: (source – MA) / MA * 100, centered around zero for easy interpretation of strength and direction.
Deviation Bands: Builds upper and lower bands from standard deviation of the oscillator over a selected lookback, with distinct positive/negative multipliers and optional smoothing to reduce noise.
Inputs: Band Length, Band Smoothing, Positive Band Multiplier, Negative Band Multiplier.
Multi‑Mode Signal System:
1. Trend Mode – Colors oscillator according to breaks above (bullish) or below (bearish) respective bands.
2. Reversion Mode – Inverses color logic: signals overextensions beyond bands as reversion opportunities, greys inside the bands.
3. Valuation Mode – Applies a gradient color scale (UpC ⇄ DnC) to reflect relative valuation strength.
Customizable Visuals: Select from 5 pre‑set palettes—Classic, Mystic, Major Themes, Accented, Royal—or define your own custom bullish/bearish colors.
Chart enhancements include color‑coded oscillator line, deviation bands, glow‑effect midline at zero, background shading and candlestick/bar coloring aligned to signal mode.
Built‑In Signals: Automatically plots ▲ oversold and ▼ overbought markers upon crosses of lower/upper bands (in trend or reversion modes), enhancing signal clarity.
How It Works
MA Calculation – Applies the selected MA type to price × volume (normalized by MA of volume) or direct VWMA.
Oscillator Output – Calculates the % difference of source vs. derived MA.
Band Construction – Computes rolling standard deviation; applies user‑defined multipliers; smooths bands with exponential blending.
Mode-Dependent Coloring & Signals –
• Trend: Highlights strength trends via band cross coloring.
• Reversion: Flags extremes beyond bands as potential pullbacks.
• Valuation: Uses gradient to reflect oscillator’s position relative to recent range.
Signal Markers – Deploys arrows and color rules to flag overbought (▼) or oversold (▲) conditions when bands are breached.
Practical Use
Trend Confirmation – In Trend Mode, use upward price_diff cross above upper band as bullish; downward cross below lower band as bearish.
Mean Reversion – In Reversion Mode, fading extremes beyond bands may precede a retracement.
Relative Valuation – Valuation Mode shines when assessing how extended price_diff is, with gradient colors indicating valuation zones.
Bars/candles color‑coded to oscillator state boosts clarity of market tone and allows for rapid visual scanning.
Customization
Adjust MA type/length to tune responsiveness vs. smoothing.
Configure band settings for volatility sensitivity.
Toggle between signal modes for trend-following or reversion strategies.
Stylish visuals: pick or customize color schemes to match your chart setup.
⚠️Disclaimer
This indicator is a tool for technical analysis and does not provide guaranteed results. It should be used in conjunction with other analysis methods and proper risk management practices. The creators of this indicator are not responsible for any financial decisions made based on its signals.

Vasyl Ivanov | Volatility with MAThis indicator calculates and displays the volatility value for each bar.
The main line shows the relative range (spread) of the current bar compared to its closing price.
This allows you to quickly assess how much the price fluctuated within the bar relative to where it closed.
The Simple Moving Average (SMA) with a length of 9 smooths the main indicator values, helping to identify volatility trends and filter out random spikes.
Practical Application:
The indicator can be useful for assessing current market volatility and identifying periods with unusually wide or narrow ranges.
The smoothed line helps track medium-term changes in volatility and can be used to confirm trading signals related to range expansion or contraction.

Intermarket Analysis ProIntermarket Analysis Pro Indicator
Overview
The Intermarket Analysis Pro is a sophisticated trading indicator designed for forex traders, integrating technical analysis with comprehensive macroeconomic insights. This tool features Exponential Moving Averages (EMA 10/20) for trend detection, a consolidated table combining timeframe biases, trading signals, and intermarket data, delivering a holistic view to optimize decision-making in volatile markets.
Usage Instructions
Installation: Access TradingView, navigate to the Pine Editor, paste the script, and save it as "Intermarket_Analysis_Pro". Apply it to your desired forex chart (e.g., EURUSD on a 5-minute timeframe).
Configuration:
EMA Settings: Select EMA Source as "close" for precise alignment with candle closes, adjust EMA 10 Period (default 10) and EMA 20 Period (default 20) to suit your strategy, and toggle Show EMA Value Labels or Show (B)/(S) Signal Labels for enhanced visibility.
Table Settings: Enable Show Combined Table, select Combined Table Position (e.g., "Bottom Right"), and choose Text Size (e.g., "Small") for optimal display.
Intermarket Parameters: Fine-tune Bias Threshold (default 0.3) and Score Change Threshold (default 10) to refine intermarket bias sensitivity.
Display Options: Switch between "Light" or "Dark" themes to match your chart environment.
Signal Interpretation:
EMA Indicators: A crossover of EMA 10 (orange) above EMA 20 (blue) signals a potential BUY, while a crossunder indicates a SELL. Confirm with "(B)" or "(S)" labels on the chart.
Combined Table: Analyze timeframe biases (e.g., "BULLISH" on 1m), logic signals (e.g., "BUY" on 5m), and intermarket trends (e.g., "EUR Rise (+30)") to align with market conditions.
Strategic Application: Utilize on lower timeframes (1m, 5m) for scalping or higher timeframes (1h, 4h) for swing trading. Ensure smooth scrolling to verify EMA and table synchronization with candles.
Alert Setup: Configure alerts for "Buy Signal" or "Sell Signal" on your preferred timeframe to receive real-time notifications.
Key Features
EMA 10/20: Provides customizable short-term trend analysis with optional value labels.
Unified Table: Merges SimpleBias (timeframe trends), Logic (trading signals), and Intermarket (global currency, index, and bond movements) into a single, scrollable interface.
Intermarket Insights: Evaluates 18 assets (e.g., DXY, SPX500, EUR, XAUUSD) for macroeconomic sentiment, updated hourly with color-coded change indicators.
Customization: Offers adjustable positions, sizes, and thresholds to adapt to individual trading preferences.
Market Context: Reflects current sentiment, such as a bullish EURUSD trend supported by weak NFP data and hawkish ECB policies (as of July 2025).
Best Practices
Timeframe Alignment: Match the chart timeframe with your analysis to ensure accurate EMA and table data representation.
Optimal Trading Hours: Maximize effectiveness during the NY session (08:00-17:00 EST) when intermarket activity is most pronounced.
Troubleshooting: If EMA lags during scrolling, disable labels or reduce additional indicators. Report discrepancies (e.g., "EMA 10 at 1.08840, candle at 1.08850") for further optimization.
Additional Notes
The Intermarket Analysis Pro is tailored for traders seeking to integrate global sentiment with technical signals. Test thoroughly on a demo account and adjust settings to align with your trading strategy. As of July 5, 2025, 04:04 AM WIB, the market indicates a bullish EURUSD outlook, with intermarket data reinforcing BUY opportunities on lower timeframes.

Sarim Breakout Strategy with Position Size and Stop LossThis strategy is based on breakouts using ATR with Position Size and Stop loss based upon risk

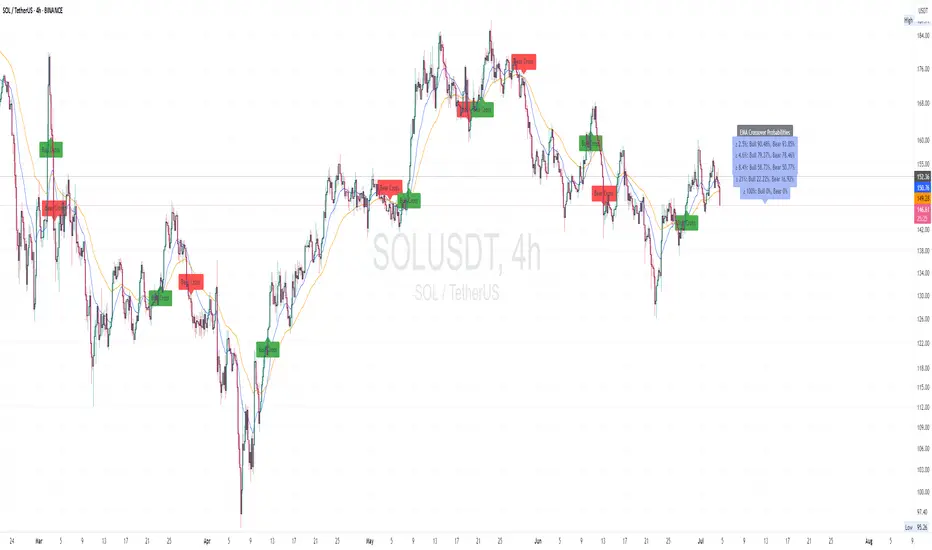
CM EMA Crossover Price Probabilities customCM EMA Crossover Price Probabilities
This indicator combines Exponential Moving Average (EMA) crossovers with swing high/low detection to calculate and display the historical probability of price movements exceeding user-defined percentage thresholds. Unlike standard EMA crossover indicators, it quantifies the likelihood of specific price changes following bullish (fast EMA crossing above slow EMA) or bearish (fast EMA crossing below slow EMA) crossovers, providing traders with data-driven insights into potential price behavior.
How It Works:EMA Crossovers: Detects when the fast EMA crosses above (bullish) or below (bearish) the slow EMA, marking these events with chart labels.
Price Change Measurement: Measures the percentage price change from the crossover point to the next swing high (for bullish crossovers) or swing low (for bearish crossovers), using pivot point detection.
Probability Calculation: Analyses historical crossover data to compute the probability of price changes meeting or exceeding customizable percentage thresholds (e.g., 2.5%, 5%). Probabilities are displayed as labels on the last bar, showing both bullish and bearish outcomes.
Customization: Allows users to adjust EMA lengths, pivot lookback, historical data limit, and probability thresholds via inputs.
Inputs:Fast EMA Length (default: 20): Period for the fast EMA.
Slow EMA Length (default: 50): Period for the slow EMA.
Pivot Lookback (default: 15): Bars used to detect swing highs/lows.
Max Historical Crossovers (default: 100): Limits stored crossovers for performance.
Bin Thresholds (defaults: 2.5%, 4.6%, 8.4%, 21.0%, 100.0%): Five customizable percentage thresholds for probability calculations.
Usage:
Add the indicator to your chart and adjust inputs to match your trading style. Bullish and bearish crossover points are labeled on the chart, and probability labels appear in the top-right corner when sufficient data is available. Use these probabilities to assess the historical likelihood of price movements after EMA crossovers, aiding in trade planning or risk assessment.
Why It’s Useful:
By combining EMA crossovers with swing-based price change analysis, this indicator offers a unique perspective on market behaviour post-crossover. The customizable probability thresholds allow traders to focus on specific price movement targets, making it a versatile tool for studying trend strength and potential outcomes.
Notes:
Probabilities are based on historical data and do not predict future performance.
Set bin thresholds in ascending order for accurate probability calculations.
Designed for educational purposes to analyze EMA crossover patterns.
mwaipopo trendThis indicator has candle overlay and It has a selectable moving average but best used with ema
It can be used for:
1. Detecting Short/Long term trend direction, for short term use len 5 and len5 and for swing trading use len20 and len2 20 but for normal intraday trading leva ethe setting at len 10 in each
2. Dynamic support/resistance, not just a line, but it has a height
3. Trailing stop
4. Trend reversal detection, when price cross above/below candle
Timeframes
1. short term TF - 5min ( scalping )
2. medium TF - 15min ( intraday )
3. high TF- 1hr ( swing trading )

Ai.Trade Breakout PRO+ (powered by SEPA Logic//BETA version)Ai.Trade Breakout PRO+ (powered by SEPA Logic)
A smart multi-signal indicator for breakouts, early entries, exits & trend shifts – inspired by SEPA logic
Description:
Ai.Trade Breakout PRO+ is an advanced multi-signal indicator built on the logic of the SEPA strategy. It combines precise breakout entries with early strength detection, smart exit signals (including ATR filters), and trend recovery flags. Ideal for traders aiming to follow price strength with discipline and clarity.
Features:
✅ Breakout signal above 50-day high + EMA200 filter
🟠 Early signal with RSI/volume/strong-close logic
⛔ Smart exit detection: EMA21 cross, Swing-Low + ATR, or entry breach
🔁 Trend recovery signal via EMA crossover after a downtrend
📈 EMA trendlines (10, 21, 50, 150, 200)
🔔 Built-in alerts for all signals
Recommended use:
Primarily use on the daily timeframe. Early signals may appear in 4h or 1h charts for anticipation, but official entries should always be confirmed on the daily chart.
Exit Recommendation:
Exit is triggered when...
- price closes below EMA21 (loss of trend)
- or breaks below last swing low (with ATR buffer)
- or drops below entry (with ATR buffer)
Tip: You may combine or filter these exit signals to suit your risk preference.
📊 Optional Add-on:
To further enhance trend clarity, the Ai.Trade Trendpanel (HH2/LL2) is available as a separate module. It visualizes trend structure (Higher Highs & Lower Lows) and helps filter high-probability entries.
⚠️ Beta Version: This version is released for public testing. Access may be changed to invite-only soon.
📈 Ideal for traders looking for a complete and structured breakout system.

EMA Cross IndicatorHow to Use the Indicator
Interpreting Signals:
Bullish Crosses: Look for green triangles below the bars, indicating a shorter EMA crossing above a longer EMA (e.g., EMA 10 > EMA 20).
Bearish Crosses: Look for red triangles above the bars, indicating a shorter EMA crossing below a longer EMA (e.g., EMA 10 < EMA 20).
Setting Alerts: In TradingView, click the "Alerts" icon, select the condition (e.g., "Bullish Cross: EMA50 > EMA100"), and configure your notification preferences (e.g., email, popup).
Customization: Adjust the EMA lengths in the indicator settings to experiment with different periods if desired.
This indicator is designed to work on any timeframe and asset, including BTC/USDT, which you use to gauge trends for other coins. Let me know if you'd like to tweak it further or add more features!

Normalized Volume EMA FilterTrade towards volume at liquidity levels (Trend Liquidity Zones indi), unless value states otherwise.

Normalized Volume with Stripe FilterNvol with stripe function price chart ema defined. Trade the liquidity levels (trend liquidity zones indi) towards volume, unless your value says otherwise.

200 EMA Power Bounce Screenerthis indicator work on bullish reversal strategy. when stock is abov 200 ema and touch 200 ema for reversal. it will confirm that there is a revesal candle, stron support on 200 ema, primary trend is strong than secondary trand, have a strong volume, rsi cross 50 in upperside.

Two Poles Trend Finder MTF [BigBeluga]🔵 OVERVIEW
Two Poles Trend Finder MTF is a refined trend-following overlay that blends a two-pole Gaussian filter with a multi-timeframe dashboard. It provides a smooth view of price dynamics along with a clear summary of trend directions across multiple timeframes—perfect for traders seeking alignment between short and long-term momentum.
🔵 CONCEPTS
Two-Pole Filter: A smoothing algorithm that responds faster than traditional moving averages but avoids the noise of short-term fluctuations.
var float f = na
var float f_prev1 = na
var float f_prev2 = na
// Apply two-pole Gaussian filter
if bar_index >= 2
f := math.pow(alpha, 2) * source + 2 * (1 - alpha) * f_prev1 - math.pow(1 - alpha, 2) * f_prev2
else
f := source // Warm-up for first bars
// Shift state
f_prev2 := f_prev1
f_prev1 := f
Trend Detection Logic: Trend direction is determined by comparing the current filtered value with its value n bars ago (shifted comparison).
MTF Alignment Dashboard: Trends from 5 configurable timeframes are monitored and visualized as colored boxes:
• Green = Uptrend
• Magenta = Downtrend
Summary Arrow: An average trend score from all timeframes is used to plot an overall arrow next to the asset name.
🔵 FEATURES
Two-Pole Gaussian Filter offers ultra-smooth trend curves while maintaining responsiveness.
Multi-Timeframe Trend Detection:
• Default: 1H, 2H, 4H, 12H, 1D (fully customizable)
• Each timeframe is assessed independently using the same trend logic.
Visual Trend Dashboard positioned at the bottom-right of the chart with color-coded trend blocks.
Dynamic Summary Arrow shows overall market bias (🢁 / 🢃) based on majority of uptrends/downtrends.
Bold + wide trail plot for the filter value with gradient coloring based on directional bias.
🔵 HOW TO USE
Use the multi-timeframe dashboard to identify aligned trends across your preferred trading horizons.
Confirm trend strength or weakness by observing filter slope direction .
Look for dashboard consensus (e.g., 4 or more timeframes green] ) as confirmation for breakout, continuation, or trend reentry strategies.
Combine with volume or price structure to enhance entry timing.
🔵 CONCLUSION
Two Poles Trend Finder MTF delivers a clean and intuitive trend-following solution with built-in multi-timeframe awareness. Whether you’re trading intra-day or positioning for swing setups, this tool helps filter out market noise and keeps you focused on directional consensus.


SY_Quant_AI_Trend.2.0✅ English Description (Safe Minimal Version)
SY_Quant_AI_Trend 2.0 — Multi-Factor Trend Analysis Toolkit
This indicator combines trend detection, structure recognition, and visual overlays to assist traders in analyzing market dynamics.
It integrates common techniques in a simplified form for research and chart-based strategy development.
