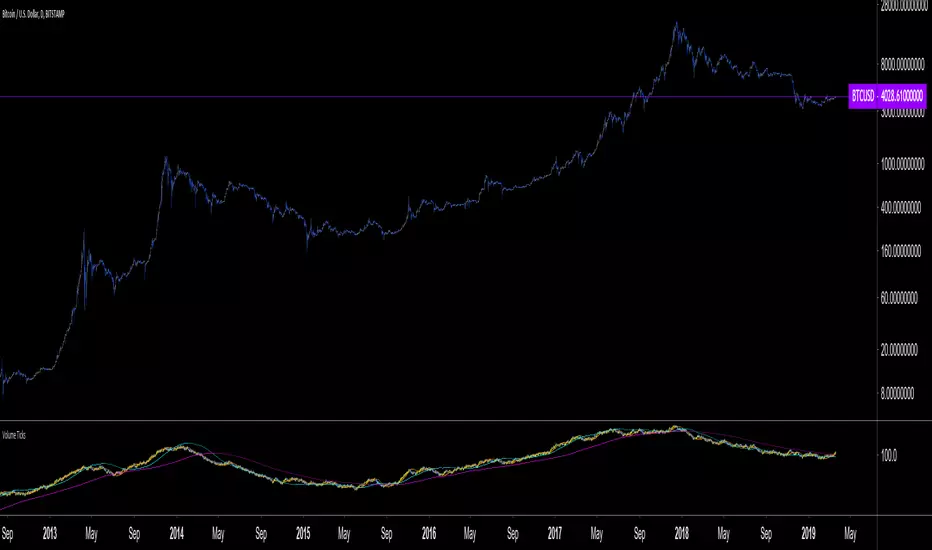
Volume Ticks - Increasing Volume Bar Count [LucF]Volume Ticks is a zero-lag market sentiment indicator. It works by providing a cumulative count of increasing volume columns.
A one count is added for each increasing volume column where close>open, and one is subtracted on an increasing volume column if close<open. That’s it. The count does not change when volume hasn’t increased compared to the previous bar’s volume, nor when price does not change. Price movement during the bar, whether 0.001% or 100%, is irrelevant to Volume Ticks; it only moves by 1 at a time.
Given that price is not used in Ticks, it is intriguing how well it tracks—or often leads—price movement. The fact that it doesn’t use price also makes it an ideal companion to most indicators that do use price, whether in momentum or mean-reversion based strategies.
As with my TLD indicator , the postulate behind Ticks is that price movement occurring on increasing volume is more significant than otherwise. In my opinion, the usefulness of Ticks tends to validate this.
Features
The averages can be turned on and off.
A long-term sentiment marker can be turned on.
Markers for BB exits and pause-reversals can be turned on, with the option of showing only long or short markers.
9 alerts can be defined on markers, with the option of choosing only long or short markers.
Use cases
Provides perspective when reading momentum indicators.
Helps identify false momentum tops or bottoms.
Comes in handy in detecting subtle sentiment in consolidations. Instances where slight price movement is accompanied by more important Ticks movements often predate more important price movements.
Helps detect exhaustion in trends.
Things to keep in mind
Volume Ticks show sentiment—not price nor trend. Because it so often mimics price, this is easy to forget.
Volume Ticks is not bound. Its position with regards to the zero line is not particularly useful either; position relative to and interplay between the MAs is much more useful.
Readings are more reliable with many data points. When used on monthly, weekly or daily charts, readings should be validated at shorter intervals. Over the same length of time, a compressed view of a shorter interval will usually provide more reliable readings than the longer interval view.
Being zero-lag, Ticks is inherently noisy. You will see this when using the Pause-Reversal markers.
The signal line will not move if no increasing volume is accompanying price movement, however important that movement may be.
Linear regressions are used in lieu of MAs, except the slow long MA (T5) which uses a simple moving average. The fast MA (T2) is double-smoothed.
Markers 2 are brighter when T3 and T4 are in the direction of the marker. The markers are not this indicator’s most useful feature.
Here is Ticks in action on a chart also using TLD:
On Balance Volume (OBV)
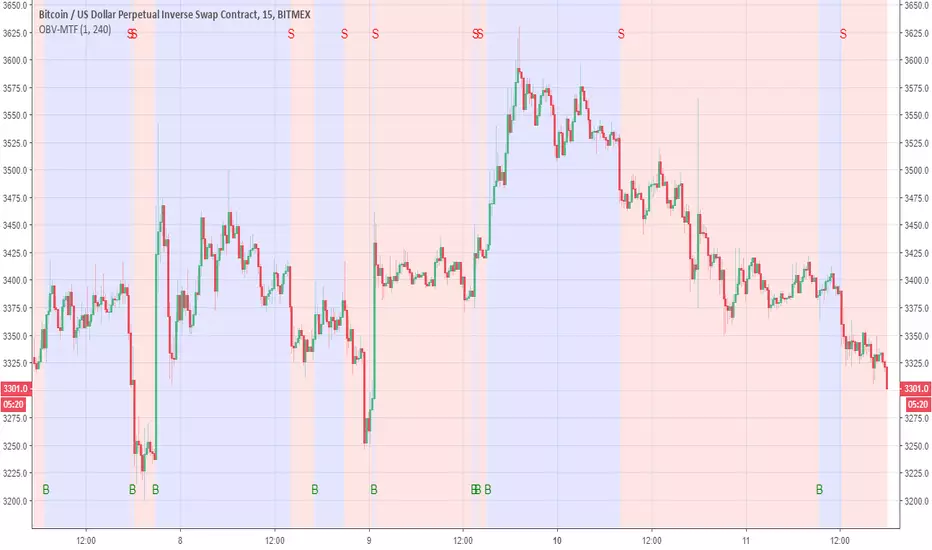
OBV-MTFUsing modified OBV volume equetion and using our modified MTF length (not need to use security so no repaint )
the Buy and Sell reresent in B and S and by the colors of bullish compare to bearish
You change the MTF by changing int2
in this example is set to 240 min MTF over 15 min charts
alerts inside
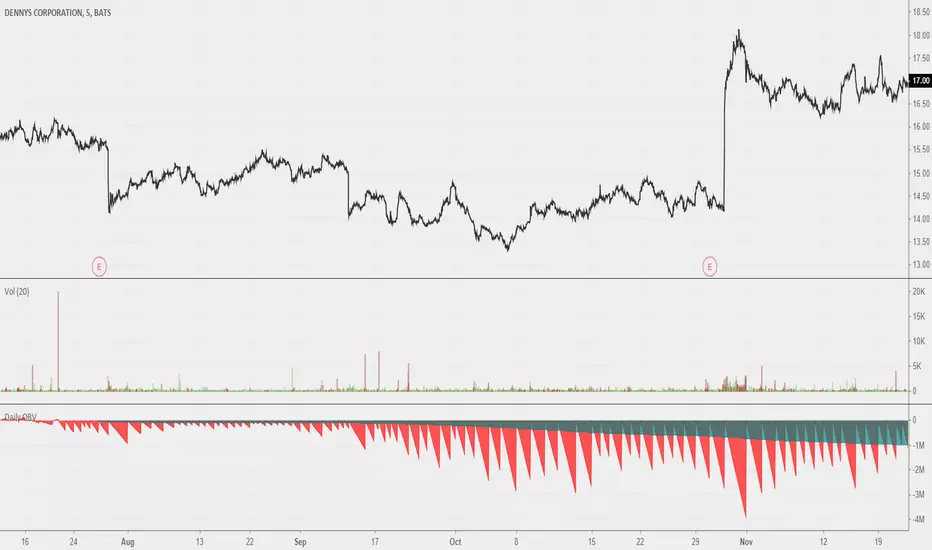
Daily OBVOBV that should reset on a daily session break. Looks neat when you scroll out all the way. Good use remains to be found; I believe this could be a useful reference for a more fleshed out idea for 'local zone' OBVs. Maybe comparing previous sessions' daily OBVs to current.
On Balance VolumeThis indicator was originally described by Joseph E. Granville in his book "Granville's New Key To Stock Market Profits" (1963).

Volume+ by BDthis is a simple volume indicator,
shows volume sizes with color differences on histogram (total volume, neutral volume and effective volume)
bar length = total volume, gray bar= neutral volume, green bar= pozitive volume, red bar= negative volume
variable value; The bar's average will be calculated until the given value. by default is average not calculated
On Balance Volume Oscillator + Bollinger Bands [SigmaDraconis]On Balance Volume (OBV) Oscillator with Bollinger Bands (BB).
Inspired by @LazyBear OBV Oscillator (link below)
Added BB to the oscillator and colored the OBV line yellow when it's outside the bands' limits, useful for finding over-extended zones where price reversals have higher probability of happening.
BB bands can be deactivated and the oscillator can be used as originally built by LazyBear if the BB bands are disabled and the OBV area activated.
Finding divergences helps increasing price behavior predictability too.
BB area is colored green when OBV is above the 20-period moving average and colored red when below it. This can be deactivated on the options to use regular BB colors or no BB at all.
If you like it and use it to profit, please tip me below :)
Tip jars:
BTC: 15nMBiEGVrdGcu9C1h6QRcTNRvugHkqrMQ
ETH: 0xC33845946c48B61fBCbEA0367ec2238CaF2b73bc
BTS: sigma-draconis
OBV Oscillator from LazyBear -

Enhanced On Balance VolumeEnhanced On Balance Volume
"On-balance volume (OBV) is a momentum indicator that uses volume flow to predict changes in stock price.
Joseph Granville first developed the OBV metric in the 1960s.
He believed that when volume increases sharply without a significant change in the stock's price, the price will eventually jump upward, and vice versa."
The On Balance Volume generalizes.
Only the direction of change is taken into consideration, making the price irrelevant.
Enhanced On Balance Volume comes to life when the entire price action is being considered - the lows and highs.
// I looked around on TradingView and there was no such indicator.
// This is a version of the well known On Balance Volume, ported to Pinescript, meant for markets with volume data.
MCI and VCI - Modified CCI FormulasFor private peeps only
- Takes a modified version of the CCI formula into 2 parts
VCI - Volume Channel Index (Yellow Histogram)
- Measures accurate accumulation and distribution levels and times
MCI - Modified Channel Index
- Measures (when compared to VCI) levels where clearly buys are interested vs not interested.
Example:
If VCI > MCI
- Shows buyer's are more than interested in buying, you've either hit a bottom or heavy resistance
if MCI > VCI
- Show's buyer's aren't interested and will most likely result in a dump/lower price
Great for monitoring accumulation and distribution, these auto buy and sells look for the transition points over 0, works on EVERY commodity/stock/FOREX/Crypto
Results are from trading 1 BTC x25 leveraging. Not all trades will get in if put in at limit, but it does survive with profits after the massive 0.075 fee (results shown are after fees)

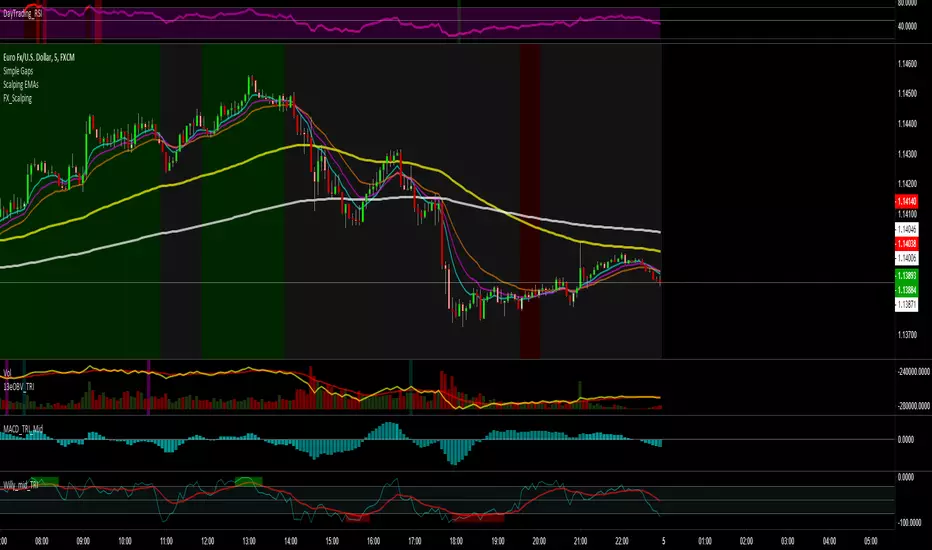
OBV with 13 EMA - TRIOn Balance Volume with 13 Exponential Moving Average.
Taught in school Level 1 program.
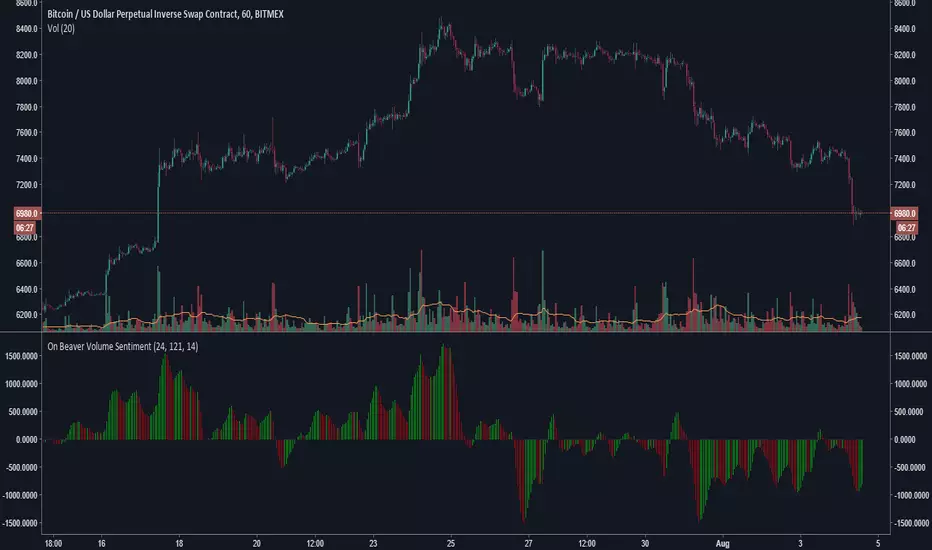
On Beaver Volume SentimentGeneral Market sentiment decoded from two Lazybear OBV's and a CCI.
Lots of strategies with this.
Main point is this indicator tries to be extra sensitive to relative volume changes but keep grounded in sentiment with the cci.
Let me know if you use this!
-Beaverman
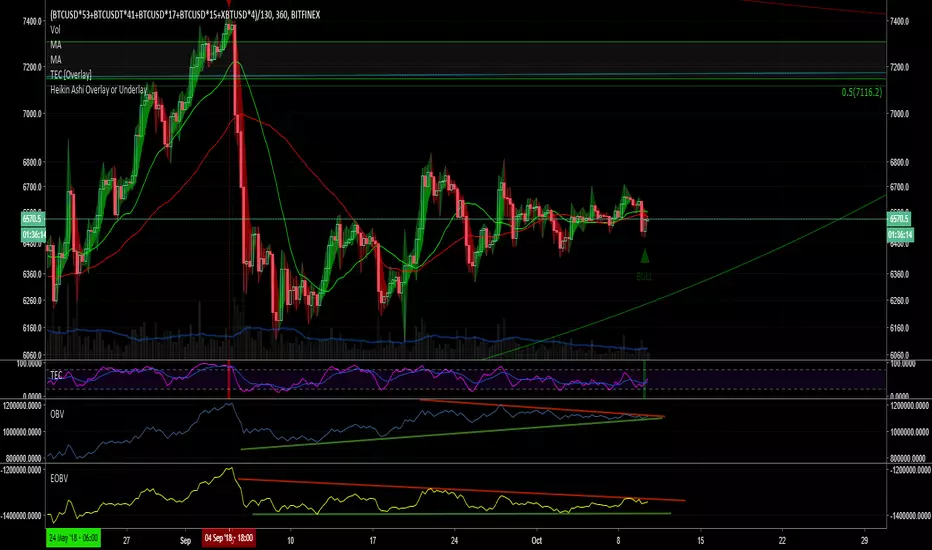
Accumulation/Distribution Volume (ADV) [cI8DH]This is the simplified and optimized version of my original ADV indicator. It shows both regular volume bars and the accumulated/distributed (A/D) portion of them. The equation is elegant and intuitive. It calculates candle body to candle height ratio and multiplies it by volume: volume*(close-open)/(high-low). This is the building block of my three other indicators, ADL, ADP and ADMF.
- The volume bars has two shades of green and red. The dark shade shows amount of A/D and the light shade shows total volume (what you see on a regular volume indicator).
When money volume is enabled, volume is multiplied by price. As you can see in the chart below, trade volume in terms of USD was growing over the past years.
- Blue line is the moving average of A/D and the orange line is for total volume. When "Baseline Chart" option is enabled, this moving average is identical to ADMF indicator which can be a powerful indicator for assessing buy/sell pressure as well as money flow and volume divergences. You can turn off volume bars (from style menu) for better visibility or you can use the below indicators.
Please note that ADMF is now available as a part of ADP indicator as well and I recommend using the latter since ADP can also replace CMF and MFI indicators.
- If you change the aggregation to cumulative (while having money volume disabled), the gray line becomes identical to On Balance Volume (OBV) and the blue line identical to my ADL indicator. The latter I would argue is more accurate than Chaikin's ADL, William's A/D and OBV.

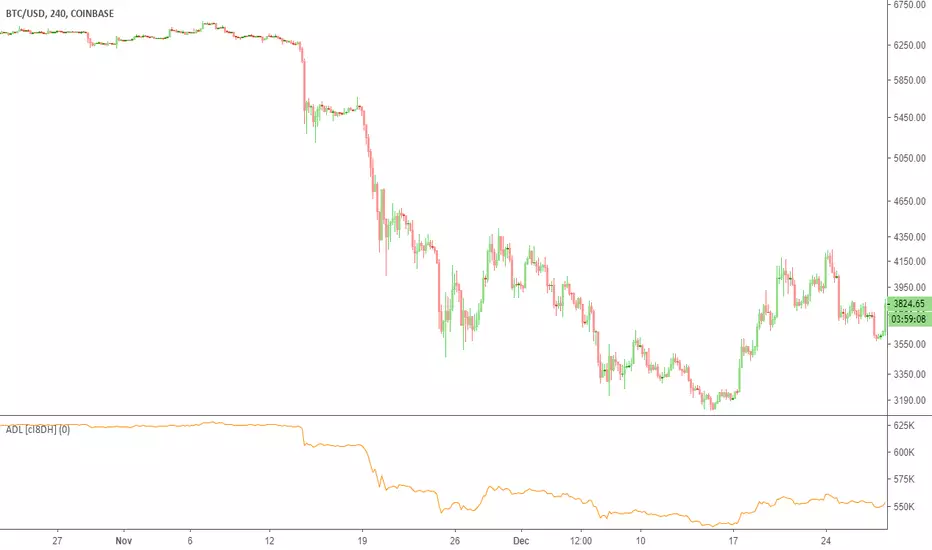
Accumulation/Distribution Level (ADL) [Cyrus c|:D]This indicator shows Accumulation/Distribution level which can be used for confirming trends or reversals (via divergence). It is an alternative to Chaikin's Accumulation/Distribution Line (ADL) and On Balance Volume (OBV) indicators. It can also replicate PVT and OBV via options in the input menu.
Here is a comparison of four related indicators:
OBV is too simple and has serious flaws as explained in PVT's wiki.
Chaikin's ADL is a broken indicator as can be seen in the chart below:
A/D Level addresses the flaws in these two indicators. It simply sums up portions of the volume that contributes to price change. These portions are visualized in dark green and red on "Accumulation/Distribution Volume (ADV)" indicator. This can also be achieved by ADV indicator if you are nerd enough.
PS: There is Williams A/D as well which is also a broken indicator.
Accumulation/Distribution VolumeThis is a simple yet powerful indicator that can replace volume, Money Flow, Chaikin Money Flow, Price Volume Trend (PVT), Accumulation/Distribution Line (ADL), On Balance Volume (OBV).
When "Baseline Chart" option is disabled, it looks similar to regular volume. The volume bars has two shades of green and red. The dark shade shows amount of accumulation and the light shade shows total volume (what you see on a regular volume indicator). Blue line is the moving average (or cumulative total) of A/D and the gray line is for total volume.
When money volume is enabled, volume it multiplied by price. As you can see in the chart below, trade volume in terms of USD was declining after ATH. This is not the case in regular volume chart which shows instrument volume (chart above).
In Baseline view, the aggregation method you choose can turn it into different indicators. With EMA/SMA aggregation, blue and gray line shows buy/sell pressure. At 0, there is not buy or sell pressure.
If you turn off volume bars (from style menu), it gives you a reliable indicator to measure divergence. This should be more reliable than most other range-bound indicators (i.e. RSI, MFI, CMF). I will publish a TA about correctly measuring divergence (it's a must read even if you are a pro trader). Make sure that the length is set to a large number on smaller TFs such as 4h.
For following results, set aggregation to cumulative and turn off money volume:
When wick weight=0, the GRAY line is identical to OBV indicator.
When normalized by spread and wick weight=10, the BLUE line is identical to ADL (improved by true range).
When normalized by previous bar price, wick weight=0, the BLUE line is identical to PVT.
How I use this indicator:
- Baseline chart, replaced my regular volume indicator
- Mostly 4h TF for divergence
- EMA aggregation (and occasional cumulative aggregation) with length above 50. I change the length to 100 and 200 for confirmation.
- Wick weight=0 or max 2.
With this indicator, you can learn how different indicators are built and how they are different from each other. I will publish a TA to explain more about different indicators and their pros and cons.
I will publish this indicator without volume bars and additional options to make it range bound.

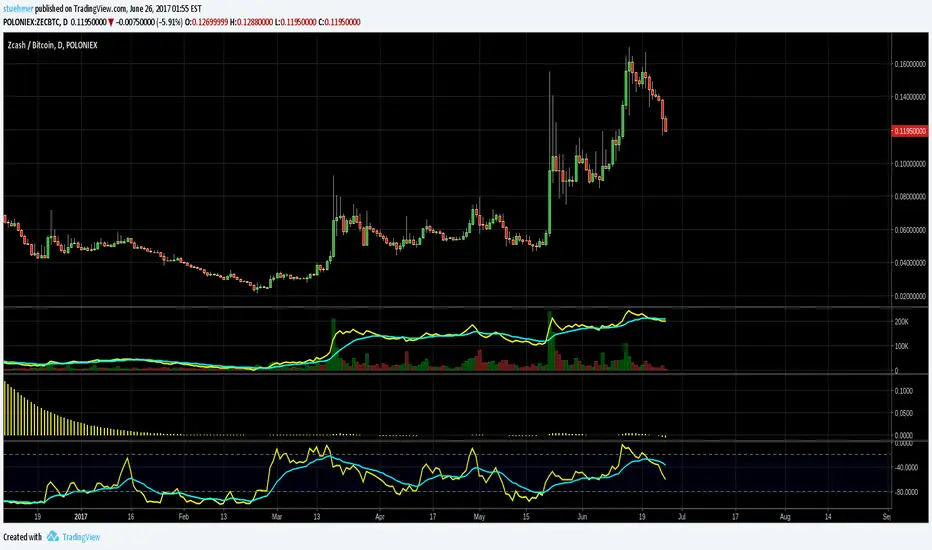
CCI OBV 4Kmod of lazy bear's OBV coded CCI , which indicates CCI state by changing the color of the OBV. now it shows you when CCI is overbought or oversold, not just one or the other
when CCI > 100, that's an oversold signal and OBV line turns green
when CCO -0.54% < -100, that's an undersold signal and OBV line turns red
CCI threshold can be changed (ex. 200 and -200)
EMA is overlaid, too, in orange, and that period can be changed

RIZ OBV with coloured CCIThis ones useful for spotting divergence on OBV, and also includes CCI to show overbought and oversold areas in the volume. I've coloured the OBV bar with the CCI levels. Look for divergence (best results on 5min chart I believe) with this and you can spot where to sell if a second peak is not supported by volume, also shows where the big guns are dumping lots of volume!
A volume study is always a good addition to any analysis I feel, and this is one of my day to day always on indicators.

OBV Daily ResetJust a quick OBV indicator for intraday trading that resets to 0 at the start of each new session (based on dayofmonth changes). I saw someone looking for this in chat and jotted it down for him.

SB_CCI coded OBV StrategyStrategy-
Buy Order: Previous obv value is green and obv_cci coded line crosses over ema line
Sell Order: Previous obv value is red and obv_cci coded line crosses under ema line.
Original Idea:
Preferable for day/week intervals.
For Tips to continue :) -
BTC: 1BjswGcRR6c23pka7qh5t5k56j46cuyyy2
ETH: 0x64fed71c9d6c931639c7ba4671aeb6b05e6b3781
LTC: LKT2ykQ8QSzzfTDB6Tnsf12xwYPjgq95h4

On Balance Volume (CCI-coded) [Krypt]This is a straightforward modification of LazyBear's CCI-coded OBV indicator with the following changes:
1) uses log-hl2 as source, which seems to be a more stable indicator of price change than close
2) adds optional price smoothing

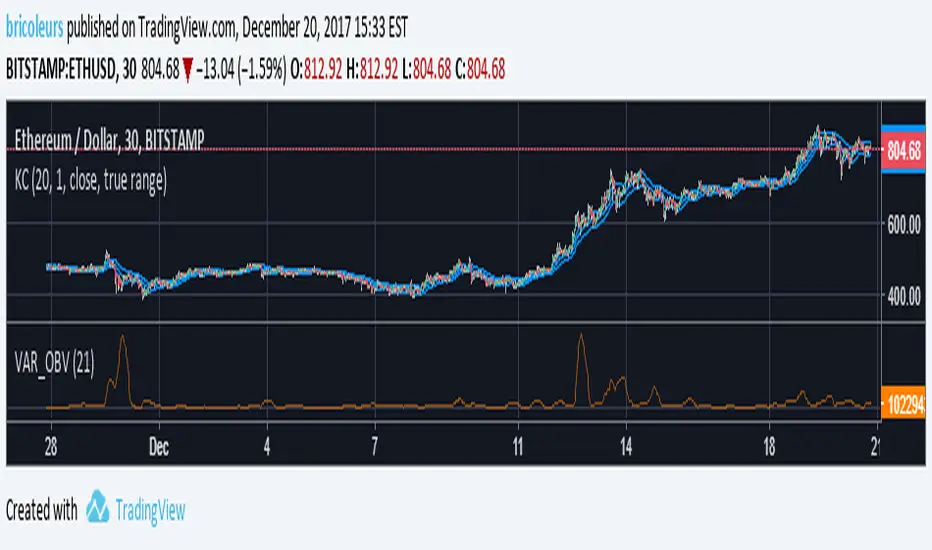
Variance of OBVIDEA is to easily spot the length of a calm periods based on OBV.
Some says that after a longer OBV-calm (but not supercalm) period up or down rallies are somewhat more likely)
METHOD: variance of OBV
ADVISE: cannot be used on its own, just with others (RSI, CCI, Coppock, MACD etc.)
Period shall be adjusted to the market.
PERSONAL: I also use it to evaluate how long an uptrend/downtrend is "normal" and when it is a "changer".
Also to see if a market is too flat. (No changes in flat periods is also not a good sign for me)
Also to evaluate magnitude of bursts.
Have fun, use stops, avoid FOMO and comments welcome!
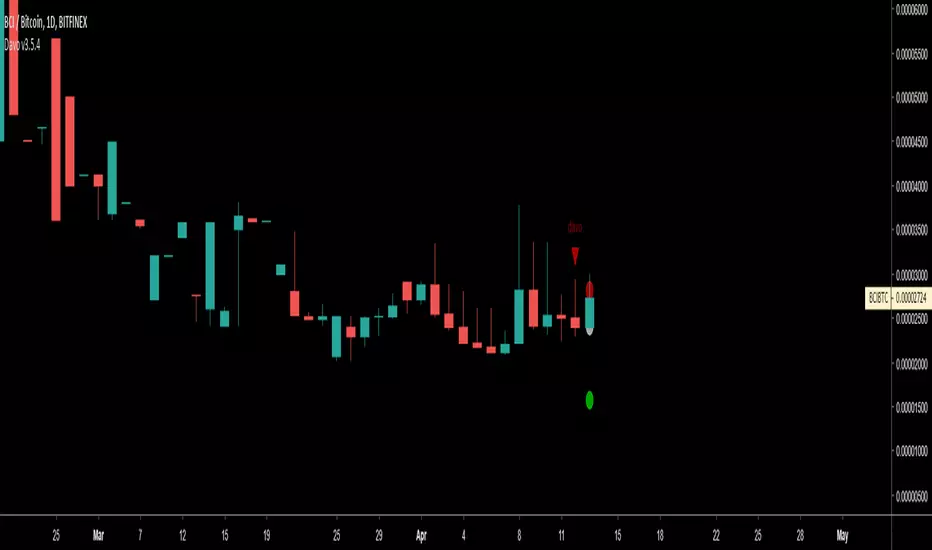
Dav-o meter (public)I decided to make this formerly invite only script public (you can find the invite only version here
If you are part of the invite only you don't need to change scripts. I will push improvements first on the invite only script but in time it will come to this version as well.
I would love to know your ideas and thoughts on how this indicator can be improved, so feel free to give any feedback.
Remember to give it a thumbs up if you like it.
On Balance VolumeThe script applies an EMA to OBV . By default, the EMA=13 periods. All calculations are based off the closing price.
[ST] obv adl combination v4modified equation using sum of volume*hlc3*(close-open)/(high-low) to give more accuracy of distribution within a single candle unlike regular obv.

