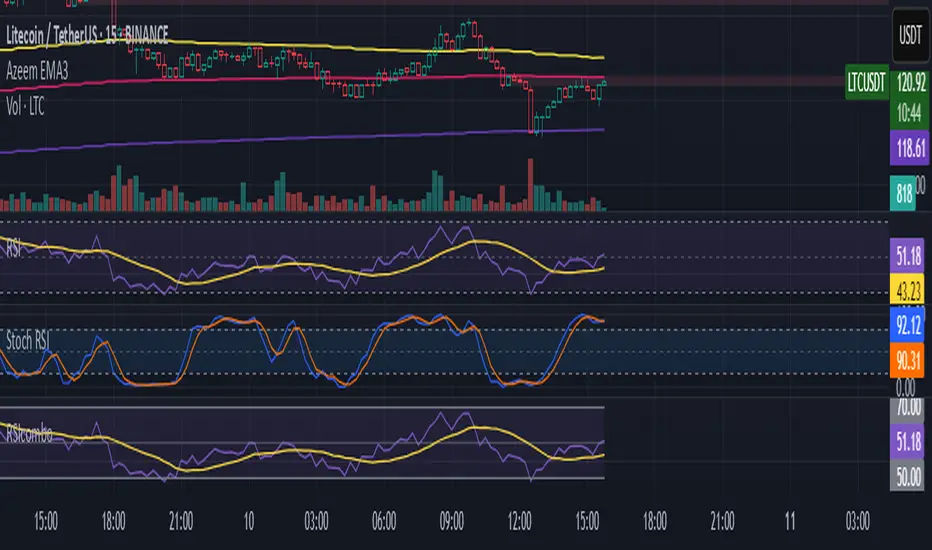
RSI/Stoch RSI ComboIt shows both rsi and stoch rsi as one indicator. You need to select which one using checkbox.
Oscillators
Smart Money Proxy IndexOverview
The Smart Money Proxy Index (SMPI) is an educational tool that attempts to identify potential institutional-style behavior patterns using publicly available market data. This comprehensive tool combines multiple institutional analysis techniques into a single, easy-to-read 0-100 oscillator.
Important Disclaimer
This is an educational proxy indicator that analyzes volume and price patterns. It cannot identify actual institutional trading activity and should not be interpreted as tracking real "smart money." Use for educational purposes and combine with other analysis methods.
Inspiration & Methodology
This indicator is inspired by MAPsignals' Big Money Index (BMI) methodology but uses publicly available price and volume data with original calculations. This is an independent educational interpretation designed to teach smart money concepts to retail traders.
What It Analyzes
SMPI tracks potential "smart money" activity by combining:
Block Trading Detection - Identifies unusual volume surges with significant price impact
Money Flow Analysis - Volume-weighted price pressure using Money Flow Index
Accumulation/Distribution Patterns - Modified On-Balance Volume signals
Institutional Control Proxy - End-of-day positioning and control analysis
Key Features
– Multi-Component Analysis - Combines 4 different institutional detection methods
– BMI-Style 0-100 Scale - Familiar oscillator range with clear extreme levels
– Professional Visualization - Dynamic colors, gradient fills, and clean data table
– Comprehensive Alerts - Buy/sell signals plus divergence detection
– Fully Customizable - Adjust all parameters, colors, and display options
– Non-Repainting Signals - All alerts use confirmed data for reliability
– Educational Focus - Designed to teach institutional flow concepts
How to Interpret
Above 80: Potential smart money distribution phase (bearish pressure)
Below 20: Potential smart money accumulation phase (bullish opportunity)
Signal Generation: Buy signals when crossing above 20, sell signals when crossing below 80
Divergences: Price vs SMPI divergences can signal potential trend changes
Volume Confirmation: Higher volume ratios strengthen signal reliability
Best Practices
Timeframes: Works best on higher timeframes for institutional behavior analysis
Confirmation: Combine with other technical analysis tools and market context
Volume: Pay attention to volume confirmation in the data table
Context: Consider overall market conditions and fundamental factors
Risk Management: Not recommended as standalone trading system
Customizable Parameters
Block Volume Threshold: Sensitivity for unusual volume detection (default: 2.5x average)
SMPI Smoothing Period: Index calculation smoothing (default: 25 bars)
Extreme Levels: Overbought/oversold thresholds (default: 80/20)
Money Flow Length: MFI calculation period (default: 14)
Visual Options: Colors, signals, and display preferences
Available Alerts
Buy Signal: SMPI crosses above oversold level (20)
Sell Signal: SMPI crosses below overbought level (80)
Extreme Levels: Alerts when reaching overbought/oversold zones
Divergence Detection: Bullish and bearish price vs SMPI divergences
Educational Purpose & Limitations
This indicator is designed as an educational proxy for understanding institutional flow concepts. It analyzes publicly available price and volume data to identify potential smart money behavior patterns.
Cannot access actual institutional transaction data
Signals may be slower than day-trading indicators (intentionally designed for institutional timeframes)
Should be used in conjunction with other analysis methods
Past performance does not guarantee future results
What Makes This Different
Unlike simple volume or momentum indicators, SMPI combines multiple institutional analysis techniques into one comprehensive tool. The multi-component approach provides a more robust view of potential smart money activity.

B-Xtrender MTF Companion (custom colors + zero)B-Xtrender MTF Companion (Custom Colors + Zero)
This indicator is a multi-timeframe companion tool for the B-Xtrender system, designed to track momentum shifts across your current chart timeframe and up to two higher timeframes — all in one panel.
Key Features:
Multi-Timeframe Momentum: Plots histogram + signal line for current TF, HTF-1, and HTF-2, with independent color/offset settings for easy visual stacking.
Custom Styling: Full color and width control for bullish/bearish histograms, signal lines, and the zero line.
Smoothing Options: Choose between EMA or T3 smoothing for cleaner signals.
Momentum Flip Alerts: Built-in alert conditions for bullish or bearish flips on each timeframe.
Zero Line Control: Toggle, recolor, and restyle the zero reference line.
How It Works:
The B-Xtrender MTF Companion calculates the difference between two EMAs, applies RSI normalization, and then plots it as a centered oscillator. The signal line slope and histogram color indicate momentum direction, while higher-timeframe signals help confirm trend strength and avoid false entries.
Best Use:
Pair with price action or your primary B-Xtrender setup for trend confirmation.
Monitor higher timeframe momentum while trading intraday.
Combine alert flips with your entry rules for more timely trade triggers.

MACD-V (Volatility-Normalised Momentum) — Spiroglou, 2022Volatility-normalized MACD per Alex Spiroglou (2022):
MACD-V = (EMA12 − EMA26) / ATR26 × 100, so momentum is expressed in ATR units and stays comparable across assets/timeframes.
What you get
• Trend-colored line: green when price ≥ EMA200, red otherwise.
• Guides: ±50 / ±100 / 0; Extremes: ±140 (editable).
• Regime shading: OB ≥ +140 shaded red; OS ≤ −140 shaded green.
• Clean, on-curve markers: small circles on the MACD-V line at the four edge events — OB (enter ≥ +threshold), OBX (cross back down), OS (enter ≤ −threshold), OSX (cross back up).
• Text labels are off by default; optional toggle only for OB/OBX.
• Signal & histogram: EMA(9) of MACD-V and (MACD-V − Signal) columns.
• Alerts: OB/OS entries & exits included.
How to use
• Favor longs when MACD-V > 0 (ideally > +50); respect OB for possible exhaustion.
• Favor shorts when MACD-V < 0 (ideally < −50); respect OS for possible exhaustion.
• Because it’s ATR-normalized, thresholds transfer well across symbols and timeframes.

SMI Base-Trigger Bullish Re-acceleration (Higher High)Description
What it does
This indicator highlights a two-step bullish pattern using Stochastic Momentum Index (SMI) plus an ATR distance filter:
1. Base (orange) – Marks a momentum “reset.” A base prints when SMI %K crosses up through %D while %K is below the Base level (default -70). The base stores the base price and starts a waiting window.
2. Trigger (green) – Confirms momentum and price strength. A trigger prints only if, before the timeout window ends:
• SMI %K crosses up through %D again,
• %K is above the Trigger level (default -60),
• Close > Base Price, and
• Price has advanced at least Min ATR multiple (default 1.0× the 14-period ATR) above the base price.
A dashed green line connects the base to the trigger.
Why it’s useful
It seeks a bullish divergence / reacceleration: momentum recovers from deeply negative territory, then price reclaims and exceeds the base by a volatility-aware margin. This helps filter out weak “oversold bounces.”
Signals
• Base ▲ (orange): Potential setup begins.
• Trigger ▲ (green): Confirmation—momentum and price agree.
Inputs (key ones)
• %K Length / EMA Smoothing / %D Length: SMI construction.
• Base when %K < (default -70): depth required for a valid reset.
• Trigger when %K > (default -60): strength required on confirmation.
• Base timeout (days) (default 100): maximum look-ahead window.
• ATR Length (default 14) and Min ATR multiple (default 1.0): price must exceed the base by this ATR-scaled distance.
How traders use it (example rules)
• Entry: On the Trigger.
• Risk: A common approach is a stop somewhere between the base price and a multiple of ATR below trigger; or use your system’s volatility stop.
• Exits: Your choice—trend MA cross, fixed R multiple, or structure-based levels.
Notes & tips
• Works best on liquid symbols and mid-to-higher timeframes (reduce noise).
• Increase Min ATR multiple to demand stronger price confirmation; tighten or widen Base/Trigger levels to fit your market.
• This script plots signals only; convert to a strategy to backtest entries/exits.

Clean Multi-Indicator Alignment System
Overview
A sophisticated multi-indicator alignment system designed for 24/7 trading across all markets, with pure signal-based exits and no time restrictions. Perfect for futures, forex, and crypto markets that operate around the clock.
Key Features
🎯 Multi-Indicator Confluence System
EMA Cross Strategy: Fast EMA (5) and Slow EMA (10) for precise trend direction
VWAP Integration: Institution-level price positioning analysis
RSI Momentum: 7-period RSI for momentum confirmation and reversal detection
MACD Signals: Optimized 8/17/5 configuration for scalping responsiveness
Volume Confirmation: Customizable volume multiplier (default 1.6x) for signal validation
🚀 Advanced Entry Logic
Initial Full Alignment: Requires all 5 indicators + volume confirmation
Smart Continuation Entries: EMA9 pullback entries when trend momentum remains intact
Flexible Time Controls: Optional session filtering or 24/7 operation
🎪 Pure Signal-Based Exits
No Forced Closes: Positions exit only on technical signal reversals
Dual Exit Conditions: EMA9 breakdown + RSI flip OR MACD cross + EMA20 breakdown
Trend Following: Allows profitable trends to run their full course
Perfect for Swing Scalping: Ideal for multi-session position holding
📊 Visual Interface
Real-Time Status Dashboard: Live alignment monitoring for all indicators
Color-Coded Candles: Instant visual confirmation of entry/exit signals
Clean Chart Display: Toggle-able EMAs and VWAP with professional styling
Signal Differentiation: Clear labels for entries, X-crosses for exits
🔔 Alert System
Entry Notifications: Separate alerts for buy/sell signals
Exit Warnings: Technical breakdown alerts for position management
Mobile Ready: Push notifications to TradingView mobile app
Market Applications
Perfect For:
Gold Futures (GC): 24-hour precious metals trading
NASDAQ Futures (NQ): High-volatility index scalping
Forex Markets: Currency pairs with continuous operation
Crypto Trading: 24/7 cryptocurrency momentum plays
Energy Futures: Oil, gas, and commodity swing trades
Optimal Timeframes:
1-5 Minutes: Ultra-fast scalping during high volatility
5-15 Minutes: Balanced approach for most markets
15-30 Minutes: Swing scalping for trend following
🧠 Smart Position Management
Tracks implied position direction
Prevents conflicting signals
Allows trend continuation entries
State-aware exit logic
⚡ Scalping Optimized
Fast-reacting indicators with shorter periods
Volume-based confirmation reduces false signals
Clean entry/exit visualization
Minimal lag for time-sensitive trades
Configuration Options
All parameters fully customizable:
EMA Lengths: Adjustable from 1-30 periods
RSI Period: 1-14 range for different market conditions
MACD Settings: Fast (1-15), Slow (1-30), Signal (1-10)
Volume Confirmation: 0.5-5.0x multiplier range
Visual Preferences: Colors, displays, and table options
Risk Management Features
Clear visual exit signals prevent emotion-based decisions
Volume confirmation reduces false breakouts
Multi-indicator confluence improves signal quality
Optional time filtering for session-specific strategies
Best Use Cases
Futures Scalping: NQ, ES, GC during active sessions
Forex Swing Trading: Major pairs during overlap periods
Crypto Momentum: Bitcoin, Ethereum trend following
24/7 Automated Systems: Algorithmic trading implementation
Multi-Market Scanning: Portfolio-wide signal monitoring

Cycle Phase & ETA Tracker [Robust v4]
Cycle Phase & ETA Tracker
Description
The Cycle Phase & ETA Tracker is a powerful tool for analyzing market cycles and predicting the completion of the current cycle (Estimated Time of Arrival, or ETA). It visualizes the cycle phase (0–100%) using a smoothed signal and displays the forecasted completion date with an optional confidence band based on cycle length variability. Ideal for traders looking to time their trades based on cyclical patterns, this indicator offers flexible settings for robust cycle analysis.
Key Features
Cycle Phase Visualization: Tracks the current cycle phase (0–100%) with color-coded zones: green (0–33%), blue (33–66%), orange (66–100%).
ETA Forecast: Shows a vertical line and label indicating the estimated date of cycle completion.
Confidence Band (±σ): Displays a band around the ETA to reflect uncertainty, calculated using the standard deviation of cycle lengths.
Multiple Averaging Methods: Choose from three methods to calculate average cycle length:
Median (Robust): Uses the median for resilience against outliers.
Weighted Mean: Prioritizes recent cycles with linear or quadratic weights.
Simple Mean: Applies equal weights to all cycles.
Adaptive Cycle Length: Automatically adjusts cycle length based on the timeframe or allows a fixed length.
Debug Histogram: Optionally displays the smoothed signal for diagnostic purposes.
Setup and Usage
Add the Indicator:
Search for "Cycle Phase & ETA Tracker " in TradingView’s indicator library and apply it to your chart.
Configure Parameters:
Core Settings:
Track Last N Cycles: Sets the number of recent cycles used to calculate the average cycle length (default: 20). Higher values provide stability but may lag market shifts.
Source: Selects the data source for analysis (e.g., close, open, high; default: close price).
Use Adaptive Cycle Length?: Enables automatic cycle length adjustment based on timeframe (e.g., shorter for intraday, longer for daily) or uses a fixed length if disabled.
Fixed Cycle Length: Defines the cycle length in bars when adaptive mode is off (default: 14). Smaller values increase sensitivity to short-term cycles.
Show Debug Histogram: Enables a histogram of the smoothed signal for debugging signal behavior.
Cycle Length Estimation:
Average Mode: Selects the method for calculating average cycle length: "Median (Robust)", "Weighted Mean", or "Simple Mean".
Weights (for Weighted Mean): For "Weighted Mean", chooses "linear" (moderate emphasis on recent cycles) or "quadratic" (strong emphasis on recent cycles).
ETA Visualization:
Show ETA Line & Label: Toggles the display of the ETA line and date label.
Show ETA Confidence Band (±σ): Toggles the confidence band around the ETA, showing the uncertainty range.
Band Transparency: Adjusts the transparency of the confidence band (0 = fully transparent, 100 = fully opaque; default: 85).
ETA Color: Sets the color for the ETA line, label, and confidence band (default: orange).
Interpretation:
The cycle phase (0–100%) indicates progress: green for the start, blue for the middle, and orange for the end of the cycle.
The ETA line and label show the predicted cycle completion date.
The confidence band reflects the uncertainty range (±1 standard deviation) of the ETA.
If a warning "Insufficient cycles for ETA" appears, wait for the indicator to collect at least 3 cycles.
Limitations
Requires at least 3 cycles for reliable ETA and confidence band calculations.
On low timeframes or low-volatility markets, zero-crossings may be infrequent, delaying ETA updates.
Accuracy depends on proper cycle length settings (adaptive or fixed).
Notes
Test the indicator across different assets and timeframes to optimize settings.
Use the debug histogram to troubleshoot if the ETA appears inaccurate.
For feedback or suggestions, contact the author via TradingView.
Cycle Phase & ETA Tracker
Описание
Индикатор Cycle Phase & ETA Tracker предназначен для анализа рыночных циклов и прогнозирования времени завершения текущего цикла (ETA — Estimated Time of Arrival). Он отслеживает фазы цикла (0–100%) на основе сглаженного сигнала и отображает предполагаемую дату завершения цикла с опциональной доверительной полосой, основанной на стандартном отклонении длин циклов. Индикатор идеально подходит для трейдеров, которые хотят выявлять циклические закономерности и планировать свои действия на основе прогнозируемого времени.
Ключевые особенности
Фазы цикла: Визуализирует текущую фазу цикла (0–100%) с цветовой кодировкой: зеленый (0–33%), синий (33–66%), оранжевый (66–100%).
Прогноз ETA: Показывает вертикальную линию и метку с предполагаемой датой завершения цикла.
Доверительная полоса (±σ): Отображает зону неопределенности вокруг ETA, основанную на стандартном отклонении длин циклов.
Гибкие методы усреднения: Поддерживает три метода расчета средней длины цикла:
Median (Robust): Медиана, устойчивая к выбросам.
Weighted Mean: Взвешенное среднее, где недавние циклы имеют больший вес (линейный или квадратичный).
Simple Mean: Простое среднее с равными весами.
Адаптивная длина цикла: Автоматически подстраивает длину цикла под таймфрейм или позволяет задать фиксированную длину.
Отладочная гистограмма: Опционально отображает сглаженный сигнал для анализа.
Настройка и использование
Добавьте индикатор:
Найдите "Cycle Phase & ETA Tracker " в библиотеке индикаторов TradingView и добавьте его на график.
Настройте параметры:
Core Settings:
Track Last N Cycles: Количество последних циклов для расчета средней длины (по умолчанию 20). Большие значения дают более стабильные результаты, но могут запаздывать.
Source: Источник данных (по умолчанию цена закрытия).
Use Adaptive Cycle Length?: Включите для автоматической настройки длины цикла по таймфрейму или отключите для использования фиксированной длины.
Fixed Cycle Length: Длина цикла в барах, если адаптивная длина отключена (по умолчанию 14).
Show Debug Histogram: Включите для отображения сглаженного сигнала (полезно для отладки).
Cycle Length Estimation:
Average Mode: Выберите метод усреднения: "Median (Robust)", "Weighted Mean" или "Simple Mean".
Weights (for Weighted Mean): Для режима "Weighted Mean" выберите "linear" (умеренный вес для новых циклов) или "quadratic" (сильный вес для новых циклов).
ETA Visualization:
Show ETA Line & Label: Включите для отображения линии и метки ETA.
Show ETA Confidence Band (±σ): Включите для отображения доверительной полосы.
Band Transparency: Прозрачность полосы (0 — полностью прозрачная, 100 — полностью непрозрачная, по умолчанию 85).
ETA Color: Цвет для линии, метки и полосы (по умолчанию оранжевый).
Интерпретация:
Фаза цикла (0–100%) показывает прогресс текущего цикла: зеленый — начало, синий — середина, оранжевый — конец.
Линия и метка ETA указывают предполагаемую дату завершения цикла.
Доверительная полоса показывает диапазон неопределенности (±1 стандартное отклонение).
Если отображается предупреждение "Insufficient cycles for ETA", дождитесь, пока индикатор соберет минимум 3 цикла.
Ограничения
Требуется минимум 3 цикла для надежного расчета ETA и доверительной полосы.
На низких таймфреймах или рынках с низкой волатильностью пересечения нуля могут быть редкими, что замедляет обновление ETA.
Эффективность зависит от правильной настройки длины цикла (fixedL или адаптивной).
Примечания
Протестируйте индикатор на разных таймфреймах и активах, чтобы подобрать оптимальные параметры.
Используйте отладочную гистограмму для анализа сигнала, если ETA кажется неточным.
Для вопросов или предложений по улучшению свяжитесь через TradingView.

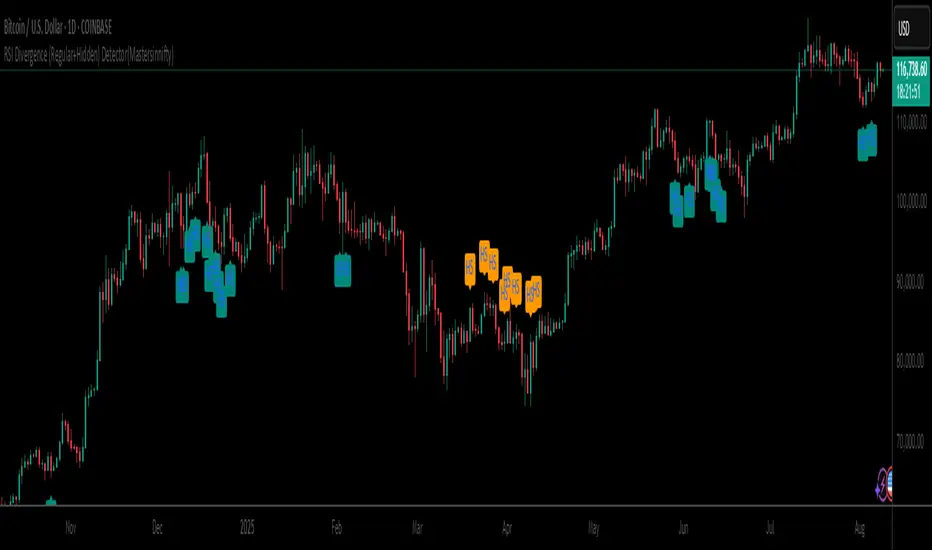
RSI Divergence (Regular+Hidden) Detector(Mastersinnifty)Description
The RSI Divergence (Regular + Hidden) Detector identifies both regular and hidden divergences between price and the Relative Strength Index (RSI). It automatically marks divergence points on the chart using short-form labels for quick recognition:
RB – Regular Bullish Divergence
RS – Regular Bearish Divergence
HB – Hidden Bullish Divergence
HS – Hidden Bearish Divergence
This tool helps traders spot potential reversals or trend continuation setups with clear, on-chart visual signals.
How It Works
Calculates RSI based on user-selected source and length.
Scans a specified lookback range for matching high/low points in price and RSI.
Validates divergences based on minimum RSI difference and minimum price percentage difference.
Marks detected divergences with short-form labels directly on the price chart.
Allows toggling between regular and hidden divergence detection.
Inputs
RSI Length – Period for RSI calculation.
Lookback Bars – Number of bars to scan for divergence.
Minimum RSI Difference – Minimum required RSI value change between points.
Minimum Price Difference (%) – Minimum required price percentage change between points.
Overbought / Oversold Levels – RSI thresholds for signal validation.
Show Regular Divergences – Enable/disable regular divergence detection.
Show Hidden Divergences – Enable/disable hidden divergence detection.
Use Case
Identify potential reversal points using regular divergences.
Spot possible trend continuation opportunities with hidden divergences.
Enhance entry/exit timing by combining divergence signals with other technical tools.
Apply in any market and timeframe, from scalping to swing trading.
Disclaimer
This indicator is for educational and research purposes only. It does not guarantee future performance. Always combine signals with your own analysis and risk management strategy before making trading decisions.
Market Regime Matrix [Alpha Extract]A sophisticated market regime classification system that combines multiple technical analysis components into an intelligent scoring framework to identify and track dominant market conditions. Utilizing advanced ADX-based trend detection, EMA directional analysis, volatility assessment, and crash protection protocols, the Market Regime Matrix delivers institutional-grade regime classification with BULL, BEAR, and CHOP states. The system features intelligent scoring with smoothing algorithms, duration filters for stability, and structure-based conviction adjustments to provide traders with clear, actionable market context.
🔶 Multi-Component Regime Engine Integrates five core analytical components: ADX trend strength detection, EMA-200 directional bias, ROC momentum analysis, Bollinger Band volatility measurement, and zig-zag structure verification. Each component contributes to a sophisticated scoring system that evaluates market conditions across multiple dimensions, ensuring comprehensive regime assessment with institutional precision.
// Gate Keeper: ADX determines market type
is_trending = adx_value > adx_trend_threshold
is_ranging = adx_value <= adx_trend_threshold
is_maximum_chop = adx_value <= adx_chop_threshold
// BULL CONDITIONS with Structure Veto
if price_above_ema and di_bullish
if use_structure_filter and isBullStructure
raw_bullScore := 5.0 // MAXIMUM CONVICTION: Strong signals + Bull structure
else if use_structure_filter and not isBullStructure
raw_bullScore := 3.0 // REDUCED: Strong signals but broken structure
🔶 Intelligent Scoring System Employs a dynamic 0-5 scale scoring mechanism for each regime type (BULL/BEAR/CHOP) with adaptive conviction levels. The system automatically adjusts scores based on signal alignment, market structure confirmation, and volatility conditions. Features decision margin requirements to prevent false regime changes and includes maximum conviction thresholds for high-probability setups.
🔶 Advanced Structure Filter Implements zig-zag based market structure analysis using configurable deviation thresholds to identify significant pivot points. The system tracks Higher Highs/Higher Lows (HH/HL) for bullish structure and Lower Lows/Lower Highs (LL/LH) for bearish structure, applying structure veto logic that reduces conviction when price action contradicts the underlying trend framework.
// Define Market Structure (Bull = HH/HL, Bear = LL/LH)
isBullStructure = not na(last_significant_high) and not na(prev_significant_high) and
not na(last_significant_low) and not na(prev_significant_low) and
last_significant_high > prev_significant_high and last_significant_low > prev_significant_low
isBearStructure = not na(last_significant_high) and not na(prev_significant_high) and
not na(last_significant_low) and not na(prev_significant_low) and
last_significant_low < prev_significant_low and last_significant_high < prev_significant_high
🔶 Superior Engine Components Features dual-layer regime stabilization through score smoothing and duration filtering. The score smoothing component reduces noise by averaging raw scores over configurable periods, while the duration filter requires minimum regime persistence before confirming changes. This eliminates whipsaws and ensures regime transitions represent genuine market shifts rather than temporary fluctuations.
🔶 Crash Detection & Active Penalties Incorporates sophisticated crash detection using Rate of Change (ROC) analysis with severity classification. When crash conditions are detected, the system applies active penalties (-5.0) to BULL and CHOP scores while boosting BEAR conviction based on crash severity. This ensures immediate regime response to major market dislocations and drawdown events.
// === CRASH OVERRIDE (Active Penalties) ===
is_crash = roc_value < crash_threshold
if is_crash
// Calculate crash severity
crash_severity = math.abs(roc_value / crash_threshold)
crash_bonus = 4.0 + (crash_severity - 1.0) * 2.0
// ACTIVE PENALTIES: Force bear dominance
raw_bearScore := math.max(raw_bearScore, crash_bonus)
raw_bullScore := -5.0 // ACTIVE PENALTY
raw_chopScore := -5.0 // ACTIVE PENALTY
❓How It Works
🔶 ADX-Based Market Classification The Market Regime Matrix uses ADX (Average Directional Index) as the primary gatekeeper to distinguish between trending and ranging market conditions. When ADX exceeds the trend threshold, the system activates BULL/BEAR regime logic using DI+/DI- crossovers and EMA positioning. When ADX falls below the ranging threshold, CHOP regime logic takes precedence, with maximum conviction assigned during ultra-low ADX periods.
🔶 Dynamic Conviction Scaling Each regime receives conviction ratings from UNCERTAIN to MAXIMUM based on signal alignment and score magnitude. MAXIMUM conviction (5.0 score) requires perfect signal alignment plus favorable market structure. The system progressively reduces conviction when signals conflict or structure breaks, ensuring traders understand the reliability of each regime classification.
🔶 Regime Transition Management Implements decision margin requirements where new regimes must exceed existing regimes by configurable thresholds before transitions occur. Combined with duration filtering, this prevents premature regime changes and maintains stability during consolidation periods. The system tracks both raw regime signals and final regime output for complete transparency.
🔶 Visual Regime Mapping Provides comprehensive visual feedback through colored candle overlays, background regime highlighting, and real-time information tables. The system displays regime history, conviction levels, structure status, and key metrics in an organized dashboard format. Regime changes trigger immediate visual alerts with detailed transition information.
🔶 Performance Optimization Features efficient array management for zig-zag calculations, smart variable updating to prevent recomputation, and configurable debug modes for strategy development. The system maintains optimal performance across all timeframes while providing institutional-grade analytical depth.
Why Choose Market Regime Matrix ?
The Market Regime Matrix represents the evolution of market regime analysis, combining traditional technical indicators with modern algorithmic decision-making frameworks. By integrating multiple analytical dimensions with intelligent scoring, structure verification, and crash protection, it provides traders with institutional-quality market context that adapts to changing conditions. The sophisticated filtering system eliminates noise while preserving responsiveness, making it an essential tool for traders seeking to align their strategies with dominant market regimes and avoid adverse market environments.

RSI + MACD Long-Only StrategyRSI + MACD Long-Only Strategy
Overview: Momentum-based, long-only strategy combining RSI and MACD. Entries favor upside momentum; exits trigger on momentum fades or risk targets. Signals are state-gated so you get one exit per entry (no multiple exits without a prior entry).
Entry conditions:
RSI crosses above the midline (default 50) while MACD is bullish (MACD > Signal, optionally MACD > 0), OR
MACD crosses above its Signal while RSI is at/above the midline.
Optional filters:
EMA trend filter: only enter if price > EMA(n).
Oversold context: only enter within N bars after RSI dipped below the oversold threshold.
Exit conditions:
RSI crosses below the midline, OR
MACD crosses below its Signal with MACD histogram ≤ 0.
Optional risk exit: Take Profit / Stop Loss based on percentage from average entry price.
Risk management:
Inputs: Use TP/SL (on/off), TP% (default 3.0), SL% (default 1.5).
Implements protective strategy.exit (limit/stop) while in position.
Signal-based exit uses strategy.close to flatten.
Position management:
Long-only, no pyramiding (single position at a time).
Internal state ensures entries occur only when flat and exits only when in a position.
Inputs you can tune:
RSI: length, overbought, oversold, midline.
MACD: fast length, slow length, signal length; toggle “Require MACD > 0”.
Signals: oversold lookback window; EMA trend on/off and EMA length.
Risk: TP% and SL%.
Visuals: show entry/exit markers, bar coloring; optional debug background on raw triggers.
Visuals and alerts:
Plots EMA (optional), draws entry/exit markers, optional bar coloring, and a faint background on raw long triggers to aid tuning.
Alert conditions provided for entries and exits.
Notes:
Designed for bar-close evaluation; performance varies by symbol/timeframe—tune inputs accordingly.
Long-only; intended for trend-following momentum with basic risk control.
Not financial advice.

Bullish Divergence SMI Base & Trigger with ATR FilterDescription:
A bullish divergence indicator combining the Stochastic Momentum Index (SMI) and Average True Range (ATR) to pinpoint high-probability entries:
1. Base Arrow (Orange ▲):
• Marks every SMI %K / %D bullish crossover where %K < –70 (deep oversold)—the first half of the divergence setup.
• Each new qualifying crossover replaces the previous base, continuously “arming” the divergence signal.
• Configurable SMI lookbacks, oversold threshold, and a base timeout (default 100 days) to clear stale bases.
2. Trigger Arrow (Green ▲):
• Completes the bullish divergence: fires on the next SMI bullish crossover where %K > –60 and price has dropped below the base arrow’s close by at least N × ATR (default 1 × 14-day ATR).
• A dashed green line links the base and trigger to visually confirm the divergence.
• Resets after triggering, ready for a new divergence cycle.
Inputs:
• SMI %K Length, EMA Smoothing, %D Length
• Oversold Base Level (–70), Trigger Level (–60)
• ATR Length (14), ATR Multiplier (1.0)
• Base Timeout (100 days)
Ideal for any market, this study highlights genuine bullish divergences—oversold momentum crossovers that coincide with significant price reactions—before entering long trades.

Mutanabby_AI | Algo Pro Strategy# Mutanabby_AI | Algo Pro Strategy: Advanced Candlestick Pattern Trading System
## Strategy Overview
The Mutanabby_AI Algo Pro Strategy represents a systematic approach to automated trading based on advanced candlestick pattern recognition and multi-layered technical filtering. This strategy transforms traditional engulfing pattern analysis into a comprehensive trading system with sophisticated risk management and flexible position sizing capabilities.
The strategy operates on a long-only basis, entering positions when bullish engulfing patterns meet specific technical criteria and exiting when bearish engulfing patterns indicate potential trend reversals. The system incorporates multiple confirmation layers to enhance signal reliability while providing comprehensive customization options for different trading approaches and risk management preferences.
## Core Algorithm Architecture
The strategy foundation relies on bullish and bearish engulfing candlestick pattern recognition enhanced through technical analysis filtering mechanisms. Entry signals require simultaneous satisfaction of four distinct criteria: confirmed bullish engulfing pattern formation, candle stability analysis indicating decisive price action, RSI momentum confirmation below specified thresholds, and price decline verification over adjustable lookback periods.
The candle stability index measures the ratio between candlestick body size and total range including wicks, ensuring only well-formed patterns with clear directional conviction generate trading signals. This filtering mechanism eliminates indecisive market conditions where pattern reliability diminishes significantly.
RSI integration provides momentum confirmation by requiring oversold conditions before entry signal generation, ensuring alignment between pattern formation and underlying momentum characteristics. The RSI threshold remains fully adjustable to accommodate different market conditions and volatility environments.
Price decline verification examines whether current prices have decreased over a specified period, confirming that bullish engulfing patterns occur after meaningful downward movement rather than during sideways consolidation phases. This requirement enhances the probability of successful reversal pattern completion.
## Advanced Position Management System
The strategy incorporates dual position sizing methodologies to accommodate different account sizes and risk management approaches. Percentage-based position sizing calculates trade quantities as equity percentages, enabling consistent risk exposure across varying account balances and market conditions. This approach proves particularly valuable for systematic trading approaches and portfolio management applications.
Fixed quantity sizing provides precise control over trade sizes independent of account equity fluctuations, offering predictable position management for specific trading strategies or when implementing precise risk allocation models. The system enables seamless switching between sizing methods through simple configuration adjustments.
Position quantity calculations integrate seamlessly with TradingView's strategy testing framework, ensuring accurate backtesting results and realistic performance evaluation across different market conditions and time periods. The implementation maintains consistency between historical testing and live trading applications.
## Comprehensive Risk Management Framework
The strategy features dual stop loss methodologies addressing different risk management philosophies and market analysis approaches. Entry price-based stop losses calculate stop levels as fixed percentages below entry prices, providing predictable risk exposure and consistent risk-reward ratio maintenance across all trades.
The percentage-based stop loss system enables precise risk control by limiting maximum loss per trade to predetermined levels regardless of market volatility or entry timing. This approach proves essential for systematic trading strategies requiring consistent risk parameters and capital preservation during adverse market conditions.
Lowest low-based stop losses identify recent price support levels by analyzing minimum prices over adjustable lookback periods, placing stops below these technical levels with additional buffer percentages. This methodology aligns stop placement with market structure rather than arbitrary percentage calculations, potentially improving stop loss effectiveness during normal market fluctuations.
The lookback period adjustment enables optimization for different timeframes and market characteristics, with shorter periods providing tighter stops for active trading and longer periods offering broader stops suitable for position trading approaches. Buffer percentage additions ensure stops remain below obvious support levels where other market participants might place similar orders.
## Visual Customization and Interface Design
The strategy provides comprehensive visual customization through eight predefined color schemes designed for different chart backgrounds and personal preferences. Color scheme options include Classic bright green and red combinations, Ocean themes featuring blue and orange contrasts, Sunset combinations using gold and crimson, and Neon schemes providing high visibility through bright color selections.
Professional color schemes such as Forest, Royal, and Fire themes offer sophisticated alternatives suitable for business presentations and professional trading environments. The Custom color scheme enables precise color selection through individual color picker controls, maintaining maximum flexibility for specific visual requirements.
Label styling options accommodate different chart analysis preferences through text bubble, triangle, and arrow display formats. Size adjustments range from tiny through huge settings, ensuring appropriate visual scaling across different screen resolutions and chart configurations. Text color customization maintains readability across various chart themes and background selections.
## Signal Quality Enhancement Features
The strategy incorporates signal filtering mechanisms designed to eliminate repetitive signal generation during choppy market conditions. The disable repeating signals option prevents consecutive identical signals until opposing conditions occur, reducing overtrading during consolidation phases and improving overall signal quality.
Signal confirmation requirements ensure all technical criteria align before trade execution, reducing false signal occurrence while maintaining reasonable trading frequency for active strategies. The multi-layered approach balances signal quality against opportunity frequency through adjustable parameter optimization.
Entry and exit visualization provides clear trade identification through customizable labels positioned at relevant price levels. Stop loss visualization displays active risk levels through colored line plots, ensuring complete transparency regarding current risk management parameters during live trading operations.
## Implementation Guidelines and Optimization
The strategy performs effectively across multiple timeframes with optimal results typically occurring on intermediate timeframes ranging from fifteen minutes through four hours. Higher timeframes provide more reliable pattern formation and reduced false signal occurrence, while lower timeframes increase trading frequency at the expense of some signal reliability.
Parameter optimization should focus on RSI threshold adjustments based on market volatility characteristics and candlestick pattern timeframe analysis. Higher RSI thresholds generate fewer but potentially higher quality signals, while lower thresholds increase signal frequency with corresponding reliability considerations.
Stop loss method selection depends on trading style preferences and market analysis philosophy. Entry price-based stops suit systematic approaches requiring consistent risk parameters, while lowest low-based stops align with technical analysis methodologies emphasizing market structure recognition.
## Performance Considerations and Risk Disclosure
The strategy operates exclusively on long positions, making it unsuitable for bear market conditions or extended downtrend periods. Users should consider market environment analysis and broader trend assessment before implementing the strategy during adverse market conditions.
Candlestick pattern reliability varies significantly across different market conditions, with higher reliability typically occurring during trending markets compared to ranging or volatile conditions. Strategy performance may deteriorate during periods of reduced pattern effectiveness or increased market noise.
Risk management through stop loss implementation remains essential for capital preservation during adverse market movements. The strategy does not guarantee profitable outcomes and requires proper position sizing and risk management to prevent significant capital loss during unfavorable trading periods.
## Technical Specifications
The strategy utilizes standard TradingView Pine Script functions ensuring compatibility across all supported instruments and timeframes. Default configuration employs 14-period RSI calculations, adjustable candle stability thresholds, and customizable price decline verification periods optimized for general market conditions.
Initial capital settings default to $10,000 with percentage-based equity allocation, though users can adjust these parameters based on account size and risk tolerance requirements. The strategy maintains detailed trade logs and performance metrics through TradingView's integrated backtesting framework.
Alert integration enables real-time notification of entry and exit signals, stop loss executions, and other significant trading events. The comprehensive alert system supports automated trading applications and manual trade management approaches through detailed signal information provision.
## Conclusion
The Mutanabby_AI Algo Pro Strategy provides a systematic framework for candlestick pattern trading with comprehensive risk management and position sizing flexibility. The strategy's strength lies in its multi-layered confirmation approach and sophisticated customization options, enabling adaptation to various trading styles and market conditions.
Successful implementation requires understanding of candlestick pattern analysis principles and appropriate parameter optimization for specific market characteristics. The strategy serves traders seeking automated execution of proven technical analysis techniques while maintaining comprehensive control over risk management and position sizing methodologies.

Energy Advanced Policy StrategyThis trading strategy emphasizes both technical trading as well as sentiment trading. Using news and government policy decisions, it can determine either positive or negative sentiment in the energy sector.
How the Strategy Works
This strategy has two main parts that work together to find good trades:
1. The "Policy & Sentiment Engine "
Policy Event Detection : The script spots potential big news or policy changes by looking for big, sudden price moves and huge trading volume. You can play with the Policy Event Volume Threshold and Policy Event Price Threshold (%) settings to make it more or less sensitive.
Sentiment Score : When the script finds a positive or negative event, it adds to a sentiment score. This score isn't forever, though; it fades over time, so the newest events matter the most.
Manual Override : The Manual News Sentiment setting lets you tell the script exactly what the market's mood is for a set time, which is perfect for when you already know about a big upcoming announcement.
The strategy only looks for a trade if the overall feeling is bullish enough. This makes sure you're trading with the big, fundamental forces of the market, not against them.
2. Technical Confirmation & Precision
After the policy and sentiment part gives a green light, the strategy uses a variety of technical indicators to confirm the trend and ideal entry positions.
Long-Term Trend : The script makes sure the market is in a strong uptrend by checking if the fast and medium-speed moving averages are going up, and if the price is above a long-term moving average.
Momentum : The MACD is used to make sure the price's upward momentum is getting stronger, not weaker.
Oscillator : It also uses the RSI to check if the market has gone up too much, too fast, which could mean it's about to turn around.
How to Use the Script
You can customize this strategy to fit your trading style and how much risk you're comfortable with. The inputs are grouped into logical sections for easy adjustment.
News & Policy Analysis : You can play with the Policy Event thresholds to make the script more or less sensitive to market shocks. And you can always use the Manual News Sentiment to take over when you're watching a specific news event.
Technical Analysis : Feel free to change the settings for things like the moving averages, RSI, and MACD to match what you like to trade and on what timeframe.

Mutanabby_AI | Ultimate Algo | Remastered+Overview
The Mutanabby_AI Ultimate Algo Remastered+ represents a sophisticated trend-following system that combines Supertrend analysis with multiple moving average confirmations. This comprehensive indicator is designed specifically for identifying high-probability trend continuation and reversal opportunities across various market conditions.
Core Algorithm Components
**Supertrend Foundation**: The primary signal generation relies on a customizable Supertrend indicator with adjustable sensitivity (1-20 range). This adaptive trend-following tool uses Average True Range calculations to establish dynamic support and resistance levels that respond to market volatility.
**SMA Confirmation Matrix**: Multiple Simple Moving Averages (SMA 4, 5, 9, 13) provide layered confirmation for signal strength. The algorithm distinguishes between regular signals and "Strong" signals based on SMA 4 vs SMA 5 relationship, offering traders different conviction levels for position sizing.
**Trend Ribbon Visualization**: SMA 21 and SMA 34 create a visual trend ribbon that changes color based on their relationship. Green ribbon indicates bullish momentum while red signals bearish conditions, providing immediate visual trend context.
**RSI-Based Candle Coloring**: Advanced 61-tier RSI system colors candles with gradient precision from deep red (RSI ≤20) through purple transitions to bright green (RSI ≥79). This visual enhancement helps traders instantly assess momentum strength and overbought/oversold conditions.
Signal Generation Logic
**Buy Signal Criteria**:
- Price crosses above Supertrend line
- Close price must be above SMA 9 (trend confirmation)
- Signal strength determined by SMA 4 vs SMA 5 relationship
- "Strong Buy" when SMA 4 ≥ SMA 5
- Regular "Buy" when SMA 4 < SMA 5
**Sell Signal Criteria**:
- Price crosses below Supertrend line
- Close price must be below SMA 9 (trend confirmation)
- Signal strength based on SMA relationship
- "Strong Sell" when SMA 4 ≤ SMA 5
- Regular "Sell" when SMA 4 > SMA 5
Advanced Risk Management System
**Automated TP/SL Calculation**: The indicator automatically calculates stop loss and take profit levels using ATR-based measurements. Risk percentage and ATR length are fully customizable, allowing traders to adapt to different market conditions and personal risk tolerance.
**Multiple Take Profit Targets**:
- 1:1 Risk-Reward ratio for conservative profit taking
- 2:1 Risk-Reward for balanced trade management
- 3:1 Risk-Reward for maximum profit potential
**Visual Risk Display**: All risk management levels appear as both labels and optional trend lines on the chart. Customizable line styles (solid, dashed, dotted) and positioning ensure clear visualization without chart clutter.
**Dynamic Level Updates**: Risk levels automatically recalculate with each new signal, maintaining current market relevance throughout position lifecycles.
Visual Enhancement Features
**Customizable Display Options**: Toggle trend ribbon, TP/SL levels, and risk lines independently. Decimal precision adjustments (1-8 decimal places) accommodate different instrument price formats and personal preferences.
**Professional Label System**: Clean, informative labels show entry points, stop losses, and take profit targets with precise price levels. Labels automatically position themselves for optimal chart readability.
**Color-Coded Momentum**: The gradient RSI candle coloring system provides instant visual feedback on momentum strength, helping traders assess market energy and potential reversal zones.
Implementation Strategy
**Timeframe Optimization**: The algorithm performs effectively across multiple timeframes, with higher timeframes (4H, Daily) providing more reliable signals for swing trading. Lower timeframes work well for day trading with appropriate risk adjustments.
**Sensitivity Adjustment**: Lower sensitivity values (1-5) generate fewer but higher-quality signals, ideal for conservative approaches. Higher sensitivity (15-20) increases signal frequency for active trading styles.
**Risk Management Integration**: Use the automated risk calculations as baseline parameters, adjusting risk percentage based on account size and market conditions. The 1:1, 2:1, 3:1 targets enable systematic profit-taking strategies.
Market Application
**Trend Following Excellence**: Primary strength lies in capturing significant trend movements through the Supertrend foundation with SMA confirmation. The dual-layer approach reduces false signals common in single-indicator systems.
**Momentum Assessment**: RSI-based candle coloring provides immediate momentum context, helping traders assess signal strength and potential continuation probability.
**Range Detection**: The trend ribbon helps identify ranging conditions when SMA 21 and SMA 34 converge, alerting traders to potential breakout opportunities.
Performance Optimization
**Signal Quality**: The requirement for both Supertrend crossover AND SMA 9 confirmation significantly improves signal reliability compared to basic trend-following approaches.
**Visual Clarity**: The comprehensive visual system enables rapid market assessment without complex calculations, ideal for traders managing multiple instruments.
**Adaptability**: Extensive customization options allow fine-tuning for specific markets, trading styles, and risk preferences while maintaining the core algorithm integrity.
## Non-Repainting Design
**Educational Note**: This indicator uses standard TradingView functions (Supertrend, SMA, RSI) with normal behavior patterns. Real-time updates on current candles are expected and standard across all technical indicators. Historical signals on closed candles remain fixed and unchanged, ensuring reliable backtesting and analysis.
**Signal Confirmation**: Final signals are confirmed only when candles close, following standard technical analysis principles. The algorithm provides clear distinction between developing signals and confirmed entries.
Technical Specifications
**Supertrend Parameters**: Default sensitivity of 4 with ATR length of 11 provides balanced signal generation. Sensitivity range from 1-20 allows adaptation to different market volatilities and trading preferences.
**Moving Average Configuration**: SMA periods of 8, 9, and 13 create multi-layered trend confirmation, while SMA 21 and 34 form the visual trend ribbon for broader market context.
**Risk Management**: ATR-based calculations with customizable risk percentage ensure dynamic adaptation to market volatility while maintaining consistent risk exposure principles.
Recommended Settings
**Conservative Approach**: Sensitivity 4-5, RSI length 14, higher timeframes (4H, Daily) for swing trading with maximum signal reliability.
**Active Trading**: Sensitivity 6-8, RSI length 8-10, intermediate timeframes (1H) for balanced signal frequency and quality.
**Scalping Setup**: Sensitivity 10-15, RSI length 5-8, lower timeframes (15-30min) with enhanced risk management protocols.
## Conclusion
The Mutanabby_AI Ultimate Algo Remastered+ combines proven trend-following principles with modern visual enhancements and comprehensive risk management. The algorithm's strength lies in its multi-layered confirmation approach and automated risk calculations, providing both novice and experienced traders with clear signals and systematic trade management.
Success with this system requires understanding the relationship between signal strength indicators and adapting sensitivity settings to match current market conditions. The comprehensive visual feedback system enables rapid decision-making while the automated risk management ensures consistent trade parameters.
Practice with different sensitivity settings and timeframes to optimize performance for your specific trading style and risk tolerance. The algorithm's systematic approach provides an excellent framework for disciplined trend-following strategies across various market environments.

Mutanabby_AI __ OSC+ST+SQZMOMMutanabby_AI OSC+ST+SQZMOM: Multi-Component Trading Analysis Tool
Overview
The Mutanabby_AI OSC+ST+SQZMOM indicator combines three proven technical analysis components into a unified trading system, providing comprehensive market analysis through integrated oscillator signals, trend identification, and volatility assessment.
Core Components
Wave Trend Oscillator (OSC): Identifies overbought and oversold market conditions using exponential moving average calculations. Key threshold levels include overbought zones at 60 and 53, with oversold areas marked at -60 and -53. Crossover signals between the two oscillator lines generate entry opportunities, displayed as colored circles on the chart for easy identification.
Supertrend Indicator (ST): Determines overall market direction using Average True Range calculations with a 2.5 factor and 10-period ATR configuration. Green lines indicate confirmed uptrends while red lines signal downtrend conditions. The indicator automatically adapts to market volatility changes, providing reliable trend identification across different market environments.
Squeeze Momentum (SQZMOM): Compares Bollinger Bands with Keltner Channels to identify consolidation periods and potential breakout scenarios. Black squares indicate squeeze conditions representing low volatility periods, green triangles signal confirmed upward breakouts, and red triangles mark downward breakout confirmations.
Signal Generation Logic
Long Entry Conditions:
Green triangles from Squeeze Momentum component
Supertrend line transitioning to green
Bullish crossovers in Wave Trend Oscillator from oversold territory
Short Entry Conditions:
Red triangles from Squeeze Momentum component
Supertrend line transitioning to red
Bearish crossovers in Wave Trend Oscillator from overbought territory
Automated Risk Management
The indicator incorporates comprehensive risk management through ATR-based calculations. Stop losses are automatically positioned at 3x ATR distance from entry points, while three progressive take profit targets are established at 1x, 2x, and 3x ATR multiples respectively. All risk management levels are clearly displayed on the chart using colored lines and informative labels.
When trend direction changes, the system automatically clears previous risk levels and generates new calculations, ensuring all risk parameters remain current and relevant to existing market conditions.
Alert and Notification System
Comprehensive alert framework includes trend change notifications with complete trade setup details, squeeze release alerts for breakout opportunity identification, and trend weakness warnings for active position management. Alert messages contain specific trading pair information, timeframe specifications, and all relevant entry and exit level data.
Implementation Guidelines
Timeframe Selection: Higher timeframes including 4-hour and daily charts provide the most reliable signals for position trading strategies. One-hour charts demonstrate good performance for day trading applications, while 15-30 minute timeframes enable scalping approaches with enhanced risk management requirements.
Risk Management Integration: Limit individual trade risk to 1-2% of total capital using the automatically calculated stop loss levels for precise position sizing. Implement systematic profit-taking at each target level while adjusting stop loss positions to protect accumulated gains.
Market Volatility Adaptation: The indicator's ATR-based calculations automatically adjust to changing market volatility conditions. During high volatility periods, risk management levels appropriately widen, while low volatility conditions result in tighter risk parameters.
Optimization Techniques
Combine indicator signals with fundamental support and resistance level analysis for enhanced signal validation. Monitor volume patterns to confirm breakout strength, particularly when Squeeze Momentum signals develop. Maintain awareness of scheduled economic events that may influence market behavior independent of technical indicator signals.
The multi-component design provides internal signal confirmation through multiple alignment requirements, significantly reducing false signal occurrence while maintaining reasonable trade frequency for active trading strategies.
Technical Specifications
The Wave Trend Oscillator utilizes customizable channel length (default 10) and average length (default 21) parameters for optimal market sensitivity. Supertrend calculations employ ATR period of 10 with factor multiplier of 2.5 for balanced signal quality. Squeeze Momentum analysis uses Bollinger Band length of 20 periods with 2.0 multiplication factor, combined with Keltner Channel length of 20 periods and 1.5 multiplication factor.
Conclusion
The Mutanabby_AI OSC+ST+SQZMOM indicator provides a systematic approach to technical market analysis through the integration of proven oscillator, trend, and momentum components. Success requires thorough understanding of each element's functionality and disciplined implementation of proper risk management principles.
Practice with demo trading accounts before live implementation to develop familiarity with signal interpretation and trade management procedures. The indicator's systematic approach effectively reduces emotional decision-making while providing clear, objective guidelines for trade entry, management, and exit strategies across various market conditions.

EMA Crossover Buy/Sell Signals (Mark804)FX:EURUSD
Indicator Overview — Buy/Sell Signal Arrows
The Buy/Sell Signal Arrows indicator visually enhances trading charts by clearly marking entry and exit opportunities via dynamic arrow overlays. Utilizing robust technical analysis techniques, this tool aims to streamline decision-making by highlighting potential buy signals and sell signals in real-time.
Key Features
Intuitive Visual Cues: Displays green arrows below the chart to denote buy signals and red arrows above for sell signals, ensuring rapid recognition.
Multiple Signal Algorithms: Supports various proven methods such as:
Moving Average Crossovers (e.g., short-term vs. long-term EMAs) — upward cross indicates buy; downward cross indicates sell
Relative Strength Index (RSI) thresholds — buy when oversold (RSI < 30), sell when overbought (RSI > 70)
MACD Signal Line Crossovers — buy when MACD crosses above its signal line, sell when it crosses below
Flexible Configuration: Customize periods, thresholds, and signal types, adapting the indicator to different assets and trading styles.
Benefits
Enhances Clarity: Simplifies complex data into actionable visual signals.
Signal Confirmation: Reduces ambiguity by combining momentum, trend, and volatility indicators.
Adaptable for Different Market Conditions: Effective in both trending and ranging environments by selecting appropriate algorithms.
Usage Guidelines & Best Practices
Combine with Complementary Tools: For improved accuracy, pair with support/resistance, volume analysis, or chart patterns
Conduct Thorough Back testing: Evaluate historical performance by measuring win rates, risk-to-reward ratios, and drawdowns
Hedge Fund Signals
.
Use as Part of a Broader Strategy: Indicators offer signals, not guarantees. Affirm trades with broader analysis and implement sound risk management (e.g., stop-loss, position sizing

Information Theory Market AnalysisINFORMATION THEORY MARKET ANALYSIS
OVERVIEW
This indicator applies mathematical concepts from information theory to analyze market behavior, measuring the randomness and predictability of price and volume movements through entropy calculations. Unlike traditional technical indicators, it provides insight into market structure and regime changes.
KEY COMPONENTS
Four Main Signals:
• Price Entropy (Deep Blue): Measures randomness in price movements
• Volume Entropy (Bright Blue): Analyzes volume pattern predictability
• Entropy MACD (Purple): Shows relationship between price and volume entropy
• SEMM (Royal Blue): Stochastic Entropy Market Monitor - overall market randomness gauge
Market State Detection:
The indicator identifies seven distinct market states:
• Strong Trending (SEMM < 0.1)
• Weak Trending (0.1-0.2)
• Neutral (0.2-0.3)
• Moderate Random (0.3-0.5)
• High Randomness (0.5-0.8)
• Very Random (0.8-1.0)
• Chaotic (>1.0)
KEY FEATURES
Advanced Analytics:
• Signal Strength Confluence: 0-5 scale measuring alignment of multiple factors
• Entropy Crossovers: Detects shifts between accumulation and distribution phases
• Extreme Readings: Identifies statistical outliers for potential reversals
• Trend Bias Analysis: Directional momentum assessment
Information Dashboard:
• Real-time entropy values and market state
• Signal strength indicator with visual highlighting
• Trend bias with directional arrows
• Color-coded alerts for extreme conditions
Customizable Display:
• Adjustable SEMM scaling (5x to 100x) for optimal visibility
• Multiple line styles: Smooth, Stepped, Dotted
• 9 table positions with 3 size options
• Professional blue color scheme with transparency controls
Comprehensive Alert System - 15 Alert Types Including:
• Extreme entropy readings (price/volume)
• Crossover signals (dominance shifts)
• Market state changes (trending ↔ random)
• High confluence signals (3+ factors aligned)
HOW TO USE
Reading the Signals:
• Entropy Values > ±25: Strong structural signals
• Entropy Values > ±40: Extreme readings, potential reversals
• SEMM < 0.2: Trending market favors directional strategies
• SEMM > 0.5: Random market favors range/scalping strategies
Signal Confluence:
Look for multiple factors aligning:
• Signal Strength ≥ 3.0 for higher probability setups
• Background highlighting indicates confluence
• Table shows real-time strength assessment
Timeframe Optimization:
• Short-term (1m-15m): Entropy Length 14-22, Sensitivity 3-5
• Swing Trading (1H-4H): Default settings optimal
• Position Trading (Daily+): Entropy Length 34-55, Sensitivity 8-12
EDUCATIONAL APPLICATIONS
Market Structure Analysis:
• Understand when markets are trending vs. ranging
• Identify accumulation and distribution phases
• Recognize extreme market conditions
• Measure information content in price movements
Information Theory Concepts:
• Binary entropy calculations applied to financial data
• Probability distribution analysis of returns
• Statistical ranking and percentile analysis
• Momentum-adjusted randomness measurement
TECHNICAL DETAILS
Calculations:
• Uses binary entropy formula: -
• Percentile ranking across multiple timeframes
• Volume-weighted probability distributions
• RSI-adjusted momentum entropy (SEMM)
Customization Options:
• Entropy Length: 5-100 bars (default: 22)
• Average Length: 10-200 bars (default: 88)
• Sensitivity: 1.0-20.0 (default: 5.0, lower = more sensitive)
• SEMM Scaling: 5.0-100.0x (default: 30.0)
IMPORTANT NOTES
Risk Considerations:
• Indicator measures probabilities, not certainties
• High SEMM values (>0.5) suggest increased market randomness
• Extreme readings may persist longer than expected
• Always combine with proper risk management
Educational Purpose:
This indicator is designed for:
• Market structure analysis and education
• Understanding information theory applications in finance
• Developing probabilistic thinking about markets
• Research and analytical purposes
Performance Tips:
• Allow 200+ bars for proper initialization
• Adjust scaling and transparency for optimal visibility
• Use confluence signals for higher probability analysis
• Consider multiple timeframes for comprehensive analysis
DISCLAIMER
This indicator is for educational and analytical purposes. It does not constitute financial advice. Past performance does not guarantee future results. Always conduct your own research and consider your risk tolerance before making trading decisions.
Version: 5.0
Category: Oscillators, Volume, Market Structure
Best For: All timeframes, trending and ranging markets
Complexity: Intermediate to Advanced

Stochastic RSI With Cross SignalA simple Stochastic RSI with crossover signals.
It plots a green arrow (↑) when %K crosses above %D, and a red arrow (↓) when %K crosses below %D.
That’s all it does. Simple. Enjoy.
Peace .

[Stratégia] VWAP Mean Magnet v9 (Simple Alert)This strategy is specifically designed for a ranging (sideways-moving) Bitcoin market.
A trade is only opened and signaled on the chart if all three of the following conditions are met simultaneously at the close of a candle:
Zone Entry
The price must cross into the signal zone: the red band for a Short (sell) position, or the green band for a Long (buy) position.
RSI Confirmation
The RSI indicator must also confirm the signal. For a Short, it must go above 65 (overbought condition). For a Long, it must fall below 25 (oversold condition).
Volume Filter
The volume on the entry candle cannot be excessively high. This safety filter is designed to prevent trades during risky, high-momentum breakouts.

RS Ratio vs Benchmark (Colored)📈 RS Ratio vs Benchmark (with Color Change)
A simple but powerful tool to track relative strength against a benchmark like QQQ, SPY, or any other ETF.
🔍 What it Shows
RS Ratio (orange line): Measures how strong a stock is relative to a benchmark.
Moving Average (teal line): Smooths out RS to show trend direction.
Color-coded RS Line:
🟢 Green = RS is above its moving average → strength is increasing.
🔴 Red = RS is below its moving average → strength is fading.
📊 How to Read It
Above 100 = Stock is outperforming the benchmark.
Below 100 = Underperforming.
Rising & Green = Strongest signal — accelerating outperformance.
Above 100 but Red = Consolidating or losing momentum — potential rest period.
Crosses below 100 = Warning sign — underperformance.
✅ Best Uses
Spot leading stocks with strong momentum vs QQQ/SPY.
Identify rotation — when strength shifts between sectors.
Time entries and exits based on RS trends and crossovers.

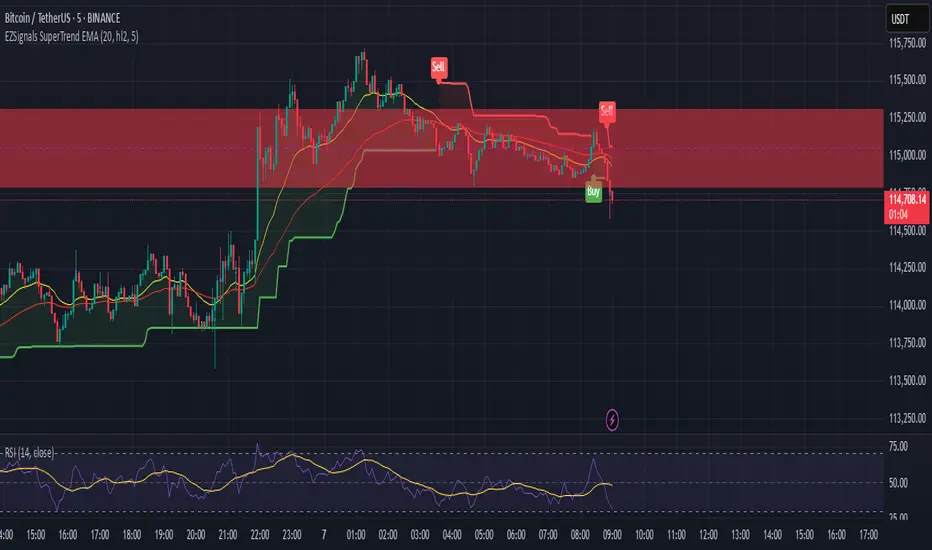
EZSignals SuperTrend EMAA technical indicator, even with high accuracy, must be rigorously backtested to assess its stability across various market conditions. Its effectiveness depends not only on the algorithm itself but also on how it is integrated into the overall trading system. Proper usage, combined with risk management and a solid understanding of market context, is essential to convert theoretical accuracy into practical trading advantage.

EZSignals SuperTrend EMAA technical indicator, even with high accuracy, must be rigorously backtested to assess its stability across various market conditions. Its effectiveness depends not only on the algorithm itself but also on how it is integrated into the overall trading system. Proper usage, combined with risk management and a solid understanding of market context, is essential to convert theoretical accuracy into practical trading advantage.