Mara JPY Strength (USDJPY+EURJPY+GBPJPY)/3 + DXYJPY, USDJPY, EURJPY, GBPJPY, smart money, bias, index, forex indicator, DXY, strength meter, professional, trading tool, price action
Indicators and strategies

Mara JPY Bias ProMara JPY Bias Pro™ is a precision tool built for serious traders who focus on JPY and USD pairs.
This synthetic index combines USDJPY + EURJPY + GBPJPY, generating a smooth and dynamic representation of JPY strength or weakness. When the line turns green, JPY is weakening — time to look for LONG setups on XXX/JPY pairs. When red, JPY is strengthening — ideal moment for SHORT trades.
Built-in bias logic with adjustable MA-based trend detection or slope/momentum view lets you customize signals based on your strategy.
Plus, we’ve included a normalized DXY overlay, so you can track USD strength in parallel — perfect for traders working with EUR/USD, GBP/USD, USD/JPY and JPY crosses.
💡 Designed for day traders, scalpers, and smart money traders looking for clean confluence.
✅ Features:
Visual color-coded JPY bias (Green = Long / Red = Short)
Optional USD (DXY) strength overlay
Customizable MA length and bias logic
Built-in alerts for bias shifts & momentum flips
🔔 Alert-ready – never miss a reversal.
Trade smarter. Cut the noise. Stay on the right side of the move.

Global M2 Money Supply // Days Offset =This is the original version.. there is no update... just needed to re-install the script.

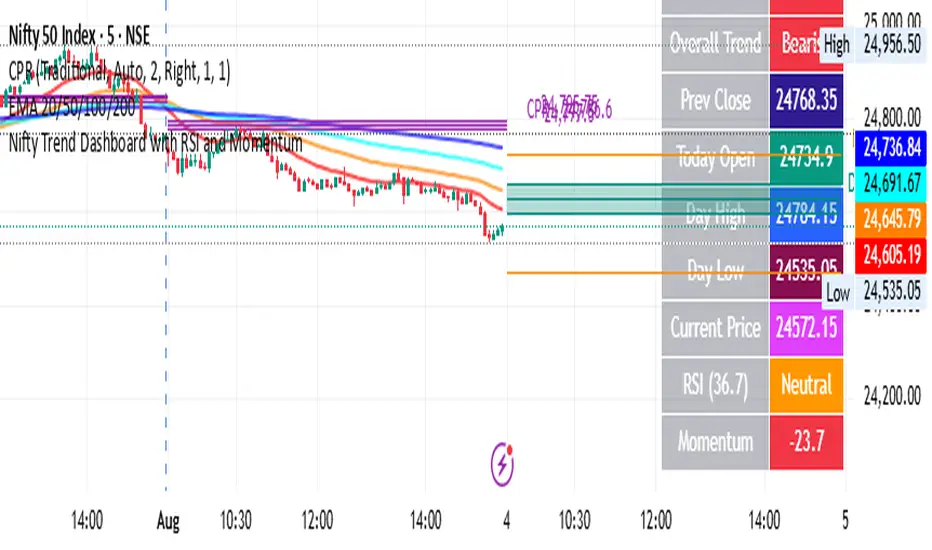
Nifty Trend Dashboard with RSIthis is for learning purpose only. it will show current trend and overall trend
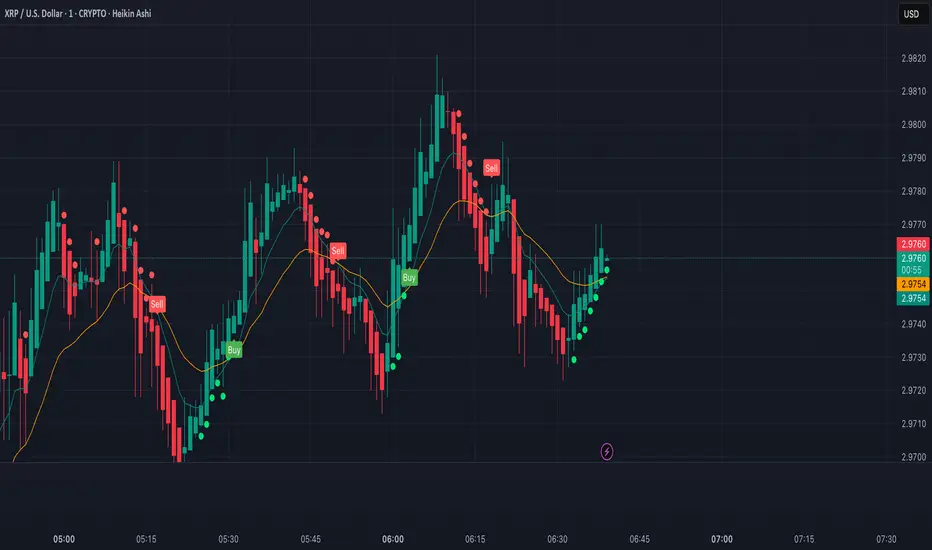
XRP Scalping with EMA Crossover Anticipation This script is designed to detect scalping opportunities on XRP by anticipating EMA crossovers, reinforced with technical confirmation filters.
Methodology
- The core signal is based on the crossover between a fast EMA (9) and a slow EMA (21).
- RSI (14) conditions are applied to avoid weak setups: RSI must be above 40 for buy signals and below 70 for sell signals.
- Before any crossover is validated, the script requires at least two consecutive “pre-crossover” signals. These indicate favorable momentum and convergence conditions before the crossover occurs.
- Final signals are only displayed if this minimum number of preconditions is met.
Application
This system is optimized for scalping on the 1-minute to 5-minute timeframes but can be adapted for longer-term setups by adjusting parameters. The anticipation logic helps reduce lagging entries and improves signal selectivity during volatile conditions.
Both pre-crossover and confirmed crossover conditions include alert options. The code is fully editable and customizable.
Dual Supertrend tohungmc tikDual Supertrend is an advanced trend-following indicator that combines two Supertrend strategies — a Large Supertrend and a Small Supertrend — to provide you with more precise entry and exit signals.
This indicator plots two Supertrend lines:
Large Supertrend (Blue and Orange): A broader trend that reacts slower to price movements.
Small Supertrend (Green and Red): A faster trend that responds quicker to market changes.
Key Features:
Customizable ATR Periods and Multipliers for both Large and Small Supertrends.
Buy/Sell Signals: When the Small Supertrend trend changes, and it's aligned with the Large Supertrend, you get reliable buy and sell signals.
Highlighting: The background can be highlighted in green or red, depending on whether the Large Supertrend is in an uptrend or downtrend.
Alerts: Alerts can be set for buy/sell signals or when the trend direction changes.
Use Case:
This indicator is designed for traders looking to follow both long-term and short-term trends. By combining the slower Large Supertrend with the faster Small Supertrend, it gives a more comprehensive view of market trends and better entry/exit points.
Indicator Inputs:
ATR Periods and Multipliers: Control how sensitive the Supertrend reacts to market changes.
Highlighting: Enable/Disable background highlighting.
Buy/Sell Signals: Option to show buy/sell signals based on trend direction changes.

RSI & MFI Candle Color tohungmc tikRSI & MFI Candle Color with Alerts is a visual momentum indicator that highlights overbought and oversold conditions directly on your chart using candle colors.
This script combines the Relative Strength Index (RSI) and the Money Flow Index (MFI) with flexible settings, allowing you to:
✅ Display candle color based on RSI
✅ Display candle color based on MFI
✅ Show only candles where both RSI and MFI agree (for stronger signals)
✅ Customize overbought and oversold thresholds
✅ Receive real-time alerts when conditions are met at candle close
Color Logic:
White candles = Overbought (above threshold)
Blue candles = Oversold (below threshold)
Use case:
This tool is useful for traders who want quick, visual confirmation of momentum extremes, and who may combine RSI and MFI for higher accuracy.
Tip: Use with hidden candles (turn off price candles) or overlay it on price action for enhanced visibility.

Triple MA Buy & Sell SignalsTriple MA Buy & Sell Signals Indicator
This indicator is designed to help traders identify high-probability entry points based on the combination of three moving averages (8, 50, and 200) while filtering signals in the direction of the main trend.
How It Works
Trend Filter (200 MA)
If the price is above the 200 MA, only BUY signals are displayed.
If the price is below the 200 MA, only SELL signals are displayed.
8 MA and 50 MA Cross (Regular Signals)
BUY (Green): When the 8 MA crosses above the 50 MA, and the price is above the 200 MA.
SELL (Red): When the 8 MA crosses below the 50 MA, and the price is below the 200 MA.
8 MA and 200 MA Cross (Major Trend Signals)
BUY (Yellow): When the 8 MA crosses above the 200 MA.
SELL (Yellow): When the 8 MA crosses below the 200 MA.
Purpose
This indicator is particularly useful for traders who follow Smart Money Concepts (SMC) or ICT-based strategies, as it helps:
Identify trend direction with the 200 MA.
Spot short-term trade entries using the 8/50 MA cross.
Highlight major trend reversals using the 8/200 MA cross.

EMA 10/20/60/120// This script plots four Exponential Moving Averages (10, 20, 60, 120)
// for trend-following analysis. Crossovers and the order of the EMAs can
// help identify the strength and direction of the trend.

✅ BACKTEST: UT Bot + RSIRSI levels widened (60/40) — more signals.
Removed ATR volatility filter (to let trades fire).
Added inputs for TP and SL using ATR — fully dynamic.
Cleaned up conditions to ensure alignment with market structure.

Lucas Scalia Maximums and minimums of the day, week, and month. Basically, it automatically marks and labels the highs and lows of the previous daily , weekly, and monthly candles. The labels can be added or removed at your discretion, leaving only the dotted lines.

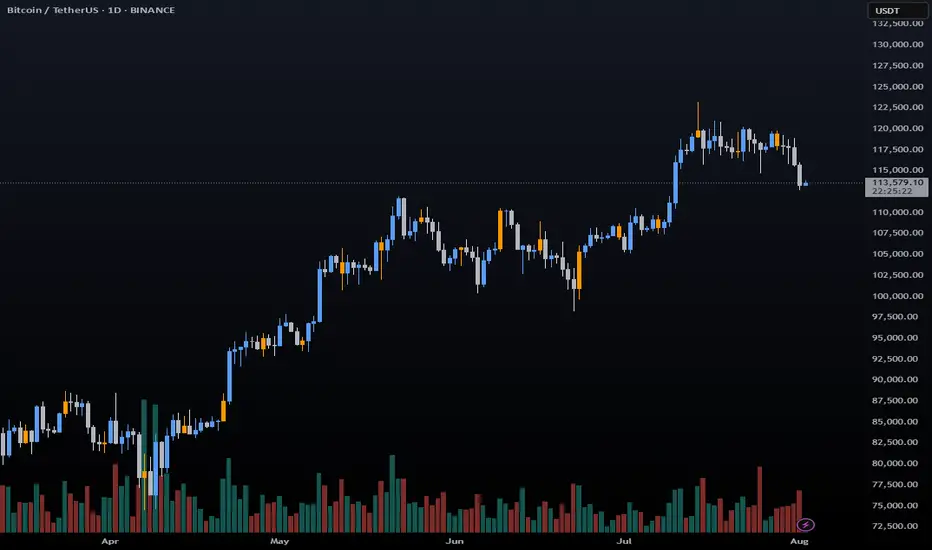
BTC 1m Chop Top/Bottom Reversal (Stable Entries)Strategy Description: BTC 5m Chop Top/Bottom Reversal (Stable Entries)
This strategy is engineered to capture precise reversal points during Bitcoin’s choppy or sideways price action on the 5-minute timeframe. It identifies short-term tops and bottoms using a confluence of volatility bands, momentum indicators, and price structure, optimized for high-probability scalping and intraday reversals.
Core Logic:
Volatility Filter: Uses an EMA with ATR bands to define overextended price zones.
Momentum Divergence: Confirms reversals using RSI and MACD histogram shifts.
Price Action Filter: Requires candle confirmation in the direction of the trade.
Locked Signal Logic: Prevents repaints and disappearing trades by confirming signals only once per bar.
Trade Parameters:
Short Entry: Above upper band + overbought RSI + weakening MACD + bearish candle
Long Entry: Below lower band + oversold RSI + strengthening MACD + bullish candle
Take Profit: ±0.75%
Stop Loss: ±0.4%
This setup is tuned for traders using tight risk control and leverage, where execution precision and minimal drawdown tolerance are critical.


Custom Candle Colors by Day (Full Week)Highlight specific daily candles a different color (Monday - Sunday)

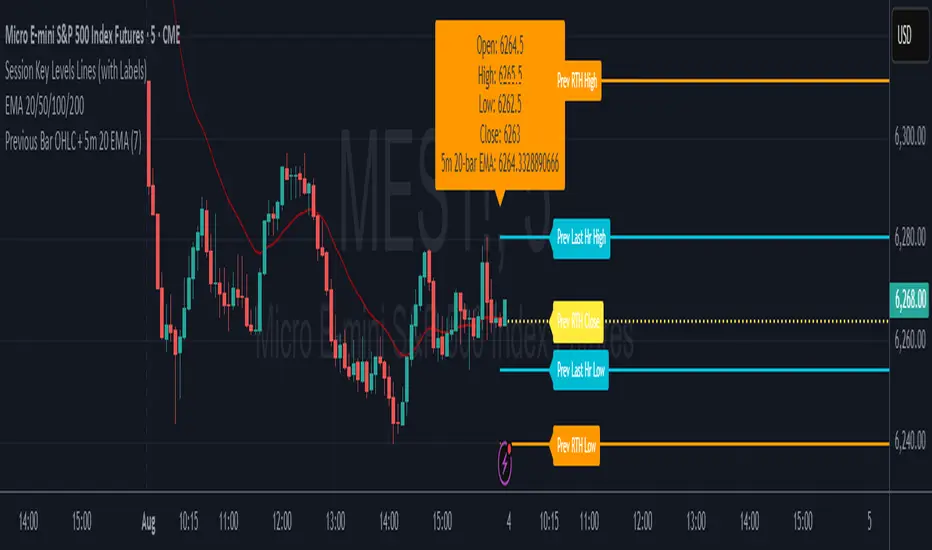
7* Previous Bar OHLC + 5m 20 EMAincreased label height for 7* Previous Bar OHLC + 5m 20 EMA. hope it helps :)
Ratio-Adjusted McClellan Summation Index RASI NASIRatio-Adjusted McClellan Summation Index (RASI NASI)
In Book "The Complete Guide to Market Breadth Indicators" Author Gregory L. Morris states
"It is the author’s opinion that the McClellan indicators, and in particular, the McClellan Summation Index, is the single best breadth indicator available. If you had to pick just one, this would be it."
What It Does: The Ratio-Adjusted McClellan Summation Index (RASI) is a market breadth indicator that tracks the cumulative strength of advancing versus declining issues for a user-selected exchange (NASDAQ, NYSE, or AMEX). Derived from the McClellan Oscillator, it calculates ratio-adjusted net advances, applies 19-day and 39-day EMAs, and sums the oscillator values to produce the RASI. This indicator helps traders assess market health, identify bullish or bearish trends, and detect potential reversals through divergences.
Key features:
Exchange Selection : Choose NASDAQ (USI:ADVN.NQ, USI:DECL.NQ), NYSE (USI:ADVN.NY, USI:DECL.NY), or AMEX (USI:ADVN.AM, USI:DECL.AM) data.
Trend-Based Coloring : RASI line displays user-defined colors (default: black for uptrend, red for downtrend) based on its direction.
Customizable Moving Average: Add a moving average (SMA, EMA, WMA, VWMA, or RMA) with user-defined length and color (default: EMA, 21, green).
Neutral Line at Zero: Marks the neutral level for trend interpretation.
Alerts: Six custom alert conditions for trend changes, MA crosses, and zero-line crosses.
How to Use
Add to Chart: Apply the indicator to any TradingView chart. Ensure access to advancing and declining issues data for the selected exchange.
Select Exchange: Choose NASDAQ, NYSE, or AMEX in the input settings.
Customize Settings: Adjust EMA lengths, RASI colors, MA type, length, and color to match your trading style.
Interpret the Indicator :
RASI Line: Black (default) indicates an uptrend (RASI rising); red indicates a downtrend (RASI falling).
Above Zero: Suggests bullish market breadth (more advancing issues).
Below Zero : Indicates bearish breadth (more declining issues).
MA Crosses: RASI crossing above its MA signals bullish momentum; crossing below signals bearish momentum.
Divergences: Compare RASI with the market index (e.g., NASDAQ Composite) to identify potential reversals.
Large Moves : A +3,600-point move from a low (e.g., -1,550 to +1,950) may signal a significant bull run.
Set Alerts:
Add the indicator to your chart, open the TradingView alert panel, and select from six conditions (see Alerts section).
Configure notifications (e.g., email, webhook, or popup) for each condition.
Settings
Market Selection:
Exchange: Select NASDAQ, NYSE, or AMEX for advancing/declining issues data.
EMA Settings:
19-day EMA Length: Period for the shorter EMA (default: 19).
39-day EMA Length: Period for the longer EMA (default: 39).
RASI Settings:
RASI Uptrend Color: Color for rising RASI (default: black).
RASI Downtrend Color: Color for falling RASI (default: red).
RASI MA Settings:
MA Type: Choose SMA, EMA, WMA, VWMA, or RMA (default: EMA).
MA Length: Set the MA period (default: 21).
MA Color: Color for the MA line (default: green).
Alerts
The indicator uses alertcondition() to create custom alerts. Available conditions:
RASI Trend Up: RASI starts rising (based on RASI > previous RASI, shown as black line).
RASI Trend Down: RASI starts falling (based on RASI ≤ previous RASI, shown as red line).
RASI Above MA: RASI crosses above its moving average.
RASI Below MA: RASI crosses below its moving average.
RASI Bullish: RASI crosses above zero (bullish market breadth).
RASI Bearish: RASI crosses below zero (bearish market breadth).
To set alerts, add the indicator to your chart, open the TradingView alert panel, and select the desired condition.
Notes
Data Requirements: Requires access to advancing/declining issues data (e.g., USI:ADVN.NQ, USI:DECL.NQ for NASDAQ). Some symbols may require a TradingView premium subscription.
Limitations: RASI is a medium- to long-term indicator and may lag in volatile or range-bound markets. Use alongside other technical tools for confirmation.
Data Reliability : Verify the selected exchange’s data accuracy, as inconsistencies can affect results.
Debugging: If no data appears, check symbol validity (e.g., try $ADVN/Q, $DECN/Q for NASDAQ) or contact TradingView support.
Credits
Based on the Ratio-Adjusted McClellan Summation Index methodology by McClellan Financial Publications. No external code was used; the implementation is original, inspired by standard market breadth concepts.
Disclaimer
This indicator is for informational purposes only and does not constitute financial advice. Past performance is not indicative of future results. Conduct your own research and combine with other tools for informed trading decisions.

Moving Average RibbonMoving Averages creating a what I call internally a "ribbon". Rename as see fit.


PSAR LRC [CRT Trader]
SAR (Stop and Reverse) is a technical indicator used in financial markets to track trends and identify potential reversal points.
The indicator plots SAR calculations at three different speeds as dot markers above or below the candlesticks. If all three dots are below, it is considered a bullish signal; if they are above, it is considered a bearish signal.
In addition to the indicator, a Linear Regression Channel has been added. These lines can provide information such as trend direction, support, resistance, and potential breakouts.

ATR Squeeze BackgroundThis simple but powerful indicator shades the background of your chart whenever volatility contracts, based on a custom comparison of fast and slow ATR (Average True Range) periods.
By visualizing low-volatility zones, you can:
* Identify moments of compression that may precede explosive price moves
* Stay out of choppy, low-momentum periods
* Adapt this as a component in a broader volatility or breakout strategy
🔧 How It Works
* A Fast ATR (default: 7 periods) and a Slow ATR (default: 40 periods) are calculated
* When the Fast ATR is lower than the Slow ATR, the background is shaded in blue
* This shading signals a contraction in volatility — a condition often seen before breakouts or strong directional moves
⚡️ Why This Matters
Many experienced traders pay close attention to volatility cycles. This background indicator helps visualize those cycles at a glance. It's minimal, non-intrusive, and easy to combine with your existing tools.
🙏 Credits
This script borrows core logic from the excellent “Relative Volume at Time” script by TradingView. Credit is given with appreciation.
⚠️ Disclaimer
This script is for educational purposes only.
It does not constitute financial advice, and past performance is not indicative of future results. Always do your own research and test strategies before making trading decisions.

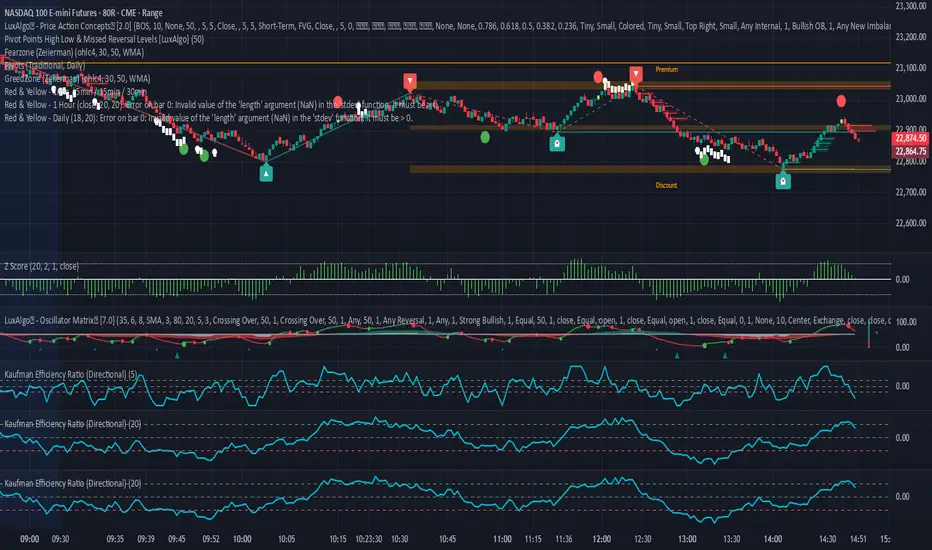
Kaufman Efficiency Ratio (Directional)Kaufman Indicator with negative and positive, i use 30 and negative 30 as trend indicators, some can use it as counter trend...a lot of other kaufman efficiency indicators are only at the positive level so even a short trend has a positive 30 value can be confusing.
Buy & Sell Signals - EMA + MACDBuy & Sell Signals - EMA + MACD is clean and practical Pine Script for buy and sell signals using a popular combination of EMA crossover and MACD confirmation, designed for stocks, crypto, or forex swing/intraday trading.
