Smart Price Divergence (MACD Filter) + EMA📌 Purpose
This indicator detects Price Divergences with MACD filtered by a 200 EMA trend condition.
It helps identify high-probability reversal zones aligned with market trend context.
🧠 How It Works
1. MACD Divergence Logic
Bearish Divergence:
Price makes a higher high.
MACD makes a lower high.
Price is above EMA (indicating possible exhaustion in bullish trend).
Bullish Divergence:
Price makes a lower low.
MACD makes a higher low.
Price is below EMA (indicating possible exhaustion in bearish trend).
2. EMA Trend Filter
EMA(200) is used as a directional filter:
Bearish divergences considered above EMA (extended bullish conditions).
Bullish divergences considered below EMA (extended bearish conditions).
3. Visual & Alerts
EMA(200) plotted on chart in orange.
Red triangles for Bearish Divergence.
Green triangles for Bullish Divergence.
Alerts fire for both divergence types.
📈 How to Use
Look for divergence signals as potential reversal alerts.
Combine with support/resistance or price action for confirmation.
EMA ensures signals occur in extended zones, increasing reliability.
Recommended Timeframes: 1h, 4h, D.
Markets: Forex, Crypto, Stocks.
⚙️ Inputs
MACD Fast / Slow / Signal Length
EMA Length (default 200)
⚠️ Disclaimer
This script is for educational purposes only. It does not constitute financial advice.
Always test thoroughly before live trading.
Indicators and strategies

Smart Deviation Trend Bands PRO + MTF Filter📌 Purpose
This indicator combines multi-level Deviation Bands (±1, ±2, ±3 standard deviations from SMA) with a Higher Timeframe (HTF) Trend Filter.
It helps traders identify potential bounce and breakout setups aligned with the dominant market trend.
🧠 How It Works
1. Deviation Bands
SMA(Length) is calculated as the centerline.
Standard deviations (±1, ±2, ±3) define multiple dynamic support and resistance zones.
Outer bands (±3) often mark overextended zones; inner bands (±1, ±2) show active trading areas.
2. HTF Trend Filter
A higher timeframe SMA (HTF SMA) acts as a trend confirmation tool.
Default filter timeframe: 1 Day.
Trend Up: Price > HTF SMA
Trend Down: Price < HTF SMA
3. Entry Signals
Long Signal: Price crosses above lower deviation band (+1) when HTF trend is UP.
Short Signal: Price crosses below upper deviation band (−1) when HTF trend is DOWN.
4. Visuals & Alerts
Bands plotted in red (upper) and green (lower).
Centerline = SMA in blue.
HTF SMA in orange.
Circles on chart mark entry points; alerts trigger automatically.
📈 How to Use
In trending markets: Trade with the HTF direction, using band touches for entries.
In mean-reversion setups: Outer bands can be used to spot potential overbought/oversold zones.
Combine with volume or price action for confirmation.
Recommended Timeframes: 1h, 4h, D.
Markets: Forex, Crypto, Stocks.
⚙️ Inputs
SMA Length
StdDev Multiplier 1 / 2 / 3
HTF Timeframe (default: D1)
⚠️ Disclaimer
This script is for educational purposes only. It does not constitute financial advice.
Always test thoroughly before live trading.

Smart Volatility Squeeze + Trend Filter📌 Purpose
This indicator detects volatility squeeze conditions when Bollinger Bands contract inside Keltner Channels and signals potential breakout opportunities.
It also includes an optional EMA-based trend filter to align signals with the dominant market direction.
🧠 How It Works
1. Squeeze Condition
Bollinger Bands (BB): Length = 20, StdDev = 2.0 (default)
Keltner Channels (KC): EMA Length = 20, ATR Multiplier = 1.5 (default)
Squeeze ON: Occurs when BB Upper < KC Upper and BB Lower > KC Lower (low volatility zone).
2. Breakout Signals
Long Breakout: Price crosses above BB Upper after squeeze.
Short Breakout: Price crosses below BB Lower after squeeze.
3. Trend Filter (optional)
EMA(50) used to confirm breakout direction:
Long signals allowed only if price > EMA(50)
Short signals allowed only if price < EMA(50)
Toggle Use Trend Filter to enable/disable.
4. Visual & Alerts
Green circle at chart bottom indicates Squeeze ON.
Green/Red triangles mark breakouts.
Background gradually brightens during squeeze buildup.
Alerts available for long and short breakouts.
📈 How to Use
Look for Squeeze ON → then wait for breakout arrows.
Trade in breakout direction, preferably with trend filter ON.
Works best on higher timeframes (1h, 4h, D) and trending markets.
Markets: Crypto, Forex, Stocks — effective in volatile assets.
⚙️ Inputs
BB Length / StdDev
KC EMA Length / ATR Multiplier
Use Trend Filter
Trend EMA Length
⚠️ Disclaimer
This script is for educational purposes only. It does not constitute financial advice.
Always test thoroughly before live trading.

Smart RSI Divergence PRO | Auto Lines + Alerts📌 Purpose
This indicator automatically detects Regular and Hidden RSI Divergences between price action and the RSI oscillator.
It plots divergence lines directly on the chart, labels signals, and includes alerts for automated monitoring.
🧠 How It Works
1. RSI Calculation
RSI is calculated using the selected Source (default: Close) and RSI Length (default: 14).
2. Divergence Detection via Fractals
Swing points on both price and RSI are detected using fractal logic (5-bar patterns).
Regular Divergence:
Bearish: Price forms a higher high, RSI forms a lower high.
Bullish: Price forms a lower low, RSI forms a higher low.
Hidden Divergence:
Bearish: Price forms a lower high, RSI forms a higher high.
Bullish: Price forms a higher low, RSI forms a lower low.
3. Auto Drawing Lines
Lines are drawn automatically between divergence points:
Red = Regular Bearish
Green = Regular Bullish
Orange = Hidden Bearish
Blue = Hidden Bullish
Line width and transparency are adjustable.
4. Labels and Alerts
Labels mark divergence points with up/down arrows.
Alerts trigger for each divergence type.
📈 How to Use
Use Regular Divergences to anticipate trend reversals.
Use Hidden Divergences to confirm trend continuation.
Combine with support/resistance, trendlines, or volume for higher probability setups.
Recommended Timeframes: Works on all timeframes; more reliable on 1h, 4h, and Daily.
Markets: Forex, Crypto, Stocks.
⚙️ Inputs
Source (Close, HL2, etc.)
RSI Length
Toggle Regular / Hidden Divergence visibility
Toggle Lines / Labels
Line Width & Line Transparency
⚠️ Disclaimer
This script is for educational purposes only. It does not constitute financial advice.
Always test thoroughly before using in live trading.

Buy Sell Magic Rework📌 Purpose
This script is a reworked version of the Parabolic SAR strategy, with an optional ZigZag filter to confirm reversal points.
It helps traders identify potential trend reversals with reduced noise compared to the standard SAR.
🧠 How It Works
1. Parabolic SAR Flip Signals
Buy Signal: Triggered when SAR flips from above price to below price.
Sell Signal: Triggered when SAR flips from below price to above price.
(Default SAR parameters: Start = 0.02, Increment = 0.02, Max = 0.2)
2. ZigZag Filter (Optional)
When Use ZigZag Filter = true:
The script confirms reversals only at significant pivots (swing highs/lows) detected by the ZigZag algorithm over the selected ZigZag Period (default = 14 bars).
Buy Signal: Appears only when a new pivot low is detected.
Sell Signal: Appears only when a new pivot high is detected.
3. Trade-Off
Without ZigZag: More signals, more noise.
With ZigZag: Fewer signals, but stronger confirmation and reduced false entries.
📈 How to Use
Signals appear as green arrows for buy and red arrows for sell.
Works well for:
Trend reversal detection.
Swing trading confirmation.
Filtering entries for other systems.
Recommended Timeframes: 15m, 1h, 4h.
Markets: Forex, Crypto, Stocks.
⚙️ Inputs
ZigZag Period (bars for pivot detection)
SAR Start / Increment / Max (SAR parameters)
Use ZigZag Filter (toggle for confirmation)
⚠️ Disclaimer
This script is for educational purposes only. It does not constitute financial advice.
Always test thoroughly before live trading.

Smart Impulse Exhaustion Finder (ATR + ADX Filter)📌 Purpose
This indicator detects potential exhaustion of strong bullish or bearish impulses at fresh swing highs/lows by combining multiple price action and volatility-based filters.
🧠 How It Works
A signal is triggered only when all core conditions are satisfied:
1. Swing High/Low Detection
Current high (or low) must be the highest (or lowest) over the last Extremum Lookback bars (default: 50).
This ensures the move is significant relative to recent price action.
2. Impulse Confirmation
Price must extend by at least 1 × ATR from the previous swing point.
This filters out minor fluctuations.
3. Exhaustion Conditions (at least 2 out of 3 must be met)
RSI Extreme: RSI > Overbought Level (default: 80) for bearish signals, RSI < Oversold Level (default: 20) for bullish signals.
Volume Spike: Volume > SMA(Volume, Volume SMA Length) × Volume Spike Multiplier.
Candle Wick Rejection: Upper wick ≥ Wick Threshold % for bearish setups, Lower wick ≥ Wick Threshold % for bullish setups.
4. Trend Filter
ADX > ADX Threshold ensures the market is trending and filters out sideways conditions.
5. Candle Body Filter
Candle body must be ≥ Body Size ATR Factor × ATR.
This avoids weak signals from small candles or doji formations.
📈 How to Use
Bearish Signal:
Appears at fresh swing highs with exhaustion conditions met. Useful for tightening stops, taking partial profits, or counter-trend shorts.
Bullish Signal:
Appears at fresh swing lows with exhaustion conditions met. Useful for trailing stops, profit-taking, or counter-trend longs.
Recommended Timeframes: Works best on 1h, 4h, and Daily charts.
Markets: Crypto, Forex, Stocks — wherever volatility and trends are present.
⚙️ Inputs
RSI Length / Overbought / Oversold
Volume SMA Length & Volume Spike Multiplier
Wick Threshold %
Extremum Lookback (bars for highs/lows)
ADX Length & Threshold
Body Size ATR Factor
⚠️ Disclaimer
This script is for educational purposes only and does not constitute financial advice.
Always test thoroughly and apply proper risk management before live trading.
💡 Tip: Combine this tool with your own market context and confluence factors for higher probability setups.

JHW Volume Based Buy and Sell MomentumThe JHW Volume-Based Buy and Sell Momentum indicator is a custom momentum oscillator designed to capture market sentiment based on volume dynamics and price rate of change (ROC). It aims to identify bullish or bearish momentum by analyzing how price reacts to increasing or decreasing trading volume.
Core Logic:
The indicator calculates the Rate of Change (ROC) of the closing price.
It then accumulates this ROC separately based on whether the current volume is lower or higher than the previous bar:
If volume decreases, the ROC is added to a "negative volume index" accumulator.
If volume increases, the ROC is added to a "positive volume index" accumulator.
These two accumulators are combined to form a net momentum line.
Smoothing:
A Simple Moving Average (SMA) is applied to both accumulators over a user-defined period (default: 25 bars).
The sum of these smoothed values forms the signal line.
Visualization:
The indicator plots:
The net momentum line (yellow).
The smoothed signal line (blue).
The area between the two lines is filled with color:
Yellow when momentum is above the signal (bullish).
Blue when momentum is below the signal (bearish).
Bar colors are also adjusted to reflect the current momentum state.
Use Case:
This indicator helps traders:
Detect volume-driven momentum shifts.
Identify potential buy or sell zones based on volume behavior.
Confirm trends or spot early reversals.

ATR as % of CloseATR 14day period in % terms
the Normal ATR indicator by TV helps but this gives a clear idea as to the range in percentage terms as and when market rises to newer and newer highs
better than an absolute value

PHL Sweep Signals(1 Hour)PHL Sweep Signals (Full History)
This indicator is designed to identify high-probability reversal setups by detecting liquidity sweeps of the previous standard hour's high and low (PHL). It provides clear, actionable signals complete with visual aids and a data table to keep you in tune with the higher-timeframe context.
Key Features
Previous Hour Levels: Automatically draws the high and low of the previous standard hour as key reference lines for the current trading hour. The line colors rotate to provide a clear visual separation.
Bearish Sweep Signal: Identifies a specific bearish pattern: a green (bullish) candle that wicks above the previous hour's high but fails to hold, with its body remaining entirely below the line.
Bullish Sweep Signal: Identifies the opposite bullish pattern: a red (bearish) candle that wicks below the previous hour's low but is absorbed, with its body remaining entirely above the line.
Clear Visual Signals: When a signal is confirmed, the indicator provides a multi-faceted alert:
Plots a "Buy" or "Sell" arrow on the chart.
Draws a colored box around the signal candle for easy identification.
Displays a label with the potential Stop Loss size (calculated from the size of the signal candle).
Informative Display Table: Includes a convenient table in the corner showing the Open and Close data for the last 3 hours, helping you stay aware of the broader market context without leaving your chart.
Built-in Alerts: Triggers an alert for every confirmed Buy and Sell signal so you never miss a potential setup.
How to Use
This indicator helps you spot potential exhaustion and reversals at key hourly levels.
A "Sell" signal suggests a failed breakout to the upside, indicating potential weakness and a possible entry for shorts.
A "Buy" signal suggests a failed breakdown to the downside, indicating potential strength and a possible entry for longs.
As with any tool, these signals are most powerful when used as part of a comprehensive trading strategy and combined with your own analysis for confirmation.
Optimal Settings:
Timeframe: 5-Minute
Time Zone: UTC-4 (New York Time)
-ratheeshinv

Smart Money Breakout Channels [AlgoAlpha]🟠 OVERVIEW
This script draws breakout detection zones called “Smart Money Breakout Channels” based on volatility-normalized price movement and visualizes them as dynamic boxes with volume overlays. It identifies temporary accumulation or distribution ranges using a custom normalized volatility metric and tracks when price breaks out of those zones—either upward or downward. Each channel represents a structured range where smart money may be active, helping traders anticipate key breakouts with added context from volume delta, up/down volume, and a visual gradient gauge for momentum bias.
🟠 CONCEPTS
The script calculates normalized price volatility by measuring the standard deviation of price mapped to a scale using the highest and lowest prices over a set lookback period. When normalized volatility reaches a local low and flips upward, a boxed channel is drawn between the highest and lowest prices in that zone. These boxes persist until price breaks out, either with a strong candle close (configurable) or by touching the boundary. Volume analysis enhances interpretation by rendering delta bars inside the box, showing volume distribution during the channel. Additionally, a real-time visual “gauge” shows where volume delta sits within the channel range, helping users spot pressure imbalances.
🟠 FEATURES
Automatic detection and drawing of breakout channels based on volatility-normalized price pivots.
Optional nested channels to allow multiple simultaneous zones or a clean single-zone view.
Gradient-filled volume gauge with dynamic pointer to show current delta pressure within the box.
Three volume visualization modes: raw volume, comparative up/down volume, and delta.
Alerts for new channel creation and confirmed bullish or bearish breakouts.
🟠 USAGE
Apply the indicator to any chart. Wait for a new breakout box to form—this occurs when volatility behavior shifts and a stable range emerges. Once a box appears, monitor price relative to its boundaries. A breakout above suggests bullish continuation, below suggests bearish continuation; signals are stronger when “Strong Closes Only” is enabled.
Watch the internal volume candles to understand where buy/sell pressure is concentrated during the box. Use the gauge on the right to interpret whether net pressure is building upward or downward before breakout to anticipate the direction.
Use alerts to catch breakout events without needing to monitor the chart constantly 🚨.

多维度市场分析指标 v2 (区间框选)使用大周期MACD的能量柱作为背景用于识别趋势并且搭配上伦敦和纽约交易session
we are using a high time frame macd momentum as chart background to analysis a trend and using london and newyork session to help you trade better

Price Exhaustion Envelope [BackQuant]Price Exhaustion Envelope
Visual preview of the bands:
What it is
The Price Exhaustion Envelope (PEE) is a multi‑factor overextension detector wrapped inside a dynamic envelope framework. It measures how “tired” a move is by blending price stretch, volume surges, momentum and acceleration, plus optional RSI divergence. The result is a composite exhaustion score that drives both on‑chart signals and the adaptive width of three optional envelope bands around a smoothed baseline. When the score spikes above or below your chosen threshold, the script can flag exhaustion, paint candles, tint the background and fire alerts.
How it works under the hood
Exhaustion score
Price component: distance of close from its mean in standard deviation units.
Volume component: normalized volume pressure that highlights unusual participation.
Momentum component: rate of change and acceleration of price, scaled by their own volatility.
RSI divergence (optional): bullish and bearish divergences gently push the score lower or higher.
Mode control: choose Price, Volume, Momentum or Composite. Composite averages the main pieces for a balanced view.
Energy scale (0 to 100)
The composite score is pushed through a logistic transform to create an “energy” value. High energy (above 70 to 80) signals a move that may be running hot, while very low energy (below 20 to 30) points to exhaustion on the downside.
Envelope engine
Baseline: EMA of price over the main lookback length.
Width: base width is standard deviation times a multiplier.
Type selector:
• Static keeps the width fixed.
• Dynamic expands width in proportion to the absolute exhaustion score.
• Adaptive links width to the energy reading so bands breathe with market “heat.”
Smoothing: a short EMA on the width reduces jitter and keeps bands pleasant to trade around.
Band architecture
You can toggle up to three symmetric bands on each side of the baseline. They default to 1.0, 1.6 and 2.2 multiples of the smoothed width. Soft transparent fills create a layered thermograph of extension. The outermost band often maps to true blow‑off extremes.
On‑chart elements
Baseline line that flips color in real time depending on where price sits.
Up to three upper and lower bands with progressive opacity.
Triangle markers at fresh exhaustion triggers.
Tiny warning glyphs at extreme upper or lower breaches.
Optional bar coloring to visually tag exhausted candles.
Background halo when energy > 80 or < 20 for instant context.
A compact info table showing State, Score, Energy, Momentum score and where price sits inside the envelope (percent).
How to use it in trading
Mean reversion plays
When price pierces the outer band and an exhaustion marker prints, look for reversal candles or lower‑timeframe confirmation to fade the move back toward the baseline.
For conservative entries, wait for the composite score to roll back under the threshold or for energy to drop from extreme to neutral.
Set stops just beyond the extreme levels (use extreme_upper and extreme_lower as natural invalidation points). Targets can be the baseline or the opposite inner band.
Trend continuation with smart pullbacks
In strong trends, the first tag of Band 1 or Band 2 against the dominant direction often offers low‑risk continuation entries. Use energy readings: if energy is low on a pullback during an uptrend, a bounce is more likely.
Combine with RSI divergence: hidden bullish divergence near a lower band in an uptrend can be a powerful confirmation.
Breakout filtering
A breakout that occurs while the composite score is still moderate (not exhausted) has a higher chance of follow‑through. Skip signals when energy is already above 80 and price is punching the outer band, as the move may be late.
Watch env_position (Envelope %) in the table. Breakouts near 40 to 60 percent of the envelope are “healthy,” while those at 95 percent are stretched.
Scaling out and risk control
Use exhaustion alerts to trim positions into strength or weakness.
Trail stops just outside Band 2 or Band 3 to stay in trends while letting the envelope expand in volatile phases.
Multi‑timeframe confluence
Run the script on a higher timeframe to locate exhaustion context, then drill down to a lower timeframe for entries.
Opposite signals across timeframes (daily exhaustion vs. 5‑minute breakout) warn you to reduce size or tighten management.
Key inputs to experiment with
Lookback Period: larger values smooth the score and envelope, ideal for swing trading. Shorter values make it reactive for scalps.
Exhaustion Threshold: raise above 2.0 in choppy assets to cut noise, drop to 1.5 for smooth FX pairs.
Envelope Type: Dynamic is great for crypto spikes, Adaptive shines in stocks where volume and volatility wave together.
RSI Divergence: turn off if you prefer a pure price/volume model or if divergence floods the score in your asset.
Alert set included
Fresh upper exhaustion
Fresh lower exhaustion
Extreme upper breach
Extreme lower breach
RSI bearish divergence
RSI bullish divergence
Hook these to TradingView notifications so you get pinged the moment a move hits exhaustion.
Best practices
Always pair exhaustion signals with structure. Support and resistance, liquidity pools and session opens matter.
Avoid blindly shorting every upper signal in a roaring bull market. Let the envelope type help you filter.
Use the table to sanity‑check: a very high score but mid‑range env_position means the band may still be wide enough to absorb more movement.
Backtest threshold combinations on your instrument. Different tickers carry different volatility fingerprints.
Final note
Price Exhaustion Envelope is a flexible framework, not a turnkey system. It excels as a context layer that tells you when the crowd is pressing too hard or when a move still has fuel. Combine it with sound execution tactics, risk limits and market awareness. Trade safe and let the envelope breathe with the market.

HTF Candles [theUltimator5]Overlay higher timeframe candles on any lower timeframe chart with real-time updates.
This indicator displays the full structure of each higher timeframe (HTF) candle—including open-close bodies and full wicks—directly on your current chart. Great for multi-timeframe traders who want to align short-term entries with broader market context.
🔹 Features:
View higher timeframe candles (e.g., 1H, 4H, Daily) on intraday charts
Dynamic candle bodies that update in real-time
Accurate wick representation with auto-redrawing
Customizable bullish/bearish colors and transparency
Efficient object management for minimal clutter
🛠️ How to Use:
Add this indicator to a lower timeframe chart (e.g., 1m, 5m, or 15m).
Select a higher timeframe (must be greater than your chart timeframe).
Customize your candle colors and transparency for better visibility.
Watch as each higher timeframe candle evolves live with every bar.
📌 Example: Use a 5-minute chart with a 1-hour HTF overlay to track hourly market structure without switching timeframes.

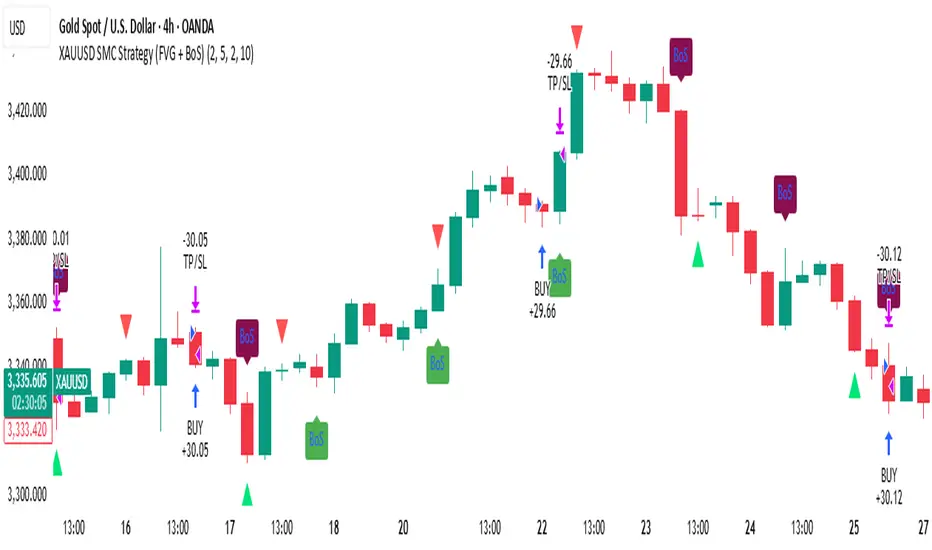
XAUUSD SMC Strategy (FVG + BoS)This advanced TradingView strategy is built for serious traders who follow Smart Money Concepts (SMC), with a special focus on Fair Value Gaps (FVG) and Break of Structure (BoS). The script automates trade entries and visual signals based on clean price action, while also allowing for performance backtesting through the built-in Strategy Tester.
The purpose of this script is to combine high-probability SMC signals with a clear and flexible backtest engine. Traders can visually confirm institutional moves (like imbalances and structure breaks) while simultaneously analyzing strategy performance, risk-reward, and execution logic — all from one chart.
⚙️ Key Features
FVG Detection: Automatically identifies bullish and bearish fair value gaps, highlighting imbalance zones between institutional buying and selling activity.
Break of Structure (BoS): Clearly shows bullish and bearish structure breaks, helping traders confirm directional bias and spot trend shifts with clarity.
Trade Execution Logic: Designed with actual strategy.entry() and strategy.exit() functions, this script simulates trades using risk-controlled logic with stop loss and take profit targeting.
Spaced Signal Visualization: Avoids chart clutter by spacing FVG and BoS signals, making the visual output clean and readable — even on fast-moving charts like XAUUSD.
Risk-Reward Customization: Easily set your own risk:reward ratio and stop-loss buffer, ensuring each trade is simulated according to your personal strategy or trading plan.
Cool-Down System: Add a delay between trades using the “Bars Between Trades” setting to prevent overtrading during volatile periods.
Live and Historical Insights: Signals appear in real-time, while also being plotted historically — making it easy to scroll back and study how the market behaved under this logic.
Fully Editable Parameters: Customize FVG size, structure lookback, spacing intervals, and more to fit your unique interpretation of SMC methodology.
🧠 How It Works
This strategy combines two key concepts:
FVG (Fair Value Gaps): Price zones where the market moved too quickly and left an imbalance between buyers and sellers. These gaps often act as magnets for price or areas of reversal.
BoS (Break of Structure): Points where the price breaks through a significant high or low, indicating a potential shift in market direction.
When both FVG and BoS align under certain conditions — and the cooldown requirement is satisfied — the strategy places a trade. A take profit and stop loss are automatically applied based on your inputs.
📈 Practical Use Cases
Trend Confirmation: Use BoS signals to validate trend continuation trades, especially when FVG confirms the imbalance.
Reversal Zones: Spot potential turning points when price fills an FVG and breaks previous structure in the opposite direction.
Backtest SMC Logic: Validate your theory by testing this strategy over historical XAUUSD data using real stop loss / take profit logic.
Refine Entry Timing: Study how structure breaks and FVGs align in different timeframes to improve entry precision.
💡 Best For
Traders learning or mastering Smart Money Concepts
Price action purists who avoid indicators
XAUUSD scalpers, day traders, or swing traders
Strategy developers who want visual + backtested confirmation
📌 Notes
The default strategy places trades every 10 candles to ensure the engine runs — replace this with your refined FVG + BoS logic as needed.
Works best on Gold (XAUUSD) 4H, 1H, or 15m timeframes depending on volatility and structure spacing.
🔒 Disclaimer
This strategy is for educational purposes only. It does not constitute financial advice. Always test and validate any trading logic before applying it to a live market. Trading carries risk — use proper risk management.
Custom NY Opening Bell - Today OnlyThis indicator shows NYC ET opening bell.
It will displace a dashed line on it.
This can be very useful for trades journaling their trades with screenshots.
My indicator will let you know when opening bell happened.
It is also very great when doing backtesting.
BB + RSI Strategy Optimized✅ Pine Script Version 5
✅ Complete Strategy: Long + Short
✅ Automatic Entry and Exit
✅ Visual Signals: Buy/Sell, Short/Cover
✅ Trailing Take Profit
✅ Progressive

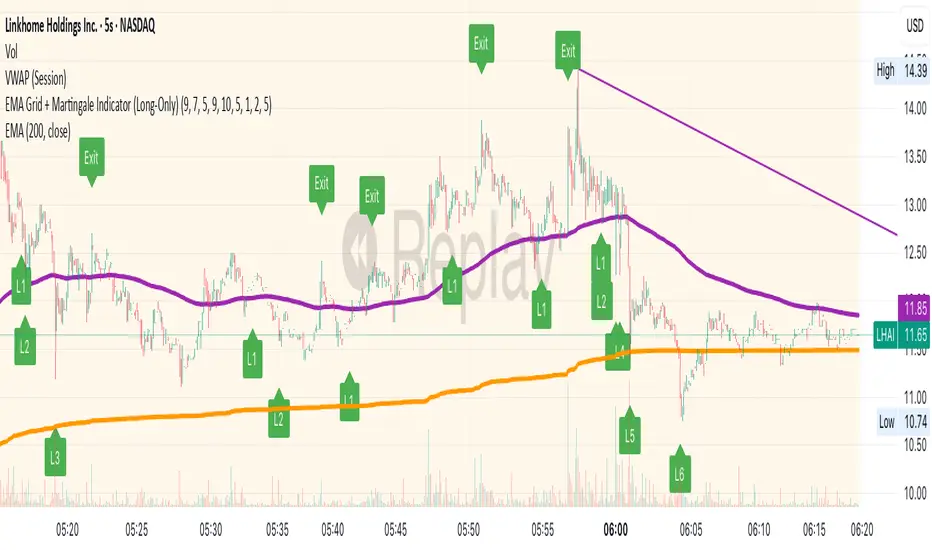
EMA Grid + Martingale Indicator (Long-Only)Title:
EMA Grid + Martingale Indicator (Long-Only)
Short Summary:
A 4-EMA trend filter combined with a grid-based entry system and optional martingale sizing to visualize staged long entries and exits in bullish markets.
Full Description:
This indicator combines a 4-EMA trend filter with a grid-based entry system and optional martingale-style position sizing to help traders visualize staged long entries and exits in trending markets.
How It Works
1. Trend Detection: Uses two sets of EMAs (fast/slow pairs) to confirm bullish momentum. A long signal is generated when both EMA groups align in an uptrend.
2. Grid Entries: After the initial long entry, additional grid levels are triggered every time price drops by the specified grid step (in pips).
3. Martingale Sizing (Optional): Each subsequent entry can increase in size based on the defined martingale factor.
4. Weighted-Average Exit: Calculates the weighted average of all grid entries and signals an exit when the price reaches or surpasses this level plus an optional buffer.
Key Features
• 4 EMA Trend Filter with fully customizable lengths.
• Dynamic grid entries with visual labels (L1, L2, etc.).
• Optional martingale position sizing.
• Weighted-average exit with adjustable buffer.
• Customizable parameters for EMAs, grid steps, max entries, and buffer pips.
• Clear chart visualization of EMAs and entry/exit levels.
Use Cases
• For traders using cost-averaging or grid strategies in bullish markets.
• Visualizes multiple entry levels and profit targets.
• Useful for backtesting and strategy planning.
Note: This indicator is for visualization and planning purposes only. It does not execute trades automatically. It does not guarantee profits and is not financial advice.
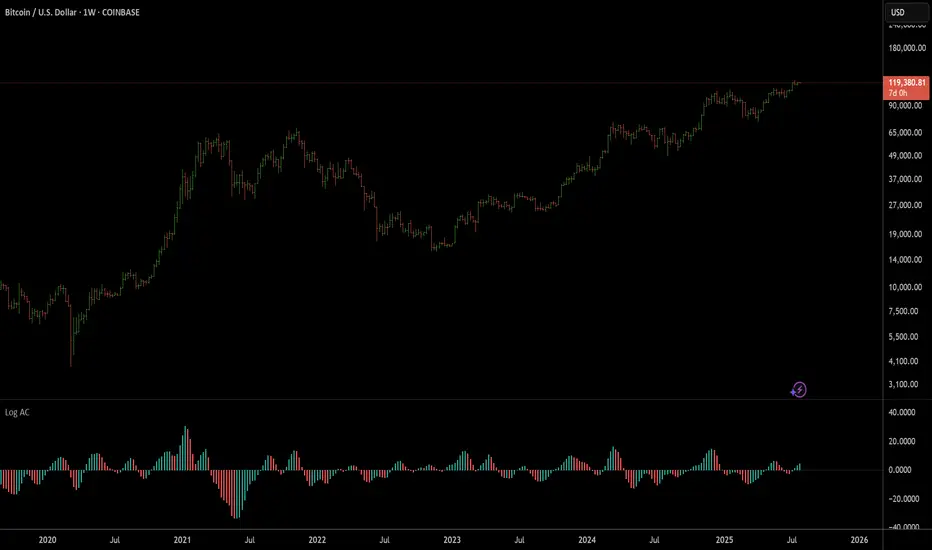
William's Accelerator Oscillator (AC) - Log-ScaledA 5-34-5 MACD histogram, aka William's Accelerator Oscillator, scaled to log-price.
Useful for seeing the change in the speed of the momentum, particularly within the log-scaled AO. Works better than the original (non log) AC for long-term and volatile price action which exhibits logarithmic growth trends.
William's Awesome Oscillator (AO) - Log-scaledA 5-34-5 MACD plotted as a histogram, aka William's Awesome Oscillator (AO), scaled to log price.
Useful for finding momentum divergences in volatile and long-term price charts which show logarithmic trends. As you can see compared to the original (not log) AO indicator, it follows the momentum on the log-scaled price chart much more closely.

Multi Rate of Change (ROC) - 3 LinesMulti Rate of Change (ROC) - 3 Lines
This custom indicator displays three Rate of Change (ROC) lines, each with independently adjustable lookback periods (default: 7, 30, and 100 days). It allows you to quickly compare short-, mid-, and long-term price momentum on the same chart.
All ROC lines show the percent change of the close price compared to N bars ago.
The color, thickness, and style (solid, dotted, dashed) of each ROC line can be customized in the settings.
A zero reference line is included and can also be customized.
Suitable for momentum analysis and identifying trend acceleration or deceleration at multiple timeframes.
Designed for easy use: simply add the indicator to your chart and adjust the settings as needed.
How to use:
Add the indicator to your chart.
Set each ROC period (e.g., 7, 30, 100 days) as desired.
Adjust colors, line widths, and styles for better visibility.
Interpret positive ROC values as upward momentum, negative values as downward momentum.
No repainting. All calculations use close prices only.
If you need more ROC lines or additional features, let me know!

HTF Sweep Model with CISD Table vmodA mod of NotProfGreens w/ alerts and some stylish options- thanks for your work.

Trigonometric StochasticTrigonometric Stochastic - Mathematical Smoothing Oscillator
Overview
A revolutionary approach to stochastic oscillation using sine wave mathematical smoothing. This indicator transforms traditional stochastic calculations through trigonometric functions, creating an ultra-smooth oscillator that reduces noise while maintaining sensitivity to price changes.
Mathematical Foundation
Unlike standard stochastic oscillators, this version applies sine wave smoothing:
• Raw Stochastic: (close - lowest_low) / (highest_high - lowest_low) × 100
• Trigonometric Smoothing: 50 + 50 × sin(2π × raw_stochastic / 100)
• Result: Naturally smooth oscillator with mathematical precision
Key Features
Advanced Smoothing Technology
• Sine Wave Filter: Eliminates choppy movements while preserving signal integrity
• Natural Boundaries: Mathematically constrained between 0-100
• Reduced False Signals: Trigonometric smoothing filters market noise effectively
Traditional Stochastic Levels
• Overbought Zone: 80 level (dashed line)
• Oversold Zone: 20 level (dashed line)
• Midline: 50 level (dotted line) - equilibrium point
• Visual Clarity: Clean oscillator panel with clear level markings
Smart Signal Generation
• Anti-Repaint Logic: Uses confirmed previous bar values
• Buy Signals: Generated when crossing above 30 from oversold territory
• Sell Signals: Generated when crossing below 70 from overbought territory
• Crossover Detection: Precise entry/exit timing
Professional Presentation
• Separate Panel: Dedicated oscillator window (overlay=false)
• Price Format: Formatted as price indicator with 2-decimal precision
• Theme Adaptive: Automatically matches your chart color scheme
Parameters
• Cycle Length (5-200): Period for highest/lowest calculations
- Shorter periods = more sensitive, more signals
- Longer periods = smoother, fewer but stronger signals
Trading Applications
Momentum Analysis
• Overbought/Oversold: Clear visual identification of extreme levels
• Momentum Shifts: Early detection of momentum changes
• Trend Strength: Monitor oscillator position relative to midline
Signal Trading
• Long Entries: Buy when crossing above 30 (oversold bounce)
• Short Entries: Sell when crossing below 70 (overbought rejection)
• Confirmation Tool: Use with trend indicators for higher probability trades
Divergence Detection
• Bullish Divergence: Price makes lower lows, oscillator makes higher lows
• Bearish Divergence: Price makes higher highs, oscillator makes lower highs
• Early Warning: Spot potential trend reversals before they occur
Trading Strategies
Scalping (5-15min timeframes)
• Use cycle length 10-14 for quick signals
• Focus on 20/80 level bounces
• Combine with price action confirmation
Swing Trading (1H-4H timeframes)
• Use cycle length 20-30 for reliable signals
• Wait for clear crossovers with momentum
• Monitor divergences for reversal setups
Position Trading (Daily+ timeframes)
• Use cycle length 50+ for major signals
• Focus on extreme readings (below 10, above 90)
• Combine with fundamental analysis
Advantages Over Standard Stochastic
1. Smoother Action: Sine wave smoothing reduces whipsaws
2. Mathematical Precision: Trigonometric functions provide consistent behavior
3. Maintained Sensitivity: Smoothing doesn't compromise signal quality
4. Reduced Noise: Cleaner signals in volatile markets
5. Visual Appeal: More aesthetically pleasing oscillator movement
Best Practices
• Market Context: Consider overall trend direction
• Multiple Timeframe: Confirm signals on higher timeframes
• Risk Management: Always use proper position sizing
• Backtesting: Test parameters on your preferred instruments
• Combination: Works excellently with trend-following indicators
Built-in Alerts
• Buy Alert: Trigonometric stochastic oversold crossover
• Sell Alert: Trigonometric stochastic overbought crossunder
Technical Specifications
• Pine Script Version: v6
• Panel: Separate oscillator window
• Format: Price indicator with 2-decimal precision
• Performance: Optimized for all timeframes
• Compatibility: Works with all instruments
Free and open-source indicator. Modify, improve, and share with the community!
Educational Value: Perfect for traders wanting to understand how mathematical smoothing improves oscillators and trigonometric applications in technical analysis.
