EMA BUY/SELLEMA
Buy/sell using ema cross over for making trading simple.
you even have the option to change the EMAs when needed
Indicators and strategies

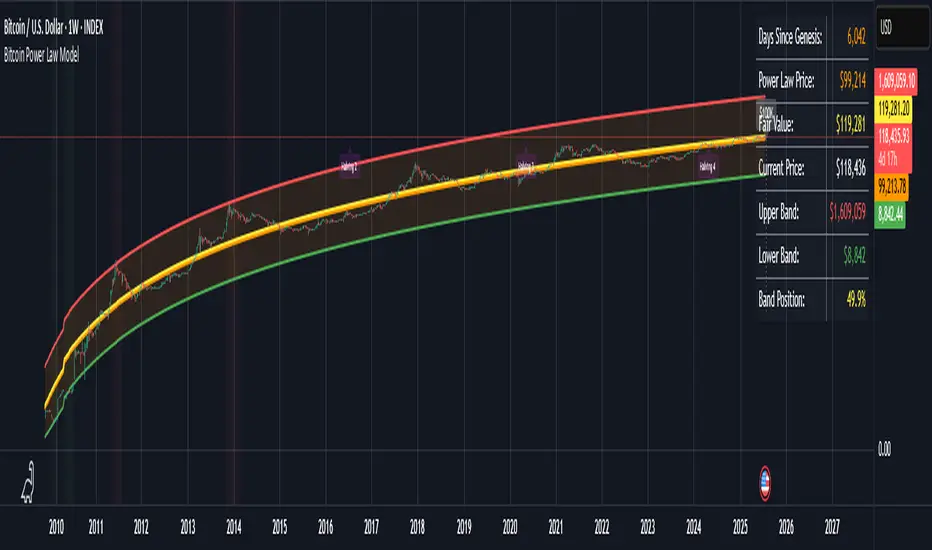
Bitcoin Power Law ModelBitcoin Power Law Model with Cycle Predictions
Scientific Price Modeling for Bitcoin
This indicator implements **Dr. Giovanni Santostasi's Bitcoin Power Law Theory** - a discovery that Bitcoin's price follows mathematical laws similar to natural phenomena. Unlike traditional financial models, this treats Bitcoin as a scale-invariant system that grows predictably over time.
What Makes This Special
Dr. Santostasi, an astrophysicist who studied gravitational waves, discovered that Bitcoin's price forms a perfect straight line when plotted on a log-log scale over its entire 15-year history. This isn't just another technical indicator - it's a fundamental law that has held true through multiple 80%+ crashes and recoveries.
Core Features
Power Law Model
- Orange Line: The power law trajectory showing Bitcoin's long-term growth path
- Yellow Line: Fair value (geometric mean between support and resistance)
- Green/Red Bands: Support and resistance levels that have historically contained price movements
- Band Position %: Shows exactly where price sits within the power law channel (0-100%)
How to Use It
For Long-term Investors
1. Accumulate when price is near the green support line (band position < 20%)
2. Hold when price is between the bands
3. Consider profits when approaching red resistance (band position > 80%)
4. Never panic - the model shows $30K+ is now the permanent floor
Key Metrics to Watch
- **Band Position: <20% = Oversold, >80% = Overbought
- Fair Value: Price above = Overvalued, below = Undervalued
- Support Line: Breaking below suggests model invalidation
Current Cycle Projections
Based on the November 2022 bottom at ~$15,500:
- Cycle Peak: ~$155,000-$230,000 (October 2025)
- Next Bottom: ~$70,000-$100,000 (October 2026)
- Long-term: $1 million by 2033 (power law projection)
Customizable Settings
Model Parameters
- Intercept & Slope: Fine-tune the power law formula
- Band Offsets: Adjust support/resistance distances
Display Options
- Toggle each visual element on/off
- Show/hide future projections
- Enable/disable cycle analysis
- Customize halving markers
Understanding the Math
The model uses the formula: **Price = 10^(A + B × log10(days since genesis))**
Where:
- A = -17.01 (intercept)
- B = 5.82 (slope)
- Days counted from Bitcoin's genesis block (Jan 3, 2009)
This creates parallel support/resistance lines in log-log space that have contained Bitcoin's price for 15+ years.
Important
1.Not Financial Advice: This is a mathematical model, not a guarantee
2. Long-term Focus: Best suited for macro analysis, not day trading
3. Model Limitations: Past performance doesn't ensure future results
4. Volatility Expected: 50-80% drawdowns are normal within the model
Background
Dr. Giovanni Santostasi discovered this model while analyzing Bitcoin through the lens of physics. He found that Bitcoin behaves more like a city or organism than a financial asset, growing according to universal power laws found throughout
EMA Buy/SellBuy /Sell using EMA Crossover.
this gives early signal foy both buying and selling and one can use this to take the trades

9:30 AM Candle MarkerEach day at 9:30 AM, on the 15-minute chart, you’ll see a red vertical line appear exactly on that candle. This makes it super easy to:
Track reactions to market open (if using US stocks).
Anchor your strategy to a consistent time point.
Build routines around a known time.

Bitcoin Stock-to-Flow Model Price Bands# Bitcoin Stock-to-Flow Model Price Bands
Overview
This indicator implements the famous Stock-to-Flow (S2F) model created by PlanB (@100trillionUSD), which uses Bitcoin's scarcity to predict its long-term value. The S2F model has gained significant attention for its historical accuracy in capturing Bitcoin's price movements across multiple market cycles.
What is Stock-to-Flow?
Stock-to-Flow is a ratio that measures scarcity by dividing the current supply (stock) by the annual production (flow). The model suggests that as Bitcoin becomes scarcer through halving events, its value should increase proportionally.
This indicator features:
Dynamic S2F Calculation
- Automatically calculates Bitcoin's current supply based on block height
- Adjusts for halving events (every 210,000 blocks)
- Updates the S2F ratio in real-time
Visual Elements
- Orange Line: S2F model price based on the formula: Price = 0.4 × S2F³
- Confidence Bands: Upper (red) and lower (green) bands showing expected price ranges
- Colored Candles: Green when above model price, red when below
- Info Table: Displays current S2F ratio, model price, actual price, and price multiple
Customizable Parameters
- Model Coefficient: Adjust the multiplier (default: 0.4)
- Model Exponent: Modify the power factor (default: 3.0)
- Band Width: Control confidence band spread (1-5 standard deviations)
- Display Options: Toggle individual elements on/off
Built-in Alerts
- Price crossing above/below S2F model price
- Price exceeding upper/lower confidence bands
How to Use
1. Trend Identification: When price is above the orange S2F line, Bitcoin may be overvalued; below suggests undervaluation
2. Cycle Analysis: The model steps up at each halving, creating distinct price "floors"
3. Risk Management: Use confidence bands to identify extreme deviations from the model
4. Long-term Perspective: Best suited for macro analysis rather than short-term trading
Important to understand:
This is a model, not a guarantee. The S2F model:
- Assumes scarcity is the primary driver of value
- Doesn't account for demand-side factors
- Has shown deviations during certain market conditions
- Should be used alongside other analysis methods
Model Performance
Historically, the S2F model has captured major Bitcoin price movements:
- 2013 Bull Run: Price followed model predictions
- 2017 Peak: Reached model targets
- 2021 Cycle: Initially tracked, then deviated
- 2024-2025: Model suggests $500k-$1M potential
Technical Details
- Uses logarithmic regression similar to the original S2F model
- Accounts for "lost" coins (est. 1M BTC from early mining)
- Implements dynamic supply calculation through halving cycles
- Confidence bands use log-normal distribution
Best Timeframes
- Weekly/Monthly: Ideal for long-term trend analysis
Credits
Based on the Stock-to-Flow model by PlanB (@100trillionUSD)
Original article: "Modeling Bitcoin's Value with Scarcity" (2019)


Normalized Price Line with Adjustable Slope‑EMAThis anchored, normalized chart lets you see true percentage moves and swing pivots at a glance—removing guesswork about entry and exit levels. The noise‑filtered, slope‑colored EMAs then highlight only meaningful trend shifts, so you act on real momentum rather than every price twitch.
By anchoring price to a single starting bar, the indicator turns absolute price into a scale‑free “performance” line, where a value of 1.25 means price is up 25% since the anchor, and 0.80 means it’s down 20%. Overlaying that with a midpoint “shelf” line shows key swing levels where price has historically bounced or broken through. When your normalized price crosses above or below this reclaim level, you get an immediate read on whether a swing recovery or breakdown is occurring.
Layered on top are dynamically colored EMAs: a custom “Slope EMA” that changes color based on its recent slope, and classic 83‑ and 200‑period EMAs on the normalized series. The Slope EMA filters out noise by only turning your chosen up, down, or flat colors when its acceleration truly shifts. Meanwhile, crossovers of the faster 83‑EMA over the slower 200‑EMA give you traditional trend‑following confirmation. Together, these elements blend relative performance, structural support, and trend strength into one view—helping you spot higher‑probability entries and stay aligned with market momentum.
Intended for advanced users because user options are nuanced. For example, this indicator plots relative performance rather than raw price, you’ll want to toggle between linear and logarithmic scales (via the “Log” button on the y‑axis) and use the “Anchor” button to lock in your starting reference. That way, every move is shown in the same “language” of percentage moves, ensuring you’re comparing apples to apples across timeframes.

Timed Trade Close AlertEnables you to set up alerts that can be used to close all trades when used in conjunction with web hooks.
Firstly, you can enable a daily alert at a regular time to avoid spread blow outs during roll overs. ie: This will alert at the same time each day
Additionally, you can enable and program up to 8 individual alerts to address news events or any other situations that you would want to halt your trading. The day, hour and minute can be adjusted according

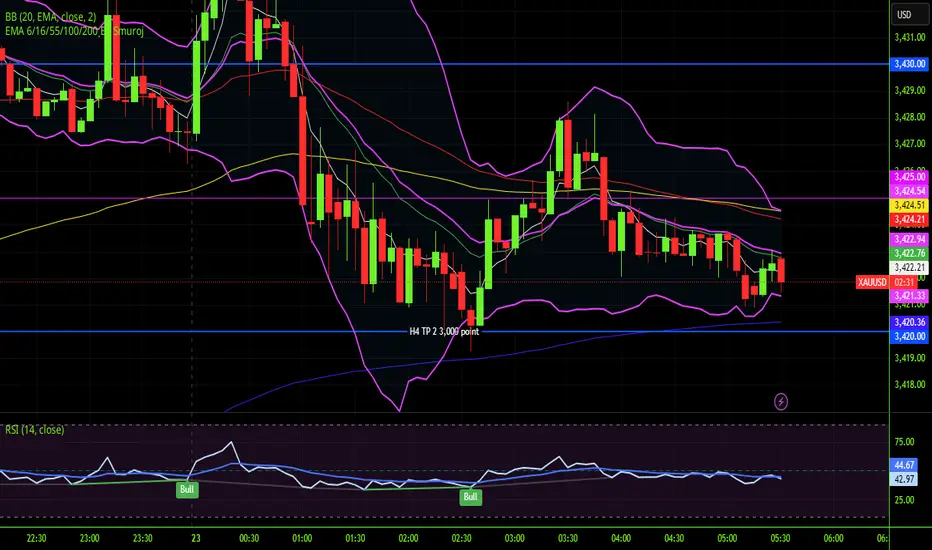
Bollinger Bands📊 Bollinger Bands Strategy: Ride the Waves of Volatility 🌊
Bollinger Bands are a powerful tool to identify overbought and oversold conditions, volatility breakouts, and price reversals. This strategy uses:
🔹 Middle Band – 20-period simple moving average
🔹 Upper & Lower Bands – 2 standard deviations away from the SMA
💡 Strategy Logic:
Buy Entry: When price closes below the lower band and RSI < 30 → Expect mean reversion.
Sell Entry: When price closes above the upper band and RSI > 70 → Possible pullback.
Exit: Near middle band or opposite band.
📈 You can also use Bollinger Band squeezes to detect upcoming breakouts. Less distance = low volatility → Expansion = potential big move!
🧠 Great for swing trading or intraday scalping with proper risk management.

Trent_Finder V3EMA Inputs
It uses 6 EMAs with customizable lengths (defaults: 30, 35, 40, 45, 50, 60).
Trend Conditions
Bullish Trend: All EMAs are strictly ordered from smallest to largest, meaning short-term prices are leading long-term prices upward.
Bearish Trend: All EMAs are ordered from largest to smallest, meaning short-term prices are falling below long-term ones.
Neutral: EMAs are mixed and do not meet the above criteria.
Trend Tracking
The script remembers the current trend and only flips when a full trend reversal condition is confirmed.
Signals
A Buy Signal appears when a bearish or neutral trend changes to bullish.
A Sell Signal appears when a bullish or neutral trend flips to bearish.
Visual Aids
All 6 EMAs are plotted on the chart.
Green Lines = Bullish trend
Red Lines = Bearish trend
Gray Lines = No trend (neutral)
Buy/Sell markers appear at turning points.

EMA 6/16/55/100/200 ฺBy Smurojคำอธิบายเป็นภาษาไทย
ชุด EMA นี้ประกอบด้วยเส้นค่าเฉลี่ยเคลื่อนที่แบบเอ็กซ์โปเนนเชียล (EMA) ระยะเวลาต่าง ๆ ซึ่งถูกนำมาใช้เพื่อวิเคราะห์แนวโน้มราคาในระยะต่าง ๆ ดังนี้:
EMA 6 และ 16: ใช้สำหรับดูแนวโน้มระยะสั้นและการเปลี่ยนแปลงราคาที่รวดเร็ว
EMA 55: เป็นแนวโน้มระยะกลาง
EMA 100 และ 200: เป็นแนวโน้มระยะยาว ซึ่งช่วยดูภาพรวมของแนวโน้มตลาดในระดับลึก
การใช้งานในการเทรด:
ถ้าราคาอยู่เหนือ EMA ระยะต่าง ๆ แสดงถึงแนวโน้มขาขึ้น
ถ้าราคาอยู่ต่ำกว่า EMA ระยะต่าง ๆ แสดงถึงแนวโน้มขาลง
การตัดกันของ EMA สั้นและยาว เช่น EMA 6 ตัด EMA 16 ขึ้นบน อาจเป็นสัญญาณซื้อ
การตัดกันในทางตรงกันข้าม อาจเป็นสัญญาณขาย
การใช้หลายเส้นช่วยยืนยันแนวโน้มและลดความผิดพลาดในการตัดสินใจ
English Explanation
This EMA set consists of various Exponential Moving Average lines over different periods, which are used to analyze price trends across various timeframes:
EMA 6 and 16: For short-term trend analysis and quick price changes.
EMA 55: Represents a medium-term trend.
EMA 100 and 200: Indicate long-term trends, helping to view the overall market direction.
How to use in trading:
When price is above these EMA lines, it suggests an uptrend.
When price is below these EMA lines, it indicates a downtrend.
Crossovers between short and longer EMAs (e.g., EMA 6 crossing above EMA 16) can signal buy opportunities.
Conversely, crossovers downward can signal sell opportunities.
Using multiple EMA lines helps confirm the trend and reduce false signals.
EMA 6/16/55/100/200คำอธิบายเป็นภาษาไทย
ชุด EMA นี้ประกอบด้วยเส้นค่าเฉลี่ยเคลื่อนที่แบบเอ็กซ์โปเนนเชียล (EMA) ระยะเวลาต่าง ๆ ซึ่งถูกนำมาใช้เพื่อวิเคราะห์แนวโน้มราคาในระยะต่าง ๆ ดังนี้:
EMA 6 และ 16: ใช้สำหรับดูแนวโน้มระยะสั้นและการเปลี่ยนแปลงราคาที่รวดเร็ว
EMA 55: เป็นแนวโน้มระยะกลาง
EMA 100 และ 200: เป็นแนวโน้มระยะยาว ซึ่งช่วยดูภาพรวมของแนวโน้มตลาดในระดับลึก
การใช้งานในการเทรด:
ถ้าราคาอยู่เหนือ EMA ระยะต่าง ๆ แสดงถึงแนวโน้มขาขึ้น
ถ้าราคาอยู่ต่ำกว่า EMA ระยะต่าง ๆ แสดงถึงแนวโน้มขาลง
การตัดกันของ EMA สั้นและยาว เช่น EMA 6 ตัด EMA 16 ขึ้นบน อาจเป็นสัญญาณซื้อ
การตัดกันในทางตรงกันข้าม อาจเป็นสัญญาณขาย
การใช้หลายเส้นช่วยยืนยันแนวโน้มและลดความผิดพลาดในการตัดสินใจ
English Explanation
This EMA set consists of various Exponential Moving Average lines over different periods, which are used to analyze price trends across various timeframes:
EMA 6 and 16: For short-term trend analysis and quick price changes.
EMA 55: Represents a medium-term trend.
EMA 100 and 200: Indicate long-term trends, helping to view the overall market direction.
How to use in trading:
When price is above these EMA lines, it suggests an uptrend.
When price is below these EMA lines, it indicates a downtrend.
Crossovers between short and longer EMAs (e.g., EMA 6 crossing above EMA 16) can signal buy opportunities.
Conversely, crossovers downward can signal sell opportunities.
Using multiple EMA lines helps confirm the trend and reduce false signals.

JMR vwap inside barThis indicator will add vwap and according to your chart time frame and also will mark inside bar candles.

Breakout Detector (5-min)//@version=5
indicator("Breakout Detector (5-min)", overlay=true)
// Define breakout range
length = input.int(20, minval=1, title="Lookback Period")
bullColor = color.green
bearColor = color.red
// Calculate highest high and lowest low of lookback period
highestHigh = ta.highest(high, length)
lowestLow = ta.lowest(low, length)
// Detect breakout
bullBreakout = close > highestHigh
bearBreakout = close < lowestLow
// Plot breakout signals
plotshape(bullBreakout, title="Bullish Breakout", location=location.abovebar, color=bullColor, style=shape.triangleup, size=size.small)
plotshape(bearBreakout, title="Bearish Breakout", location=location.belowbar, color=bearColor, style=shape.triangledown, size=size.small)
// Optional: Background color for breakout bars
bgcolor(bullBreakout ? color.new(bullColor, 85) : na)
bgcolor(bearBreakout ? color.new(bearColor, 85) : na)

Live Candle ±10 Points (Last 2 Bars Only)Autocalculates 10 points plus or minus on the previous 2 candles. Simple for quick reference on break even points or TP/SL areas if you're working on a fixed point strategy.

Binance Spot vs Perpetual Price index by BIGTAKER📌 Overview
This indicator calculates the premium (%) between Binance Perpetual Futures and Spot prices in real time and visualizes it as a column-style chart.
It automatically detects numeric prefixes in futures symbols—such as `1000PEPE`, `1MFLUX`, etc.—and applies the appropriate scaling factor to ensure accurate 1:1 price comparisons with corresponding spot pairs, without requiring manual configuration.
Rather than simply showing raw price differences, this tool highlights potential imbalances in supply and demand, helping to identify phases of market overheating or panic selling.
🔧 Component Breakdown
1. ✅ Auto Symbol Mapping & Prefix Scaling
Automatically identifies and processes common numeric prefixes (`1000`, `1M`, etc.) used in Binance perpetual futures symbols.
Example:
`1000PEPEUSDT.P` → Spot symbol: `PEPEUSDT`, Scaling factor: `1000`
This ensures precise alignment between futures and spot prices by adjusting the scale appropriately.
2. 📈 Premium Calculation Logic
Formula:
(Scaled Futures Price − Spot Price) / Spot Price × 100
Interpretation:
* Positive (+) → Futures are priced higher than spot: indicates possible long-side euphoria
* Negative (−) → Futures are priced lower than spot: indicates possible panic selling or oversold conditions
* Zero → Equilibrium between futures and spot pricing
3. 🎨 Visualization Style
* Rendered as column plots (bar chart) on each candle
* Color-coded based on premium polarity:
* 🟩 Positive premium: Light green (`#52ff7d`)
* 🟥 Negative premium: Light red (`#f56464`)
* ⬜ Neutral / NA: Gray
* A dashed horizontal line at 0% is included to indicate the neutral zone for quick visual reference
💡 Strategic Use Cases
| Market Behavior | Strategy / Interpretation |
| ----------------------------------------- | ------------------------------------------------------------------------ |
| 📈 Premium surging | Strong futures demand → Overheated longs (short setup) |
| 📉 Premium dropping | Aggressive selling in futures → Oversold signal (long setup) |
| 🔄 Near-zero premium | Balanced market → Wait and observe or reassess |
| 🧩 Combined with funding rate or OI delta | Enables multi-factor confirmation for short-term or mid-term signals |
🧠 Technical Advantages
* Fully automated scaling for prefixes like `1000`, `1M`, etc.
* Built-in error handling for inactive or missing symbols (`ignore_invalid_symbol=true`)
* Broad compatibility with Binance USDT Spot & Perpetual Futures markets
🔍 Target Use Cases & Examples
Compatible symbols:
`1000PEPEUSDT.P`, `DOGEUSDT.P`, `1MFLUXUSDT.P`, `ETHUSDT.P`, and most other Binance USDT-margined perpetual futures
Works seamlessly with:
* Binance Spot Market
* Binance Perpetual Futures Market

Squeeze with DojiThis script indicates Bollinger band squeeze into Keltner channels to identify the contraction of price and Doji candle formation, potentially leading up to the momentum expansion in price.
Add your preferable volume or price indicators on top of this volatility contraction indicator.
Feel free to use and share your feedback.

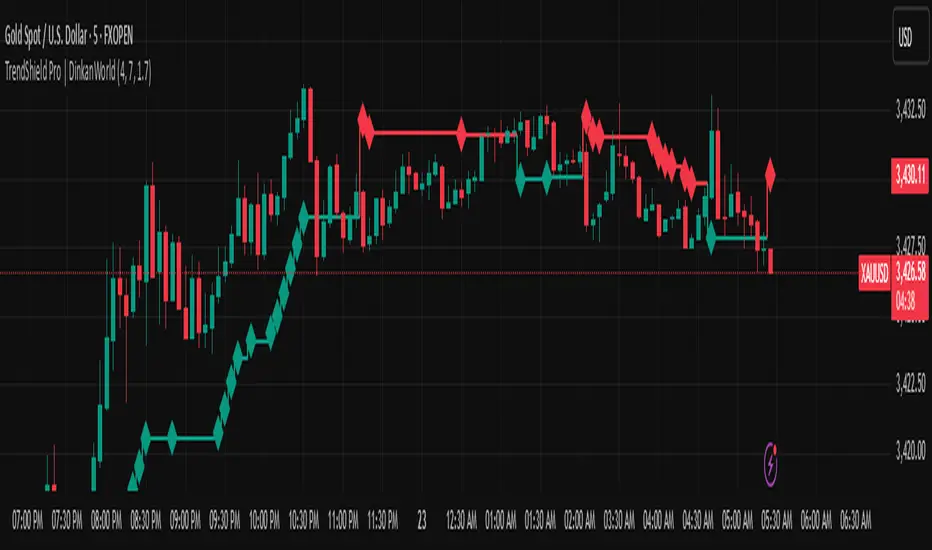
TrendShield Pro | DinkanWorldTrendShield Pro is a powerful price action tool that combines momentum-based trend detection with an ATR-powered trailing stop system. Built using EMA and ATR logic, this indicator helps traders identify real trends, manage dynamic stop-loss levels, and react faster to momentum shifts — all with visual clarity.
🔍 Key Features:
✅ Momentum + Price Action Based Trend Detection
✅ Dynamic ATR Trailing Stop Line
✅ Real-Time Reversal Arrows and Diamond Alerts
✅ Optimized CandleTrack color theme (Green = Demand, Red = Supply)
✅ Fully customizable inputs
🧠 Why Use It?
Capture trends early with momentum-driven logic
Use trailing stops for exit strategy or re-entry zones
Stay on the right side of the market with visual confirmation
⚙️ Inputs:
EMA Period (for directional bias)
ATR Period (for volatility-based trailing stops)
Factor (stop distance control)
⚠️ Disclaimer:
This indicator is for educational and informational purposes only and should not be considered financial advice. Trading involves risk, and past performance does not guarantee future results. Always do your own research and consult with a licensed financial advisor before making any trading decisions. The creator of this script is not responsible for any financial losses incurred through the use of this tool.
CandleTrack Pro | Pure Price Action Trend Detection CandleTrack Pro | Pure Price Action Trend Detection with Smart Candle Coloring
📝 Description:
CandleTrack Pro is a clean, lightweight trend-detection tool that uses only candle structure and ATR-based logic to determine market direction — no indicators, no overlays, just pure price action.
🔍 Features:
✅ Smart Candle-Based Trend Detection
Uses dynamic ATR thresholds to identify trend shifts with precision.
✅ Doji Protection Logic
Automatically filters indecision candles to avoid whipsaws and false signals.
✅ Dynamic Bull/Bear Color Coding
Bullish candles are colored green, bearish candles are colored red — see the trend instantly.
✅ No Noise, No Lag
No moving averages, no smoothing — just real-time decision-making power based on price itself.
📈 Ideal For:
Price action purists
Scalpers and intraday traders
Swing traders looking for clear visual bias
─────────────────────────────────────────────────────────────
Disclaimer:
This indicator is provided for educational and informational purposes only and should not be considered as financial or investment advice. The tool is designed to assist with technical analysis, but it does not guarantee any specific results or outcomes. All trading and investment decisions are made at your own risk. Past performance is not indicative of future results. Always do your own research and consult with a qualified financial advisor before making any trading decisions. The author accepts no liability for any losses or damages resulting from the use of this script. By using this indicator, you acknowledge and accept these terms.
───────────────────────────────────────────────────

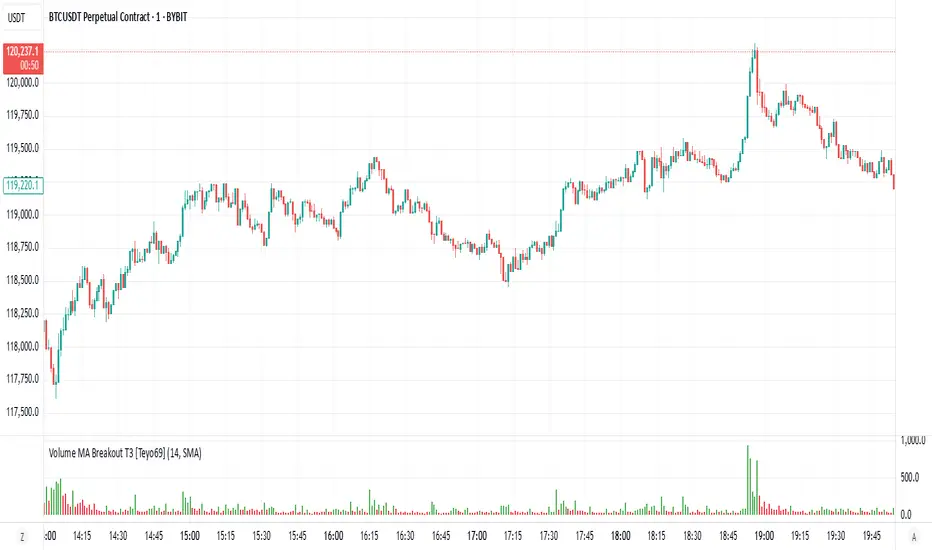
Volume MA Breakout T3 [Teyo69]🧭 Overview
Volume MA Breakout T3 highlights volume bars that exceed a dynamic moving average threshold. It helps traders visually identify volume breakouts—periods of significant buying or selling pressure—based on user-selected MA methods (SMA, EMA, DEMA).
🔍 Features
Volume Highlighting: Green bars indicate volume breakout above the MA; red bars otherwise.
Custom MA Options: Choose between SMA, EMA, or Double EMA for volume smoothing.
Dynamic Threshold: The moving average line adjusts based on user-defined length and method.
⚙️ Configuration
Length: Number of bars used for the moving average calculation (default: 14).
Method: Type of moving average to use:
"SMA" - Simple Moving Average
"EMA" - Exponential Moving Average
"Double EMA" - Double Exponential Moving Average
📈 How to Use
Apply to any chart to visualize volume behavior relative to its MA.
Look for green bars: These suggest volume is breaking out above its recent average—potential signal of momentum.
Red bars indicate normal/subdued volume.
⚠️ Limitations
Does not provide directional bias—use with price action or trend confirmation tools.
Works best with additional context (e.g., support/resistance, candle formations).
🧠 Advanced Tips
Use shorter MAs (e.g., 5–10) in volatile markets for more responsive signals.
Combine with OBV, MFI, or accumulation indicators for confluence.
📌 Notes
This is a volume-based filter, not a signal generator.
Useful for breakout traders and volume profile enthusiasts.
📜 Disclaimer
This script is for educational purposes only. Always test in a simulated environment before live trading. Not financial advice.
Persistent 1H S/R Zones with Labels (No Overlap) + 50 EMAit helps find recant support and resistance zones with swing points

Persistent Daily & 4H S/R Zones with Labels + 50 EMAit helps find swing high and lows support and ressistsance
