Indicators and strategies
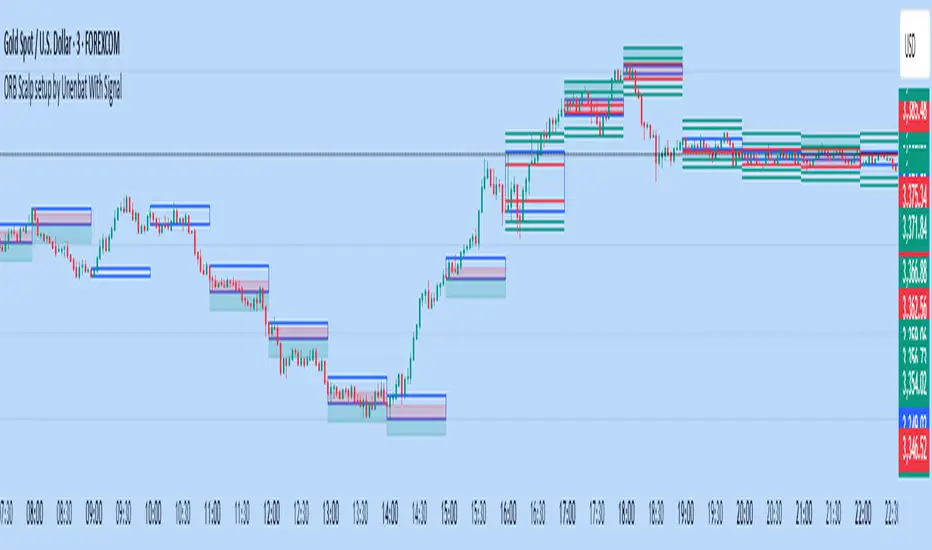
ORB Scalp setup by Unenbat With Signal**ORB Scalp Setup by Unenbat with Signal**
This indicator visualizes a custom Opening Range Breakout (ORB) strategy using a 6-minute range split across the end of one hour and the start of the next. It identifies two key trade setups using 1-hour candles:
* **Reverse Signals:** Triggered when the second 1H candle breaks the previous high/low but closes back inside, signaling a reversal.
* **Continuation Signals:** Triggered when the second 1H candle breaks and closes beyond the previous candle’s range, confirming trend continuation.
SL/TP zones are plotted accordingly, with optional fill coloring. No trades are displayed during "inside bars" or "manipulation" candles.
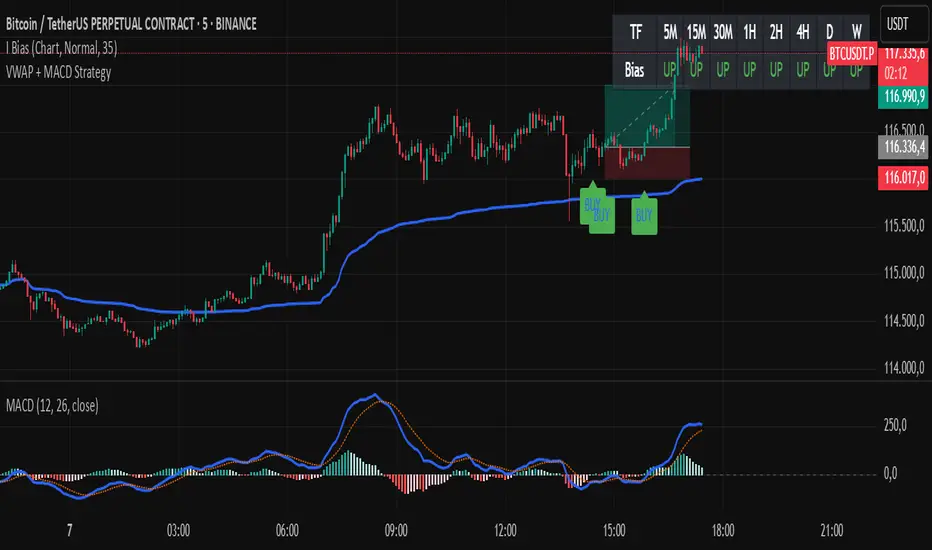
VWAP + MACD Estrategia MilloVWAP + MACD Strategy
This indicator combines the VWAP (Volume Weighted Average Price) with MACD (Moving Average Convergence Divergence) to create buy and sell signals. It helps traders identify potential market entry and exit points based on price action and momentum.
Conditions for Buy:
The price must be above the VWAP.
The MACD line crosses above the signal line (bullish crossover).
The MACD line is below the zero line.
Conditions for Sell:
The price must be below the VWAP.
The MACD line crosses below the signal line (bearish crossover).
The MACD line is above the zero line.
Features:
The VWAP line is plotted to represent the average price, weighted by volume, over a specified period.
Buy signals appear when all conditions are met for an upward price movement.
Sell signals appear when all conditions are met for a downward price movement.
MACD and Signal Line: The MACD helps to confirm momentum, while the signal line indicates possible trend reversals.
Customizable: You can modify the VWAP and MACD parameters to suit different trading strategies.
This strategy is designed for intraday traders and scalpers, aiming to catch quick movements while being aware of market momentum.
Feel free to share this description along with the code! Let me know if you need any adjustments or further explanations.
SD Bands Filtered Signals### SD Bands Filtered Signals: Reversion & Volatility Scanner
**Core Description:**
The SD Bands Filtered Signals is a tool developed to help traders identify more accurate buy and sell signals in sideways markets, or during periods of low price movement. It utilizes the principles of Standard Deviation (SD) and a Moving Average (MA), with a unique 'signal filtering' system added to reduce unnecessary noise.
**Key Features:**
* **SD Bands:** Creates upper and lower bands to define price volatility zones, providing a clear overview of market conditions.
* **Intelligent Reversal Signals:** Generates specially filtered Buy/Sell signals for a 'Reversion to the Mean' strategy. These signals appear only when the market has low volatility and the price touches the SD Bands.
* **Advanced Signal Filtering System:** Uses a **`Cooldown Bars`** variable to set a rest period between signals. This prevents repetitive arrows in the same zone, helping you find the best signal at the most suitable point.
* **Fully Customizable:** You can adjust the **`Length`**, **`Multiplier`**, **`Sideways Threshold`**, and **`Cooldown Bars`** to fit your trading style and asset of choice.
**How to Use:**
* **Buy Signal (Green Arrow Up):** Look for this signal when the market is sideways and the price moves down to touch the lower band (SD Low).
* **Sell Signal (Red Arrow Down):** Look for this signal when the market is sideways and the price moves up to touch the upper band (SD High).
* **Customization:** You can adjust the **`Cooldown Bars`** value to control the number of arrows. If you want more accurate but fewer signals, increase this value.
**Disclaimer:**
* This indicator is an **analytical tool only** and is not a 100% guarantee of profit.
* It should be used in conjunction with other forms of analysis, such as candlestick patterns, trading volume, and proper risk management.
ไทย
ชื่ออินดิเคเตอร์ "SD Bands Filtered Signals: Reversion & Volatility Scanner"
คำอธิบายหลัก:
อินดิเคเตอร์ SD Bands Filtered Signals เป็นเครื่องมือที่ถูกพัฒนาขึ้นเพื่อช่วยให้นักเทรดสามารถระบุสัญญาณซื้อ (Buy) และขาย (Sell) ที่แม่นยำขึ้นในตลาดแบบ Sideways หรือช่วงที่ราคาเคลื่อนที่ในกรอบแคบๆ โดยใช้หลักการของ Standard Deviation (SD) และ Moving Average (MA) และเพิ่มระบบ 'กรองสัญญาณ' ที่เป็นเอกลักษณ์เพื่อลดสัญญาณรบกวน (Noise) ที่ไม่จำเป็นออกไป
คุณสมบัติเด่น:
* SD Bands: สร้างเส้นขอบบนและล่างเพื่อระบุโซนความผันผวนของราคา ทำให้เห็นภาพรวมของตลาดได้ง่าย
* สัญญาณ Reversal อัจฉริยะ: สร้างสัญญาณ Buy/Sell ที่ถูกคัดกรองมาเป็นพิเศษสำหรับกลยุทธ์การกลับตัว (Reversion to the Mean) โดยจะปรากฏเฉพาะเมื่อตลาดมีความผันผวนต่ำและราคาแตะขอบของ SD Bands
* ระบบกรองสัญญาณขั้นสูง: ใช้ตัวแปร Cooldown Bars เพื่อกำหนดระยะเวลาพักสัญญาณ ทำให้ไม่เกิดลูกศรซ้ำๆ ในโซนเดียวกัน และช่วยให้คุณได้สัญญาณที่ดีที่สุดในจุดที่เหมาะสมที่สุด
* ปรับแต่งได้เต็มที่: คุณสามารถปรับค่า Length, Multiplier, Sideways Threshold และ Cooldown Bars เพื่อให้เข้ากับสไตล์การเทรดและคู่สินทรัพย์ที่คุณสนใจ
วิธีการใช้งาน:
* สัญญาณ Buy (ลูกศรสีเขียวขึ้น): มองหาสัญญาณนี้เมื่อตลาดอยู่ในช่วง Sideways และราคาวิ่งลงมาแตะเส้นขอบล่าง (SD Low)
* สัญญาณ Sell (ลูกศรสีแดงลง): มองหาสัญญาณนี้เมื่อตลาดอยู่ในช่วง Sideways และราคาวิ่งขึ้นไปแตะเส้นขอบบน (SD High)
* การปรับแต่ง: คุณสามารถปรับค่า Cooldown Bars เพื่อให้ได้จำนวนลูกศรที่ต้องการ หากต้องการสัญญาณที่แม่นยำขึ้นแต่จำนวนน้อยลง ให้เพิ่มค่านี้ให้สูงขึ้น
ข้อควรระวัง:
* อินดิเคเตอร์นี้เป็นเพียงเครื่องมือวิเคราะห์ ไม่ใช่สัญญาณที่การันตีผลกำไร 100%
* ควรใช้ประกอบกับการวิเคราะห์อื่นๆ เช่น รูปแบบแท่งเทียน, ปริมาณการซื้อขาย (Volume) และการจัดการความเสี่ยงที่เหมาะสม

Crypto Trend Master Pro + Hull Trend (MARK804 Enhanced)Strategy Overview: Crypto Trend Master Pro + Hull Signals
Strategy Essence
This script merges multi-dimensional trend analysis by blending EMA-ATR trend filters with the precision of Hull Moving Averages. Focused solely on arrow-based trade signals, it delivers clean, high-conviction entries via fortified dual confirmation logic—all while maintaining a minimalist aesthetic for traders who prize clarity.
Key Components & Design Philosophy
Dual Confirmation Structure
Only triggers a BUY arrow when both the EMA-ATR slope indicates bullishness and the Hull MA confirms upward momentum. Similarly, a SELL arrow appears only when both bearish signals align—filtering noise and reinforcing signal conviction.
Hull MA Variant Flexibility
Traders can toggle between HMA, EHMA, or THMA versions of the Hull MA, calibrating the balance between responsiveness and smoothing based on preference and timeframe.
Minimalist Visual Interface
Discrete arrow shapes—green for BUY, red for SELL—appear directly on the chart, delivering precise signal points with no extraneous labeling or clutter.
Alert-Ready for Seamless Automation
Each signal format (BUY/SELL) is natively benchmarked with alertcondition, enabling seamless integration into automated workflows or notification systems.
Clean Code Architecture
Structured around strong boolean logic (longSignal, shortSignal), the script remains efficient, readable, and straightforward to adapt or integrate into broader systems.
Pro-Level Considerations
Feature Advantage for Professional Traders
Dual Confirmation Boosts reliability by aligning trend filters
Hull Variant Options Tailors sensitivity to different market volatilities
Arrow-Only UI Keeps chart focused and minimizes visual distraction
Alert Compatibility Straightforward integration with alert/automation tools
Modular Design Supports expansion—add stop-loss, multi-timeframe logic
Community-Level Insight
As one seasoned user put it:
“If you're a pro, you know where repaint comes in and how to avoid it. You understand slippage and test on demo accounts regularly.”

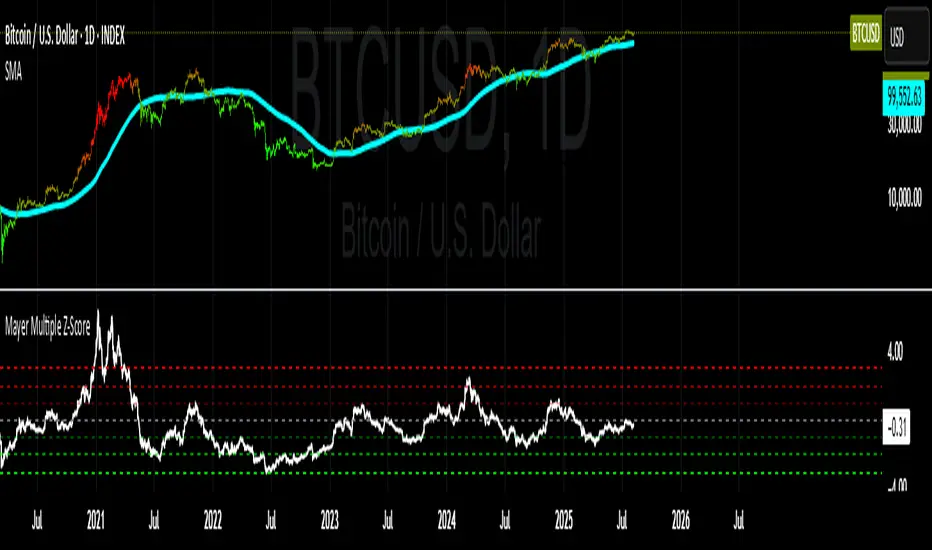
Mayer Multiple Z-ScoreMayer Multiple is a ratio between the current Market Price and its 200 days moving average.
Being a lagging indicator it shows periods of relative value for the asset but does not have much predictive power.
It is worth noting that the indicator relies on a fairly responsive moving average on the scale of a Bitcoin market cycle and as such may be best suited for the swing traders to find zones where price is overbought and oversold within a market cycle.
Added the Z-Score metric for easy classification of the value of Bitcoin according to this indicator. Customizable thresholds from Z-Score calculation as the metric suffers alpha decay / compression.
Created for TRW
VPOC ProgressivoThe Progressive VPOC is a dynamic volume-based tool designed to track the evolving Point of Control (POC) during live market activity. Unlike traditional session-based VPOCs, which reset at the start of each trading session, this indicator continuously calculates the price level with the highest traded volume over a custom rolling window (e.g., 30 or 50 candles), allowing traders to monitor shifts in volume concentration in real-time.
It helps identify:
Who is in control of the range: buyers or sellers.
Potential shifts in control: when the VPOC starts to climb or drop aggressively.
Hidden support/resistance levels that are not visible in price action alone.
Volume absorption zones, often useful for detecting institutional activity.
Perfect for volume-driven traders, Wyckoff practitioners, and anyone interested in the interplay between price and volume structure.

Martin Strategy - No Loss Exit v3Martin Strategy1.0 Martin Strategy1.0 Martin Strategy1.0 Martin Strategy1.0 Martin Strategy1.0 Martin Strategy1.0
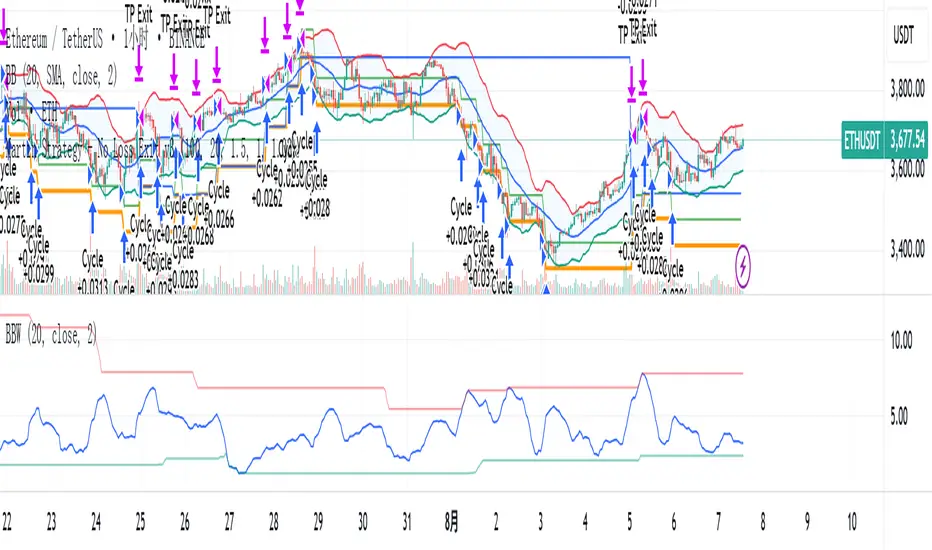

Hull Suite Strategy – 1% Risk, No SL/TP (MARK804) Hull Suite Strategy – 1% Risk, No SL/TP (MARK804): Pro-Level Overview
Strategic Philosophy
The Hull Suite Strategy MARK804 is a high-conviction trend-following model tailored for dynamic markets. By deploying three distinct Hull-based moving averages—**HMA**, **EHMA**, and **THMA**—it seeks to balance responsiveness, smoothness, and trend fidelity. The logic is elegantly simple yet potent: a trending edge is detected when the Hull average surpasses its value two bars prior, triggering directional entries and position reversals. Positioned at 1% of equity per trade, this strategy prioritizes controlled exposure while avoiding premature exits—no stop-loss or profit targets cloud the trend’s natural flow.
Core Differentiators
1. **Hull Variation Triage**
MARK804 allows selection among three Hull derivative calculations:
* **HMA**: High reactivity with minimal lag.
* **EHMA**: Damps noise for smoother entries.
* **THMA**: Adds confirmation through layered smoothing.
This modularity lets traders calibrate sensitivity versus resilience, depending on timeframe or volatility.
2. **Trend Validation Over Signal Chasing**
Instead of chasing price crossovers, the strategy confirms a trend only when the Hull value decisively eclipses its two-bar history—a subtle yet powerful twist that filters out false moves and only enters on structural shifts.
3. **Visual Clarity**
Trend confirmation is visually reinforced via color-coded Hull overlays—green for bullish momentum, red for bearish. Optionally, candles can be shaded to mirror the trend, ensuring intuitive and immediate market interpretation.
4. **Capital Discipline Without Premature Exits**
Restricting risk to 1% per trade underscores a disciplined portfolio approach. By omitting SL/TP layers, the strategy avoids forced exits, leaning instead on the Hull's reversal signal as the natural trigger for position closure—ideal for trends that persist beyond expected thresholds.
Professional Trading Implications
* **Trend Continuity Bias**: By staying in trades until a reversal is clearly signaled, MARK804 maximizes participation in extended moves rather than getting chopped out early.
* **Simplified Execution**: With one clear trigger (Hull crossing), operational complexity decreases—excellent for traders valuing clean systems or those operating in volatile, fast-moving assets.
* **Behavioral Edge**: Absence of emotional stop-loss feels—since decisions are based on an algorithmic switch—can support disciplined trading psychology.
Tactical Considerations
While this approach sacrifices some flexibility by foregoing SL/TP, it’s well-suited to high-timeframe trend strategies or volatile environments where exit points are often ambiguous. However, practitioners should remain cognizant that intense reversals may impose sizable drawdowns before reversal triggers surface.
---
Final Thoughts
MARK804 embodies a refined trend-following philosophy: tactical use of Hull variants, disciplined risk sizing, and trust in structural reversal logic—without cluttering strategies with exit orders and arbitrary thresholds. It's crafted for traders confident in letting trends unfold and disciplined enough to commit capital selectively.
Would you like me to extend this with real-world performance insights, SL/TP variants for comparative backtesting, or integration into alerts and dynamic position sizing frameworks?

Nse F&O LotThis is a simple indicator that displays the 1 NSE F&O lot size for the security. There is no display for securities that do not trade in futures.

JOSITOThis indicator marks equal points that XAU will go to reach; it doesn’t work on other pairs, but on XAU it is quite accurate.
Preguntar a ChatGPT

Cnagda Fixed Swingstrategy combines market structure (pivot S&R, anchored VWAP), momentum (EMA/WMA crosses), and volatility (ATR-based stop) to provide robust, adaptive trading signals.
It minimizes false entries using stateful logic and confirms swings using multi-factor conditions.

SMC de SmartProfit [ROMERR14]This all-in-one indicator displays real-time market structure (internal & swing BOS / CHoCH), order blocks, premium & discount zones, equal highs & lows, and much more...allowing traders to automatically mark up their charts with widely used price action methodologies. Following the release of our Fair Value Gap script, we received numerous requests from our community to release more features in the same category.
"Smart Money Concepts" (SMC) is a fairly new yet widely used term amongst price action traders looking to more accurately navigate liquidity & find more optimal points of interest in the market. Trying to determine where institutional market participants have orders placed (buy or sell side liquidity) can be a very reasonable approach to finding more practical entries & exits based on price action.
The indicator includes alerts for the presence of swing structures and many other relevant conditions.
Features
This indicator includes many features relevant to SMC, these are highlighted below:
Full internal & swing market structure labeling in real-time
Break of Structure (BOS)
Change of Character (CHoCH)
Order Blocks (bullish & bearish)
Equal Highs & Lows
Fair Value Gap Detection
Previous Highs & Lows
Premium & Discount Zones as a range
Options to style the indicator to more easily display these concepts
Settings
Mode: Allows the user to select Historical (default) or Present, which displays only recent data on the chart.
Style: Allows the user to select different styling for the entire indicator between Colored (default) and Monochrome.
Color Candles: Plots candles based on the internal & swing structures from within the indicator on the chart.
Internal Structure: Displays the internal structure labels & dashed lines to represent them. (BOS & CHoCH).
Confluence Filter: Filter non-significant internal structure breakouts.
Swing Structure: Displays the swing structure labels & solid lines on the chart (larger BOS & CHoCH labels).
Swing Points: Displays swing points labels on chart such as HH, HL, LH, LL.
Internal Order Blocks: Enables Internal Order Blocks & allows the user to select how many most recent Internal Order Blocks appear on the chart.
Swing Order Blocks: Enables Swing Order Blocks & allows the user to select how many most recent Swing Order Blocks appear on the chart.
Equal Highs & Lows: Displays EQH/EQL labels on chart for detecting equal highs & lows.
Bars Confirmation: Allows the user to select how many bars are needed to confirm an EQH/EQL symbol on chart.
Fair Value Gaps: Displays boxes to highlight imbalance areas on the chart.
Auto Threshold: Filter out non-significant fair value gaps.
Timeframe: Allows the user to select the timeframe for the Fair Value Gap detection.
Extend FVG: Allows the user to choose how many bars to extend the Fair Value Gap boxes on the chart.
Highs & Lows MTF: Allows the user to display previous highs & lows from daily, weekly, & monthly timeframes as significant levels.
Premium/Discount Zones: Allows the user to display Premium, Discount, and Equilibrium zones on the chart
Usage
imagen
Users can see automatic CHoCH and BOS labels to highlight breakouts of market structure, which allows to determine the market trend. In the chart below we can see the internal structure which displays more frequent labels within larger structures. We can also see equal highs & lows (EQH/EQL) labels plotted alongside the internal structure to frequently give indications of potential reversals.
imagen
In the chart below we can see the swing market structure labels. These are also labeled as BOS and CHoCH but with a solid line & larger text to show larger market structure breakouts & trend reversals. Users can be mindful of these larger structure labels while trading internal structures as displayed in the previous chart.
imagen
Order blocks highlight areas where institutional market participants open positions, one can use order blocks to determine confirmation entries or potential targets as we can expect there is a large amount of liquidity at these order blocks. In the chart below we can see 2 potential trade setups with confirmation entries. The path outlined in red would be a potential short entry targeting the blue order block below, and the path outlined in green would be a potential long entry, targeting the red order blocks above.
imagen
As we can see in the chart below, the bullish confirmation entry played out in this scenario with the green path outlined in hindsight. As price breaks though the order blocks above, the indicator will consider them mitigated causing them to disappear, and as per the logic of these order blocks they will always display 5 (by default) on the chart so we can now see more actionable levels.
imagen
The Smart Money Concepts indicator has many other features and here we can see how they can also help a user find potential levels for price action trading. In the screenshot below we can see a trade setup using the Previous Monthly High, Strong High, and a Swing Order Block as a stop loss. Accompanied by the Premium from the Discount/Premium zones feature being used as a potential entry. A potential take profit level for this trade setup that a user could easily identify would be the 50% mark labeled with the Fair Value Gap & the Equilibrium all displayed automatically by the indicator.
imagen
Conclusion
This indicator highlights all relevant components of Smart Money Concepts which can be a very useful interpretation of market structure, liquidity, & more simply put, price action. The term was coined & popularized primarily within the forex community & by ICT while making its way to become a part of many traders' analysis. These concepts, with or without this indicator do not guarantee a trader to be trading within the presence of institutional or "bank-level" liquidity, there is no supporting data regarding the validity of these teachings.
11 oct 2022
Notas de prensa
- Fixed array.get errors when enabling Order Blocks
- Fixed max_bars_back error when enabling Previous Highs/Lows
- Added Order Block Filter setting with 2 methods allowing users to filter out volatile Order Blocks.
- Added borders to Internal Order Blocks
- Minor changes
24 oct 2022
Notas de prensa
- Fixed order block alert not alerting on break
- Fixed order block not being deleted when broken
- Minor changes
9 feb 2023
Notas de prensa
- Added "Label Size" setting to increase size on internal market structure, swing market structure, and EQH/EQL labels.
- Minor changes
5 sept 2024
Notas de prensa
- Improved script performance
- Enhanced detection capabilities for structures, order blocks, fair value gaps, and equal highs and lows
- Monochrome style can be applied to fair value gaps and premium/discount zones.
- The correct style has now been applied to the MTF highs and lows levels
- Minor changes
10 sept 2024
Notas de prensa
- Fixed previous high/low causing errors on low timeframes
- Minor changes
Script de código abierto
Siguiendo fielmente el espíritu de TradingView, el creador de este script lo ha publicado en código abierto, permitiendo que otros traders puedan revisar y verificar su funcionalidad. ¡Enhorabuena al autor! Puede utilizarlo de forma gratuita, pero tenga en cuenta que la publicación de este código está sujeta a nuestras Normas internas.
LuxAlgo
Siguiendo
Get access to our exclusive tools: luxalgo.com
Join our 150k+ community: discord.gg/lux
All content provided by LuxAlgo is for informational & educational purposes only. Past performance does not guarantee future results.
También en:
Exención de responsabilidad
La información y las publicaciones que ofrecemos, no implican ni constituyen un asesoramiento financiero, ni de inversión, trading o cualquier otro tipo de consejo o recomendación emitida o respaldada por TradingView. Puede obtener información adicional en las Condiciones de uso.

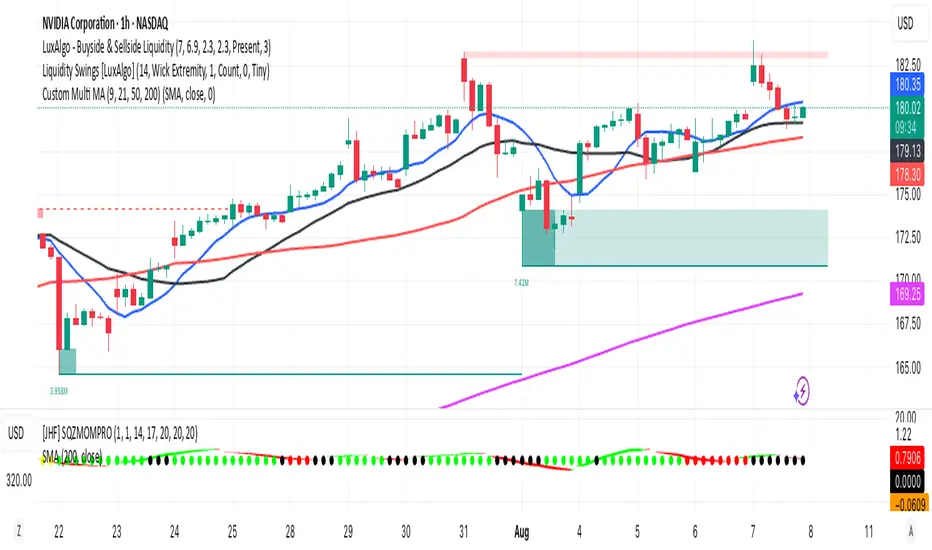
Multi MA (9, 21, 50, 200)This indicator plots four commonly used moving averages — 9, 21, 50, and 200 — with customizable smoothing methods and color-coded lines optimized for visibility on any chart background.
Intraday Time Cycle Levels (Labels + Alerts + Colors)Jag japp detta spelet fram och tbx.
Tack för ert förtoende.

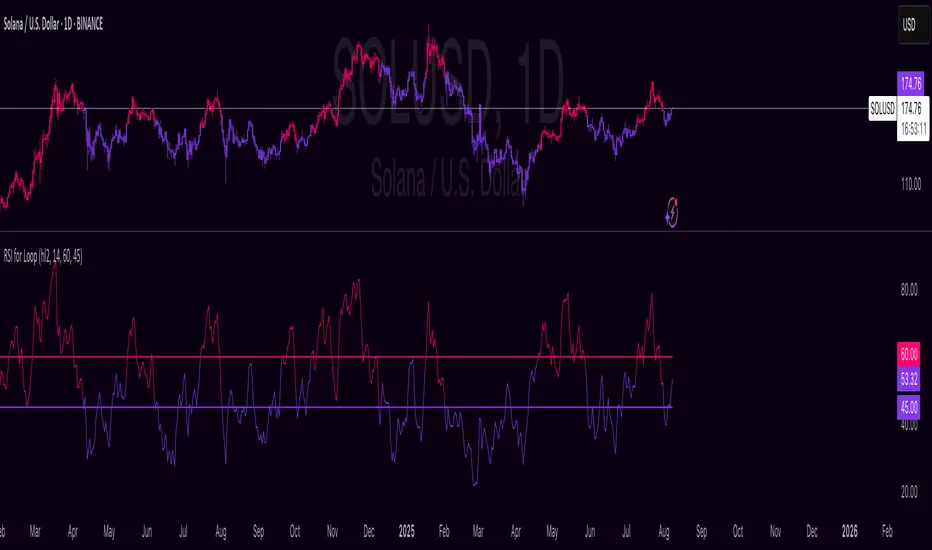
Premier Stochastic Oscillator with z-scorePremier Stochastic Oscillator with Z‑Score
This enhanced version of the Premier Stochastic Oscillator (by LazyBear) adds a Z‑Score overlay to highlight overbought and oversold conditions more intuitively:
Base oscillator uses smoothed stochastics and exponential scaling for clean momentum readings.
The custom Z‑Score transforms key stoch values into standardized levels:
0 → Z = 0
±0.4 → Z = ∓1
±0.8 → Z = ∓2
±1.2 → Z = ∓3
The Z‑Score is plotted as a blue line, making extreme conditions and mean reversion signals easy to spot.
All parameters (lengths, scaling, smoothing) are fully customizable.
Use this tool to visually track momentum exhaustion and potential reversals based on clearly defined Z‑Score thresholds.

Filtro Antirumore Ottimizzato by G.I.N.e TradingNoise Filter – Adaptive Version for Bund & DAX by G.I.N.e Trading
The Noise Filter is a market condition tool designed to help traders avoid false signals by identifying sideways or low-quality trading phases. This version has been specifically optimized to work effectively with both Bund and DAX price action behaviors.
⚙️ How It Works
The indicator analyzes four key components to determine if the market is in a "noise zone" (sideways, low volatility, or weak trend):
Bollinger Band Width – Detects price compression.
ADX – Measures the strength of the trend.
ATR – Captures recent volatility.
HMA Slope – Evaluates directional movement (trend or no trend).
A noise zone is triggered if at least two out of three core conditions are met:
Narrow Bollinger Bands
ADX below threshold
ATR below threshold
And it is confirmed only if there is no clear directional slope in price.
A strong directional slope overrides the noise signal, allowing valid trends with low volatility (common in instruments like the Bund).
🎯 Visual Output
Gray column → Noise zone: avoid signals in this phase (low quality environment).
Yellow column → Operational zone: conditions are more favorable for trend-following systems.
🛠️ Fully Customizable
You can adjust:
Bollinger Band period & width threshold
ADX length & threshold
ATR period & threshold
HMA slope sensitivity
💡 Best For
Filtering false signals in automated or manual trading strategies
Enhancing trend-following accuracy
Adapting behavior to both high-volatility instruments (DAX) and low-volatility instruments (Bund)

Animal EnvironmentInfers based on topogrophy if you are more likely to encounter bears or bulls near.

Cumulative Volume Delta (SB-1) 2.0
📈 Cumulative Volume Delta (CVD) — Stair-Step + Threshold Alerts
🔍 Overview
This Cumulative Volume Delta (CVD) tool visualizes aggressive buying and selling pressure in the market by plotting candlestick-style bars based on volume delta. It helps traders understand which side — buyers or sellers — is exerting more control on lower timeframes and highlights momentum shifts through stair-step patterns and delta threshold breaks. Resets to zero at EOD
Ideal for futures traders, scalpers, and intraday strategists looking for orderflow-based confirmation.
🧠 What Is CVD?
CVD (Cumulative Volume Delta) measures the difference between market buys and sells over a specific timeframe. When the delta is rising, it suggests buyers are being more aggressive. Falling delta suggests seller dominance.
This script aggregates volume delta from a lower timeframe and plots it in a higher timeframe context, allowing you to track microstructure shifts within larger candles.
📊 Features
✅ CVD Candlesticks
Each bar represents volume delta as an OHLC-style candle using:
Open: Delta at the start of the bar
High/Low: Peak delta range
Close: Final delta value at bar close
Teal candles = Net buying pressure
Red candles = Net selling pressure
✅ Threshold Levels (Key Visual Zones)
The script includes horizontal dashed lines at:
+5,000 and +10,000 → Signify strong buying pressure
-5,000 and -10,000 → Signify strong selling pressure
0 line → Neutrality line (no net pressure)
These levels act as volume-based support/resistance zones and breakout confirmation tools. For example:
A CVD cross above +5,000 shows buyers taking control
A CVD cross above +10,000 implies strong bullish momentum
A CVD cross below -5,000 or -10,000 signals intense selling pressure
📈 Stair-Step Pattern Detection
Detects two specific volume-based continuation setups:
Bullish Stair-Step: Both the high and low of the CVD candle are higher than the previous candle
Bearish Stair-Step: Both the high and low of the CVD candle are lower than the previous candle
These patterns often appear during trending moves and serve as confirmation of strength or continuation.
Visual markers:
🟢 Green triangles below bars = Bullish stair-step
🔴 Red triangles above bars = Bearish stair-step
🔔 Alert Conditions
Get real-time alerts when:
Bullish Stair-Step is detected
Bearish Stair-Step is detected
CVD crosses above +5,000
CVD crosses below -5,000
📢 Alerts only trigger on crossover, not every time CVD remains above or below. This avoids repetitive notifications.
⚙️ Inputs & Customization
Anchor Timeframe: The higher timeframe to which CVD data is applied (default: 1D)
Lower Timeframe: The timeframe used to calculate the CVD delta (default: 5 minutes)
Optional Override: Use custom timeframe toggle to force your own micro timeframe
📌 How to Use This CVD Indicator (Step-by-Step Guide)
✅ 1. Confirm Bias Using the Zero Line
The zero line (0 CVD) represents neutral pressure — neither buyers nor sellers are dominating.
Use it as your first filter:
🔼 If CVD is above 0 and rising → Buyer control
🔽 If CVD is below 0 and falling → Seller control
🧠 Tip: CVD rising while price is consolidating may signal hidden buyer interest.
✅ 2. Watch for Crosses of Key Levels: +5,000 and +10,000
These levels act as momentum thresholds:
Level Signal Type What It Means
+5,000 Buyer breakout Buyers are starting to dominate
+10,000 Strong bull bias Strong institutional or algorithmic buying flow
-5,000 Seller breakout Sellers are taking control
-10,000 Strong bear bias Heavy selling pressure is entering the market
Wait for CVD to cross above +5K or below -5K to confirm the active side.
Use these crossovers as entry triggers, breakout confirmations, or trade filters.
🔔 Alerts fire only when the level is first crossed, not every bar above/below.
✅ 3. Use Stair-Step Patterns for Continuation Confirmation
The indicator shows stair-step patterns using triangle signals:
🟢 Green triangle below bar = Bullish stair-step
Suggests a higher high and higher low in delta → buyers stepping up
🔴 Red triangle above bar = Bearish stair-step
Suggests lower highs and lower lows in delta → selling pressure building
Use stair-step signals:
To confirm a continuation of trend
As an entry or add-on signal
Especially after a threshold breakout
🧠 Example: If CVD breaks above +5K and forms bullish stairs → confirms strong trend, ideal for momentum entries.
✅ 4. Combine with Price Action or Structure
CVD works best when used with price, not in isolation. For example:
📉 Price makes a new low but CVD doesn’t → potential bullish divergence
📈 CVD surges while price lags → buyers are absorbing, breakout likely
Use it with:
VWAP
Orderblocks
Liquidity sweeps
Break of market structure/MSS/BOS
✅ 5.
Set Anchor Timeframe = Daily
Set Lower Timeframe = 5 minutes (default)
This lets you:
See intraday flow inside daily bars
Confirm whether a daily candle is being built on net buying or selling
🧠 You’re essentially seeing intra-bar aggression within a bigger time structure.
🧭 Example Trading Setup
Bullish Scenario:
CVD is rising and above 0
CVD crosses above +5,000 → alert fires
Green stair-step appears
Price breaks local resistance or liquidity sweep completes
✅ Consider long entry with structure and CVD alignment
🎯 Place stops below last stair-step or structural low
📌 Final Notes
This tool does not repaint and is designed to work in real-time across all futures, crypto, and equity instruments that support volume data. If your symbol does not provide volume, the script will notify you.
Use it in confluence with VWAP, liquidity zones, or structure breaks for high-confidence trades.

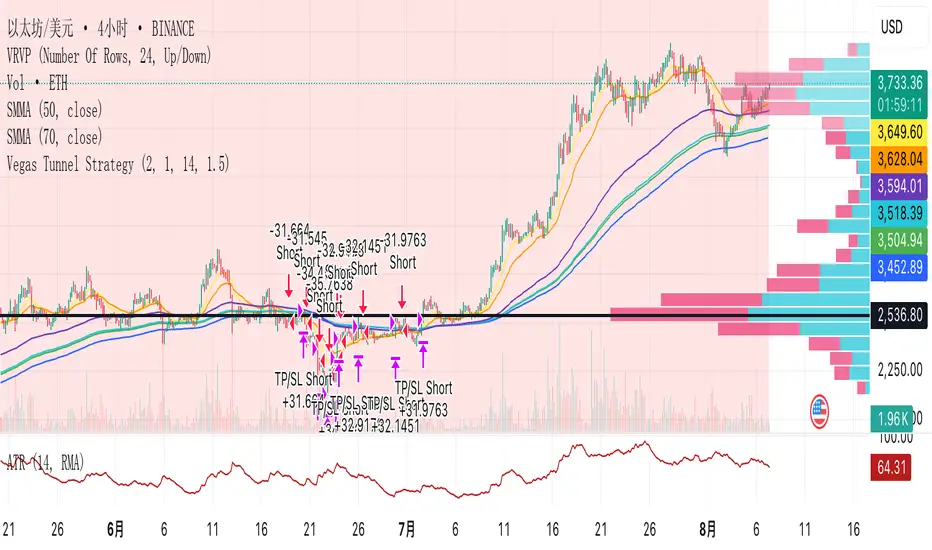
Vegas Tunnel StrategyVegas Tunnel Strategy is a trend-following breakout system based on exponential moving averages (EMAs). It uses a "tunnel" formed by the 144 EMA and 169 EMA to identify the market's long-term trend direction. Entry signals are generated when a shorter-term EMA (12 EMA) breaks above or below this tunnel, confirming momentum alignment.
Long Setup: Price and EMA12 are above the tunnel (EMA144 < EMA169); entry on pullback near the tunnel.
Short Setup: Price and EMA12 are below the tunnel (EMA144 > EMA169); entry on rebound near the tunnel.
Exit Rules: Fixed stop loss below/above the tunnel or based on ATR; take profit at 1.5–2× the risk.
This strategy works best on 4H or daily charts and is suitable for trending assets like FX pairs, gold, oil, or indices.