Momentum_EMABand📢 Reposting this script as the previous version was shut down due to house rules. Follow for future updates.
The Momentum EMA Band V1 is a precision-engineered trading indicator designed for intraday traders and scalpers. This first version integrates three powerful technical tools — EMA Bands, Supertrend, and ADX — to help identify directional breakouts while filtering out noise and choppy conditions.
How the Indicator Works – Combined Logic
This script blends distinct but complementary tools into a single, visually intuitive system:
1️⃣ EMA Price Band – Dynamic Zone Visualization
Plots upper and lower EMA bands (default: 9-period) to form a dynamic price zone.
Green Band: Price > Upper Band → Bullish strength
Red Band: Price < Lower Band → Bearish pressure
Yellow Band: Price within Band → Neutral/consolidation zone
2️⃣ Supertrend Overlay – Reliable Trend Confirmation
Based on customizable ATR length and multiplier, Supertrend adds a directional filter.
Green Line = Uptrend
Red Line = Downtrend
3️⃣ ADX-Based No-Trade Zone – Choppy Market Filter
Manually calculated ADX (default: 14) highlights weak trend conditions.
ADX below threshold (default: 20) + Price within Band → Gray background, signaling low-momentum zones.
Optional gray triangle marker flags beginning of sideways market.
Why This Mashup & How the Indicators Work Together
This mashup creates a high-conviction, rules-based breakout system:
Supertrend defines the primary trend direction — ensuring trades are aligned with momentum.
EMA Band provides structure and timing — confirming breakouts with retest logic, reducing false entries.
ADX measures trend strength — filtering out sideways markets and enhancing trade quality.
Each component plays a specific role:
✅ Supertrend = Trend bias
✅ EMA Band = Breakout + Retest validation
✅ ADX = Momentum confirmation
Together, they form a multi-layered confirmation model that reduces noise, avoids premature entries, and improves trade accuracy.
💡 Practical Application
Momentum Breakouts: Enter when price breaks out of EMA Band with Supertrend confirmation
Avoid Whipsaws: Skip trades during gray-shaded low-momentum periods
Intraday Scalping Edge: Tailored for lower timeframes (5min–15min) where noise is frequent
⚠️ Important Disclaimer
This is Version 1 — expect future enhancements based on trader feedback.
This tool is for educational purposes only. No indicator guarantees profitability. Use with proper risk management and strategy validation.
Indicators and strategies

CRS by TQCRS by TradeQUO
Comparative Relative Strength Indicator
What it does
Computes the percentage difference in performance between your current chart symbol (e.g. GC1!) and a chosen benchmark (e.g. ES1!, DXY, NQ1!).
Smooths that “CRS” line with a configurable moving average (SMA, EMA, WMA) — default length is 63 bars.
Key Plots
CRS (%) (aqua) — how your symbol has held up relative to the benchmark since the chart loaded.
CRS MA (%) (fuchsia) — smoothed trend of that relative strength.
How to Interpret
Trend-Following
Long when CRS crosses above its MA and is above 0 → your symbol is outperforming.
Short (or reverse) when CRS crosses below its MA and is below 0 → underperformance.
Regime Filter
CRS > 0 → Risk-On environment for your symbol vs. benchmark.
CRS < 0 → Risk-Off relative to the benchmark.
Divergence Signals
Bearish Divergence: Price makes a higher high, but CRS makes a lower high → potential sell-off incoming.
Bullish Divergence: Price makes a lower low, but CRS makes a higher low → look for rebound opportunity.
Pairs Trading
Outperformance: Long your symbol + Short benchmark when CRS > MA.
Underperformance: Short your symbol + Long benchmark when CRS < MA.
Why it matters
Reveals relative market leadership early, not just absolute price moves.
Helps you allocate risk dynamically, spot rotations and catch reversals before they show in price alone.

Overheat Oscillator with DivergenceIndicator Description
The Overheat Oscillator with Divergence is an advanced technical indicator designed for the TradingView platform, assisting traders in identifying potential market reversal points by analyzing price momentum and volume, as well as detecting divergences. The indicator combines trend strength assessment with signal smoothing to provide clear indications of market overheat or oversold conditions. An optional divergence detection feature allows for the identification of discrepancies between price movement and the oscillator's value, which may signal upcoming trend changes.
The indicator is displayed in a separate panel below the price chart and offers visual cues through a color gradient, horizontal reference lines, and a dynamic market sentiment table. Users can customize numerous parameters, such as calculation periods, sentiment thresholds, line colors, and visualization styles, making the indicator a versatile tool for various trading strategies.
How the Indicator Works
The indicator is based on the following key components:
Oscillator Calculations
The indicator analyzes price candles, assigning a score based on their nature. A bullish candle (when the closing price is higher than the opening price) receives a score of +1.0, while a bearish candle (when the closing price is lower than the opening price) receives a score of -1.0. This scoring reflects the strength of price movement over a given period.
The score is modified by a volume multiplier (default: 2.0) if the candle's volume exceeds the volume's simple moving average (SMA, default: calculated over 20 candles). This ensures that candles with higher volume have a greater impact on the oscillator's value, better capturing significant market movements driven by increased trading activity. For example, a bullish candle with high volume may receive a score of +2.0 instead of +1.0, amplifying the bullish signal.
The scores are summed over a specified number of candles (default: 20), normalized to a 0–100 range, and then smoothed using a simple moving average (SMA, default: 5 periods) to reduce noise and improve signal clarity.
Color Gradient
The oscillator's values are visualized using a color gradient that changes based on the oscillator's level:
Green: Market cooldown (values below the Gradient Min threshold).
Yellow: Neutral sentiment (values between Gradient Min and Gradient Yellow).
Orange: Elevated activity (values between Gradient Yellow and Gradient Orange).
Red: Market overheat (values above Gradient Orange).
The color gradient is applied as the background in the oscillator panel, facilitating quick assessment of market sentiment.
Reference Levels
The indicator displays customizable horizontal lines for key thresholds (e.g., Overheat Threshold, Oversold Threshold, Gradient Min, Yellow, Orange, Max). These lines are visible only at the height of the last few oscillator candles, preventing chart clutter and helping users focus on current values.
Users can also define three custom horizontal lines with selectable styles (solid, dotted, dashed) and colors. These lines serve as auxiliary tools, e.g., for marking personal support/resistance levels, but do not affect the oscillator's signals or background colors.
Market Sentiment
The indicator displays sentiment labels in a table located in the top-right corner of the panel, dynamically updating based on the oscillator's value:
Cooled: Values below Gradient Yellow (default: 35).
Neutral: Values between Gradient Yellow and Gradient Orange (default: 60).
Excited: Values between Gradient Orange and Overheat Threshold (default: 70).
Overheated: Values above Overheat Threshold (default: 70).
The Overheat Threshold and Oversold Threshold are critical for displaying the "Overheated" and "Cooled" labels in the sentiment table, enabling users to quickly identify extreme market conditions. The labels update when key thresholds are crossed, and their colors match the oscillator's gradient.
Divergence Detection
The indicator offers optional detection of regular bullish and bearish divergences:
Bullish Divergence: Occurs when the price forms a lower low, but the oscillator forms a higher low, suggesting a weakening downtrend.
Bearish Divergence: Occurs when the price forms a higher high, but the oscillator forms a lower high, suggesting a weakening uptrend.
Divergences are marked on the chart with labels ("Bull" for bullish, "Bear" for bearish) and lines indicating pivot points. They are calculated with a delay equal to the Lookback Right setting (default: 5 candles), meaning signals appear after pivot confirmation in the specified lookback period. The indicator also generates alerts for users when a divergence is detected.
Indicator Settings
Main Settings (SETTINGS)
Period Length: Specifies the number of candles used for oscillator calculations (default: 20).
Volume SMA Period: The period for the volume's simple moving average (default: 20).
Volume Multiplier: Multiplier applied to candle scores when volume exceeds the average (default: 2.0).
SMA Length: The period for smoothing the oscillator with a simple moving average (default: 5).
Thresholds (THRESHOLDS)
Overheat Threshold: Level indicating market overheat (default: 70). This value determines when the sentiment table displays the "Overheated" label, signaling a potential peak in an uptrend.
Oversold Threshold: Level indicating market cooldown (default: 30). This value determines when the sentiment table displays the "Cooled" label, signaling a potential bottom in a downtrend.
Gradient Min (Green): Lower threshold for the green gradient (default: 20).
Gradient Yellow Threshold: Threshold for the yellow gradient (default: 35).
Gradient Orange Threshold: Threshold for the orange gradient (default: 60).
Gradient Max (Red): Upper threshold for the red gradient (default: 70).
Visualization (VISUALIZATION)
Signal Line Color: Color of the oscillator line (default: dark red, RGB(5, 0, 0)).
Show Reference Lines: Enables/disables the display of threshold lines (default: enabled).
Divergence Settings (DIVERGENCE SETTINGS)
Calculate Divergence: Enables/disables divergence detection (default: disabled).
Lookback Right: Number of candles back for pivot analysis (default: 5).
Lookback Left: Number of candles to the left for pivot analysis (default: 5).
Line Style (STYLE)
Custom Line 1, 2, 3 Value: Levels for custom horizontal lines (default: 70, 50, 30).
Custom Line 1, 2, 3 Color: Colors for custom lines (default: black, RGB(0, 0, 0)).
Custom Line 1, 2, 3 Style: Line styles (solid, dotted, dashed; default: dashed, dotted, dashed).
How to Use the Indicator
Adding to the Chart
Add the indicator to your TradingView chart by searching for "Overheat Oscillator with Divergence."
Configure the settings according to your trading strategy.
Signal Interpretation
Overheated: Values above the Overheat Threshold (default: 70) in the sentiment table may indicate a potential uptrend peak.
Cooled: Values below the Oversold Threshold (default: 30) in the sentiment table may suggest a potential downtrend bottom.
Divergences:
Bullish: Look for "Bull" labels on the chart, indicating potential upward reversals (calculated with a Lookback Right delay).
Bearish: Look for "Bear" labels, indicating potential downward reversals (calculated with a Lookback Right delay).
Customization
Experiment with settings such as period length, volume multiplier, or gradient thresholds to tailor the indicator to your trading style (e.g., scalping, medium-term trading).
Usage Examples
Scalping: Set a shorter period (e.g., Period Length = 10, SMA Length = 3) and monitor rapid sentiment changes and divergences on lower timeframes (e.g., 5-minute charts).
Medium-Term Trading: Use default settings or increase Period Length (e.g., 30) and SMA Length (e.g., 7) for more stable signals on hourly or daily charts.
Reversal Detection: Enable divergence detection and observe "Bull" or "Bear" labels in conjunction with overheat/cooled levels in the sentiment table.
Notes
The indicator performs best when used in conjunction with other technical analysis tools, such as support/resistance lines, moving averages, or Fibonacci levels.
Divergences may serve as early signals but do not always guarantee immediate trend reversals—confirmation with other indicators is recommended.
Test different settings on historical data to find the optimal configuration for your chosen market and timeframe.

VWAP Volume Profile [BigBeluga]🔵 OVERVIEW
VWAP Volume Profile is an advanced hybrid of the VWAP and volume profile concepts. It visualizes how volume accumulates relative to VWAP movement—separating rising (+VWAP) and declining (−VWAP) activity into two mirrored horizontal profiles. It highlights the dominant price bins (POCs) where volume peaked during each directional phase, helping traders spot hidden accumulation or distribution zones.
🔵 CONCEPTS
VWAP-Driven Profiling: Unlike standard volume profiles, this tool segments volume based on VWAP movement—accumulating positive or negative volume depending on VWAP slope.
Dual-Sided Profiles: Profiles expand horizontally to the right of price. Separate bins show rising (+) and falling (−) VWAP volume.
Bin Logic: Volume is accumulated into defined horizontal bins based on VWAP’s position relative to price ranges.
Gradient Coloring: Volume bars are colored with a dynamic gradient to emphasize intensity and direction.
POC Highlighting: The highest-volume bin in each profile type (+/-) is marked with a transparent box and label.
Contextual VWAP Line: VWAP is plotted and dynamically colored (green = rising, orange = falling) for instant trend context.
Candle Overlay: Price candles are recolored to match the VWAP slope for full visual integration.
🔵 FEATURES
Dual-sided horizontal volume profiles based on VWAP slope.
Supports rising VWAP , falling VWAP , or both simultaneously.
Customizable number of bins and lookback period.
Dynamically colored VWAP line to show rising/falling bias.
POC detection and labeling with volume values for +VWAP and −VWAP.
Candlesticks are recolored to match VWAP bias for intuitive momentum tracking.
Optional background boxes with customizable styling.
Adaptive volume scaling to normalize bar length across markets.
🔵 HOW TO USE
Use POC zones to identify high-volume consolidation areas and potential support/resistance levels.
Watch for shifts in VWAP direction and observe how volume builds differently during uptrends and downtrends.
Use the gradient profile shape to detect accumulation (widening volume below price) or distribution (above price).
Use candle coloring for real-time confirmation of VWAP bias.
Adjust the profile period or bin count to fit your trading style (e.g., intraday scalping or swing trading).
🔵 CONCLUSION
VWAP Volume Profile merges two essential concepts—volume and VWAP—into a single, high-precision tool. By visualizing how volume behaves in relation to VWAP movement, it uncovers hidden dynamics often missed by traditional profiles. Perfect for intraday and swing traders who want a more nuanced read on market structure, trend strength, and volume flow.

Advanced Correlation Monitor📊 Advanced Correlation Monitor - Pine Script v6
🎯 What does this indicator do?
Monitors real-time correlations between 13 different asset pairs and alerts you when historically strong correlations break, indicating potential trading opportunities or changes in market dynamics.
🚀 Key Features
✨ Multi-Market Monitoring
7 Forex Pairs (GBPUSD/DXY, EURUSD/GBPUSD, etc.)
6 Index/Stock Pairs (SPY/S&P500, DAX/NASDAQ, TSLA/NVDA, etc.)
Fully configurable - change any pair from inputs
📈 Dual Correlation Analysis
Long Period (90 bars): Identifies historically strong correlations
Short Period (6 bars): Detects recent breakdowns
Pearson Correlation using Pine Script v6 native functions
🎨 Intuitive Visualization
Real-time table with 6 information columns
Color coding: Green (correlated), Red (broken), Gray (normal)
Visual states: 🟢 OK, 🔴 BROKEN, ⚫ NORMAL
🚨 Smart Alert System
Only alerts previously correlated pairs (>80% historical)
Detects breakdowns when short correlation <80%
Consolidated alert with all affected pairs
🛠️ Flexible Configuration
Adjustable Parameters:
📅 Periods: Long (30-500), Short (2-50)
🎯 Threshold: 50%-99% (default 80%)
🎨 Table: Configurable position and size
📊 Symbols: All pairs are configurable
Default Pairs:
FOREX: INDICES/STOCKS:
- GBPUSD vs DXY • SPY vs S&P500
- EURUSD vs GBPUSD • DAX vs S&P500
- EURUSD vs DXY • DAX vs NASDAQ
- USDCHF vs DXY • TSLA vs NVDA
- GBPUSD vs USDCHF • MSFT vs NVDA
- EURUSD vs USDCHF • AAPL vs NVDA
- EURUSD vs EURCAD
💡 Practical Use Cases
🔄 Pairs Trading
Detects when strong correlations break for:
Statistical arbitrage
Mean reversion trading
Divergence opportunities
🛡️ Risk Management
Identifies when "safe" assets start moving independently:
Portfolio diversification
Smart hedging
Regime change detection
📊 Market Analysis
Understand underlying market structure:
Forex/DXY correlations
Tech sector rotation
Regional market disconnection
🎓 Results Interpretation
Reading Example:
EURUSD vs DXY: -98.57% → -98.27% | 🟢 OK
└─ Perfect negative correlation maintained (EUR rises when DXY falls)
TSLA vs NVDA: 78.12% → 0% | ⚫ NORMAL
└─ Lost tech correlation (divergence opportunity)
Trading Signals:
🟢 → 🔴: Broken correlation = Possible opportunity
Large difference: Indicates correlation tension
Multiple breaks: Market regime change

SMA Strategy with Re-Entry Signal (v6 Style)*SMA Trend Strategy with Re-Entry Signal (v6 Edition)*
This indicator is based on a classic moving average trend-following system, enhanced with re-entry signals designed for medium to short-term traders.
---
### 📈 Key Features:
1. *Trend Detection Logic:*
- The 30-period SMA (SMA30) is used as the trend filter.
- When the closing price is above the SMA30, the market is considered to be in an uptrend.
2. *Re-Entry Signal:*
- While in an uptrend, if the closing price crosses above the SMA20, a re-entry (add position) signal is triggered.
- These signals are shown with green upward arrows below the bars.
3. *Background Highlighting:*
- Green background: indicates an uptrend.
- Red background: indicates a break below SMA30, suggesting weakening momentum.
4. *Multi-SMA Visualization:*
- Five SMAs are displayed: SMA10, SMA20, SMA30, SMA60, and SMA250.
- This helps visualize both short-term and long-term trend structures.
---
### 🔍 Usage Tips:
- Use this script directly on your main chart to monitor trend direction and wait for re-entry signals during pullbacks.
- Combine with other tools like volume, price action, or candlestick patterns to confirm entries.
---
### ⚠️ Disclaimer:
- This indicator is for educational and informational purposes only. It does not constitute financial advice or a buy/sell signal.
- Avoid relying solely on this script for trading decisions. Always manage your own risk.
---
👨💻 *Developer’s Note:*
This script is 100% manually developed, not copied or auto-generated. It is an original implementation based on my personal trading logic. Suggestions and feedback are welcome!

Stochastic with Z-Score📊 Stochastic with Z-Score
This custom indicator enhances the classic Stochastic Oscillator by applying Z-Score normalization to both %K and %D lines, helping traders identify statistically significant overbought and oversold conditions based on historical behavior.
🔍 Key Features:
Z-Score Normalization of %K and %D:
Detects deviations from the mean using standard deviation, offering a more dynamic and statistically grounded way to interpret momentum.
Signal Confirmation Filters:
✅ Trend Filter using 200 EMA: Only trade in the direction of the prevailing trend.
✅ Volume Filter: Confirms signals only when volume exceeds the moving average, reducing noise.
Buy & Sell Signals:
📈 Buy: Triggered when the Z-score of %K crosses above a negative threshold, %D is still below that threshold, and the candle is bullish.
📉 Sell: Triggered when the Z-score of %K crosses below a positive threshold, %D is still above that threshold, and the candle is bearish.
Signals are further filtered by trend and volume if enabled.
Customizable Thresholds & Settings:
Control Z-score length, thresholds, Stochastic lengths, and filter settings.
Visual Enhancements:
Colored histogram based on Z-score levels.
Shaded background in overbought/oversold zones.
Clear “Buy” and “Sell” labels plotted directly on the chart.
Alerts Included:
Set alerts on confirmed buy and sell signals for real-time notifications.
📘 How to Use:
Use this indicator on any timeframe or asset.
Enable or disable trend and volume filters depending on your strategy.
Use signals in confluence with price action or other indicators.
Adjust Z-score thresholds for more or fewer signals based on your risk profile.
⚠️ Note: This is an indicator, not a strategy. Always test signals on historical data and in simulation before live trading.

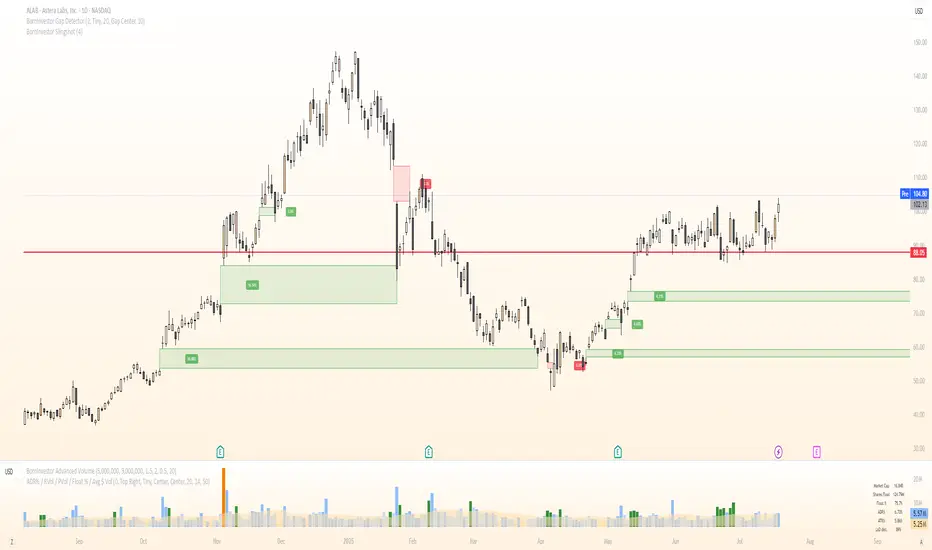
BornInvestor Gap Detector📈 BornInvestor Gap Detector
The BornInvestor Gap Detector is a powerful visual tool for identifying and analyzing price gaps on any chart. It automatically detects up and down gaps, highlights them with customizable boxes, and offers detailed labeling and alerting functionality.
🔍 Key Features:
Automatic Detection of bullish and bearish gaps based on customizable deviation settings.
Visual Highlighting of gaps using colored boxes with optional trail length limitation.
Gap Size Labels showing the percentage size of the gap, with the ability to display them only on the most recent N gaps.
Alerts for:
New gap appearance
Gap fully or partially closed
Price entering a gap zone (ideal for breakout/backfill strategies)
Customizable Colors for up/down gap borders and backgrounds.
Optional Message when no gaps are found on the current chart.
💡 Usefulness:
Gaps are an edge. They frequently act as support or resistance—especially on the first retest—when aligned with high-volume areas or other key price zones. Many strong stock moves begin with gaps, a concept central to strategies like Episodic Pivots.
This indicator helps you:
Identify gaps as potential entry zones on secondary setups
Quantify gaps via percentage size
Filter gaps based on size to suit your specific trading approach
Set alerts when price enters a gap or meets your custom criteria
Mickey's EMAMickey’s EMA is a lightweight, overlay indicator that combines two Exponential Moving Averages (EMAs) with automatic entry, stop-loss and target visual signals—plus dynamic JSON alerts for seamless webhook integration. It’s designed for both day-traders and swing-traders who want clear, on-chart cues and fully-customizable risk parameters.
🔍 Overview
Dual EMAs (fast & slow) to capture trend changes.
Automated “BUY” / “SELL” markers at every EMA crossover.
Customizable Stop-Loss % and Target % levels, plotted as ❌ and 🎯 bubbles.
“SL Hit (Custom)” if the opposite EMA crossover occurs before price touches your stop level.
JSON-formatted alerts containing ticker, instrument type, timeframe, trend (“CE” for bullish, “PE” for bearish), and price—ready for webhooks.
⚙️ Inputs
| Setting | Default | Description |
| ------------------------ | ------- | ----------------------------------------------- |
| **Fast EMA Length** | 20 | Period for the faster EMA. |
| **Slow EMA Length** | 200 | Period for the slower EMA. |
| **Price Source** | Close | Data series to calculate EMAs on. |
| **Custom Stop Loss %** | 0.1% | Stop-loss level as a percentage of entry price. |
| **Target %** | 0.5% | Profit-target level as a percentage of entry. |
| **Show Entry/SL/Target** | ON | Toggle all entry, SL and target visuals. |
📊 What It Plots
Fast EMA (blue) & Slow EMA (white) overlayed on price.
BUY 🟢 label below bar when Fast EMA crosses above Slow EMA.
SELL 🔴 label above bar when Fast EMA crosses below Slow EMA.
❌ (Custom) bubble at entry price if an opposite EMA crossover occurs before price hits your custom stop-loss.
❌ bubble at the stop-loss price when price actually breaches the stop level.
🎯 bubble at target price when price first reaches your profit-target level.
🔔 Alerts & Webhooks
On-screen alert conditions “Mickey’s EMA → BUY” and “Mickey’s EMA → SELL” appear in the Create-Alert dialog.
Dynamic JSON payload sent via alert() when a crossover fires, e.g.:
{
"script": "AAPL",
"scriptType": "equity",
"instrumentType": "NASDAQ",
"timeframe": "5",
"trend": "CE",
"price": 174.25
}
Use these alerts to integrate with bots, chat systems, manual, or any webhook-driven workflow.
🚀 Why Use Mickey’s EMA?
Clarity & Precision: All signals appear exactly at the EMA or price-level of interest.
Custom Risk Management: Define your own stop-loss and target percentages.
Seamless Automation: Dynamic JSON alerts mean zero manual setup for webhooks.
Versatile: Equally effective on intraday charts or daily/weekly timeframes.
Add Mickey’s EMA to your TradingView chart today and get instant, aesthetically-pleasing guidance on trend entries, risk exits, and profit targets—all in one elegant overlay.

Fractal Flow BandsFractal Flow Bands
A high-precision trend-following system combining HalfTrend logic with ALMA smoothing — built for clarity, speed, and smart alerts.
🔷 What is Fractal Flow Bands?
Fractal Flow Bands merges the best of both worlds:
HalfTrend for accurate trend detection
ALMA (Arnaud Legoux Moving Average) for smooth, low-lag confirmation
This unique synergy delivers clean, non-repainting Buy/Sell signals, filtering out market noise and keeping your chart crystal clear.
🔍 How It Works
Blue HalfTrend Line + Green ALMA Crossover → BUY
Red HalfTrend Line + Red ALMA Crossover → SELL
You get only ONE alert per trend change, eliminating spammy notifications. Perfect for swing traders, scalpers, and trend followers alike.
⚙️ Core Features
✅ Dual Confirmation Engine
ALMA must confirm HalfTrend — no single-line tricks here.
✅ One Alert per Trend Shift
Clean signals, no noise, no repeats.
✅ Visual Clarity
Color-coded trends. No channels, ribbons, or clutter.
✅ Customizable Settings
Tune HalfTrend amplitude and ALMA smoothness to your strategy.
🎯 Best For
Swing traders wanting confirmation before entries
Scalpers needing fast, accurate signal flow
Anyone who hates messy charts but loves sharp decisions
🛠 Settings Explained
Setting Description
HT Amplitude Controls HalfTrend sensitivity
ALMA Length / Offset / Sigma Adjusts the smoothness of ALMA
Source Choose price source (Close, Open, etc.)
Display Toggles Enable/disable arrows and ribbons
Colors Fully customizable trend color schemes
✅ Built-in Alerts — So you never miss a signal again.
⚡ Lag-free performance — Works on multiple timeframes.
📈 Real strategy-ready code — Not just another repainting overlay.

Engulfing RSI EMA tohungmc tkEngulfing RSI EMA Indicator
This indicator combines the 200-period EMA, RSI, and Engulfing candlestick patterns to generate buy and sell signals:
Buy Signal: Triggered when a Bullish Engulfing candle forms, RSI is above a user-defined threshold (default 50), and the price is above the EMA (default 200).
Sell Signal: Triggered when a Bearish Engulfing candle forms, RSI is below a user-defined threshold (default 50), and the price is below the EMA (default 200).
Features:
Customizable EMA length (default 200).
Adjustable RSI period (default 14) and thresholds for buy/sell signals.
Visual signals with green upward triangles for buy and red downward triangles for sell.
Alerts for both buy and sell signals.
How to Use:
Add the indicator to your chart.
Adjust EMA length, RSI period, and RSI thresholds in the settings.
Set up alerts for "Buy Signal" or "Sell Signal" to receive notifications.
Ideal for traders looking to combine trend, momentum, and candlestick patterns for better decision-making.

PivotLibrary222Library "PivotLibrary222"
f_determinePivotStrength(_pivotCandidateRelativeIndex, _type, _maxStrength)
Determines the strength of a pivot (low or high).
Parameters:
_pivotCandidateRelativeIndex (int) : The relative bar index of the pivot candidate.
_type (string) : "low" for a pivot low, "high" for a pivot high.
_maxStrength (int) : The maximum number of bars to check on either side for strength.
Returns: An array containing .
f_getPlotColorForStrength(_strength)
Gets a plotting color based on pivot strength.
Parameters:
_strength (int) : The calculated pivot strength.
Returns: A color for plotting.
f_updateExistingPivotLow(f_pivotLows, f_pivotLowInfoIndex, f_newStrength, f_showLabels)
Updates an existing pivot LOW's strength and its corresponding chart label.
Parameters:
f_pivotLows (array) : The array of pivotLowInfo objects.
f_pivotLowInfoIndex (int) : The index of the pivot to update in the array.
f_newStrength (int) : The new (increased) strength of the pivot.
f_showLabels (bool) : A boolean to control if labels should be updated.
f_updateExistingPivotHigh(f_pivotHighs, f_pivotHighInfoIndex, f_newStrength, f_showLabels)
Updates an existing pivot HIGH's strength and its corresponding chart label.
Parameters:
f_pivotHighs (array) : The array of pivotHighInfo objects.
f_pivotHighInfoIndex (int) : The index of the pivot to update in the array.
f_newStrength (int) : The new (increased) strength of the pivot.
f_showLabels (bool) : A boolean to control if labels should be updated.
f_findPivotLows(f_pivotLows, f_minStrength, f_maxStrength, f_showLabels)
Finds and processes pivot lows.
Parameters:
f_pivotLows (array) : The array of pivotLowInfo objects to read from and modify.
f_minStrength (int) : Minimum strength required for a new pivot to be recorded.
f_maxStrength (int) : Maximum strength to search for when determining pivot strength.
f_showLabels (bool) : A boolean to control if new labels should be created.
f_findPivotHighs(f_pivotHighs, f_minStrength, f_maxStrength, f_showLabels)
Finds and processes pivot highs.
Parameters:
f_pivotHighs (array) : The array of pivotHighInfo objects to read from and modify.
f_minStrength (int) : Minimum strength required for a new pivot to be recorded.
f_maxStrength (int) : Maximum strength to search for when determining pivot strength.
f_showLabels (bool) : A boolean to control if new labels should be created.
pivotHighInfo
Represents a detected pivot high.
Fields:
abs_index (series int)
price (series float)
strength (series int)
label_id (series label)
pivotLowInfo
Represents a detected pivot low.
Fields:
abs_index (series int)
price (series float)
strength (series int)
label_id (series label)
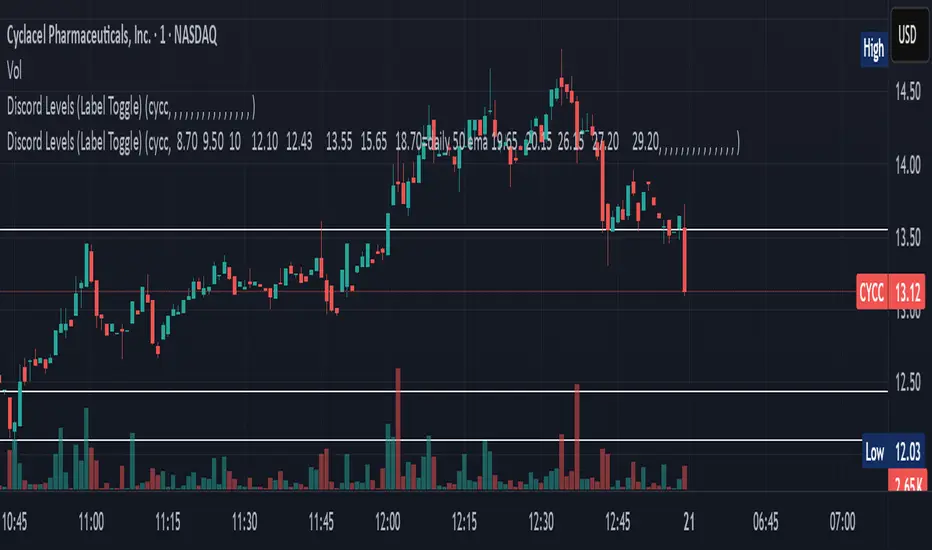
Discord Levels (Label Toggle)This indicator is designed to streamline your multi-asset level tracking by displaying custom price levels directly on your chart for up to eight different stocks. It allows you to define key support, resistance, and moving average levels, enhancing your analysis across various instruments.
Key Features:
Multi-Stock Level Display: Track important levels for up to 8 distinct stock symbols simultaneously.
Customizable Level Inputs: Define all your desired price levels using a simple space-separated string for each stock.
Intelligent Color-Coding: Levels are automatically color-coded for quick identification based on the associated notes in your input string:
White Line: Standard price levels (e.g., 123.45).
Yellow Line: Levels designated as 200 Daily EMA (e.g., 18.70=daily 200 ema).
Blue Line: Levels designated as 50 Daily EMA (e.g., 18.70=daily 50 ema).
Gray Line: Levels designated as 34 Daily EMA (e.g., 18.70=daily 34 ema).
Green Line: Levels designated as 9 Daily EMA (e.g., 18.70=daily 9 ema).
Red Line: Critical or Cautionary levels (e.g., 9.00=cautionary).
Dynamic Label Positioning: Price labels are displayed next to the lines, dynamically positioned to the right of the current bar (30 bars offset) for optimal visibility across different timeframes.
Global Label Toggle: Easily enable or disable all price labels from the indicator's settings.
How to Use:
Input Stock Symbol: For each slot (Stock 1 to Stock 8) you wish to use, enter the exact TradingView symbol (e.g., AAPL, MSFT, TSLA).
Input Levels String: In the corresponding "Levels" input field, enter your desired price levels separated by spaces.
Basic Level: Just enter the number (e.g., 12.34).
Levels with Notes: Use the format PRICE=NOTE for specific annotations (e.g., 18.70=daily 200 ema, 9.00=cautionary).
Supported Notes for Automatic Coloring: daily 200 ema, daily 50 ema, daily 34 ema, daily 9 ema, cautionary, critical. (Case-insensitive)
Manage Slots: If you need to track more than 8 stocks, simply clear the symbol and levels for an old stock and use that slot for your new entry.
This indicator is a powerful tool for traders who rely on fixed price levels and moving averages across multiple securities, providing clear visual cues without cluttering your main chart analysis.
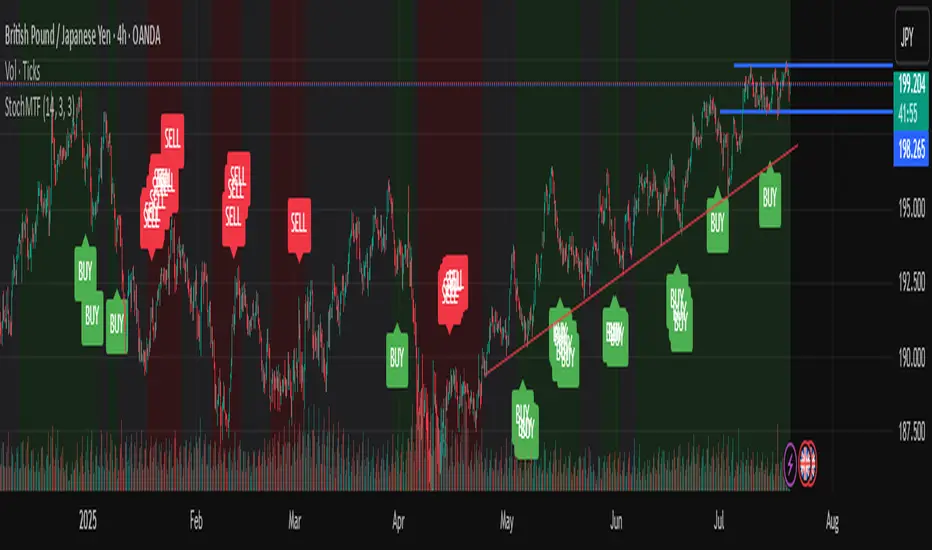
Stochastic Trend Signal with MTF FilterMulti-Timeframe Stochastic Trend Filter – Real Signals with Confirmation Candles
This script is a multi-timeframe Stochastic trend filter designed to help traders identify reliable BUY/SELL signals based on both momentum and higher-timeframe trend context.
It combines three key components:
Entry Signal Logic:
Entry is based on the Stochastic Oscillator (%K, 14,3), where overbought/oversold conditions are detected in the current chart's timeframe.
A green (bullish) candle following a red candle with %K below 20 can trigger a BUY signal.
A red (bearish) candle following a green candle with %K above 80 can trigger a SELL signal.
Trend Confirmation – Daily Filter:
The script uses Stochastic on the 1D (Daily) timeframe to determine whether short-term momentum aligns with a broader daily trend.
BUY signals are only allowed if the Daily %K is above 50.
SELL signals are only allowed if the Daily %K is below 50.
Long-Term Trend Filter – Weekly Stochastic:
A second filter uses Weekly %K:
BUY signals are suppressed if the Weekly trend is bearish (Weekly %K < 50) while Daily %K is bullish (> 50).
SELL signals are suppressed if the Weekly trend is bullish (Weekly %K > 50) while Daily %K is bearish (< 50).
🖼️ The chart background changes color to visually assist users:
Green background: bullish alignment on Daily and Weekly Stochastic.
Red background: bearish alignment.
Gray background: trend conflict (Daily and Weekly disagree).
✅ This script is ideal for swing traders or position traders who want to enter with confirmation while avoiding false signals during trend conflict zones.
🔔 Alerts are provided for BUY and SELL signals once all conditions are met.
How to use:
Apply on timeframe (4H recommended).
Add alerts for "BUY Alert" and "SELL Alert".
Use background color and plotted labels as entry filters.
Disclaimer: This is not financial advice. Always use proper risk management and test on demo accounts first.
Debit Spread POMDP‑Inspired StrategyComprehensive Strategy for TradingView-Based Call and Put Debit Spread Options Using POMDP for Signal Generation
Debit spreads limit risk to the net premium paid while capping potential profit, ideal for moderate price predictions.
Pine Script in TradingView enables custom indicator integration and strategy automation for options trading.
Partially Observable Markov Decision Processes (POMDPs) optimize decision-making under market uncertainty by modeling states, actions, and observations.
Training a POMDP policy involves defining market states, actions, and observations from technical indicators, then simulating and refining the policy.
Automating the strategy via agents or TradingView alerts can execute trades when conditions align with the POMDP-generated signals.
