High/Low Premarket & Previous Day This scripts adds lines for previous day and premarket high/low with labels that you can toggle on and off. The lines extend through current premarket and trading session
Indicators and strategies

Trend_Finder(Telegram-RR_Algo_Indicators_Intraday)EMA Inputs
It uses 6 EMAs with customizable lengths (defaults: 30, 35, 40, 45, 50, 60).
Trend Conditions
Bullish Trend: All EMAs are strictly ordered from smallest to largest, meaning short-term prices are leading long-term prices upward.
Bearish Trend: All EMAs are ordered from largest to smallest, meaning short-term prices are falling below long-term ones.
Neutral: EMAs are mixed and do not meet the above criteria.
Trend Tracking
The script remembers the current trend and only flips when a full trend reversal condition is confirmed.

HA Background ColorThis indicator colors the entire chart background based on the current Heikin Ashi candle direction:
🟩 Green background = Bullish Heikin Ashi candle
🟥 Red background = Bearish Heikin Ashi candle

Market Energy – Trend vs Retest (with Saturation %)Market Energy – Trend vs Retest Indicator
This indicator measures the bullish and bearish energy in the market based on volume-weighted price changes.
It calculates two smoothed energy waves — bullish energy and bearish energy — using exponential moving averages of volume-adjusted price movements.
The indicator detects trend changes and retests by comparing the relative strength of these waves.
A saturation percentage quantifies the intensity of the current dominant side (bulls or bears) relative to recent highs.
- High saturation (>70%) indicates strong momentum and dominance by bulls or bears.
- Low saturation (<30%) suggests weak momentum and possible market indecision or consolidation.
The background color highlights the current control: green for bulls, red for bears, with transparency indicating the saturation level.
A label shows which side is currently in control along with the saturation percentage for quick interpretation.
Use this tool to identify strong trends, possible retests, and momentum strength to support your trading decisions.

Patrón Mecha Profunda
This pattern must be combined with a 20-period moving average. It is used to know the direction of the price. When the pattern appears and the price is above the 20-period moving average, it is a bullish signal and vice versa.

Multi Averages - CustomizableThis script adds up to 5 moving averages to your plot!
Both type and length are customizable.

EMA X/Y🔍 EMA X/Y Indicator Description
This indicator combines two different EMA ( Exponential Moving Average ) values into a single script, allowing you to visualize both short-term and long-term trends on the same chart.
📌 X: First EMA length (typically for short-term trends)
📌 Y: Second EMA length (typically for long-term trends)
🎯 Purpose:
– Track overall trend direction and potential reversals
– Generate buy/sell signals based on EMA X and Y crossovers
– Analyze market momentum across timeframes

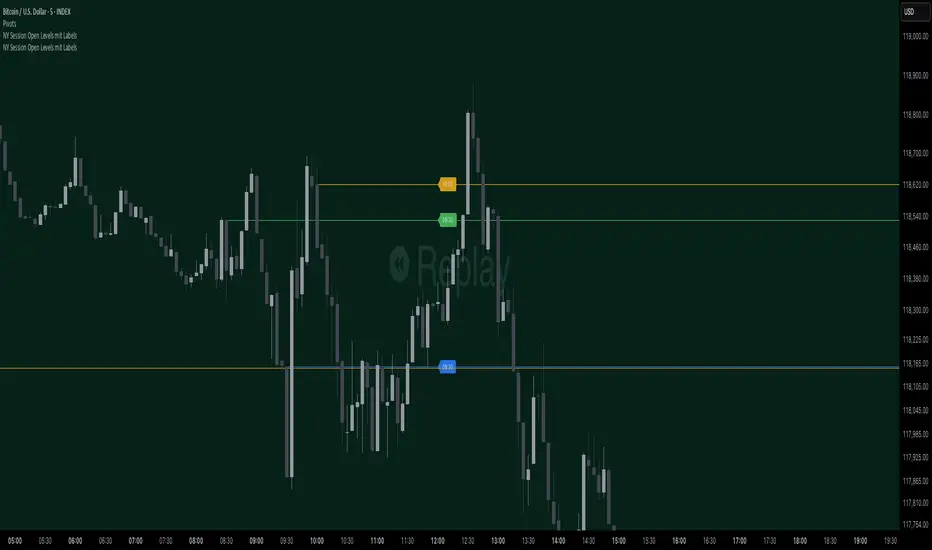
NY Session Open Levels This indicator automatically draws horizontal lines at the opening prices of the New York trading session at 08:30, 09:30, and 10:00 AM NY time. Each line is labeled and extended to the right, providing clear reference points for key intraday levels. The lines and labels reset daily and are ideal for identifying reaction zones during the early U.S. trading hours.

Entry HelperEntry Helper is a precision tool designed to enhance clarity and support decision-making in fast-paced trading environments.
It adapts intelligently to different timeframes, offering visual guidance based on your chosen context — without the need to manually adjust settings.
Specially optimized for scalping assets like XAUUSD, NASDAQ, and SP500, it delivers exactly what you need, when you need it.
⚡ Just switch the chart… and it adjusts itself.
Developed by WAKEUP | Maggifx

Custom Candle Colors by Day (Full Week)Highlight specific daily candles a different color (Monday - Sunday)
NY Session Open Levels mit LabelsThis indicator automatically draws horizontal lines at the opening prices of the New York trading session at 08:30, 09:30, and 10:00 AM NY time. Each line is labeled and extended to the right, providing clear reference points for key intraday levels. The lines and labels reset daily and are ideal for identifying reaction zones during the early U.S. trading hours.
EMA 8 & 21 crossover change EMA 8 & 21 crossover change Indicator This custom TradingView indicator highlights trend shifts by changing candle colors when the 8 EMA crosses the 21 EMA. Bullish crossovers turn candles different color, while bearish crossovers turns different as well—making it easy to visually identify emerging trends and momentum shifts in real time.
TG Capital FVG Signal Strategy - Quick Guide# TG Capital FVG Signal Strategy - Quick Guide
## Strategy Overview
**Type:** High RR Swing Trading
**Win Rate:** ~90% | **Risk-Reward:** Minimum 1:20
**Session:** London Only (3:00-6:30 AM NY time)
**Timeframe:** 30-minute charts
## Setup Requirements (ALL Must Be Met)
1. ✅ **London Kill Zone Active** (yellow background)
2. ✅ **Price Above EMA 200** (dark red line)
3. ✅ **EMAs Bullishly Stacked** (5>9>13>21)
4. ✅ **Fair Value Gap Forms** (blue box appears)
5. ✅ **Structure = BULLISH** (check status table)
## Signal Types
### 🟠 Orange Triangle: "50% Touch"
- Price touches yellow dashed line (50% of FVG)
- **Action:** Monitor for entry opportunity
### 🟢 Green Diamond: "Entry Signal"
- 50% touch + doji candle confirmation
- **Action:** Execute trade entry
## Entry Rules
**Enter When:**
- Green diamond appears OR orange triangle + doji pattern
- All 5 setup requirements confirmed
- Next candle closes BELOW doji high (validation)
**Stop Loss:**
- Below doji candle low (~10 pips for USD pairs)
- Gold: No hard stop, exit on candle close below setup
**Take Profit:**
- Minimum 1:20 RR (200+ pips for 10 pip stop)
- Use daily chart for higher targets
- Ride trend until EMA crossover or strong bearish candle
## Preferred Markets
- **Best:** Gold (XAU/USD), GBP/USD, EUR/USD, USD/JPY
- **Good:** USD/CAD, NZD/USD
- **Avoid:** AUD/USD
## Risk Management
- **Position Size:** Maximum 0.5% risk per trade
- **Frequency:** 8-10 setups per year per pair
- **Patience Required:** May wait weeks between valid setups
- **Psychology:** Must handle large P&L swings during holds
## Key Success Factors
1. **Extreme Patience** - Quality over quantity
2. **Strict Rules** - No exceptions to setup criteria
3. **Proper Timing** - London session only
4. **Trend Following** - Align with EMA structure
5. **Risk Control** - Small stops, big targets

EMA Cross Approach ScreenerWorks best on D/4H. Signals when the price of a stock is below the 200ema and the 9 and 20 are sloping up approaching the 200 while being 5% or less than from the 200. Helps the trader find a good buying point while keeping risk minimum.

Multi-Timeframe MA 200Multi-Timeframe MA 200
This powerful tool plots the 200-period Moving Average across multiple timeframes (5m, 15m, 30m, 1h, 4h, Daily) directly on your active chart. You can switch between SMA (Simple Moving Average) and EMA (Exponential Moving Average) for all timeframes at once.
Key features:
✅ 100% accurate calculation using the original timeframe
✅ Option to choose SMA or EMA
✅ Visual smoothing for cleaner display
✅ Floating labels showing the origin timeframe
✅ Clean interface – no clutter or legends
✅ Ideal for scalping, intraday, and swing traders
Developed by BELOTTO TRADER, founder of the CLUBE DO GAIN – one of the most engaged trading communities in the Portuguese-speaking world.

Power candle_V2Power candle_V2Power candle_V2Power candle_V2Power candle_V2Power candle_V2Power candle_V2Power candle_V2Power candle_V2Power candle_V2Power candle_V2Power candle_V2Power candle_V2Power candle_V2Power candle_V2

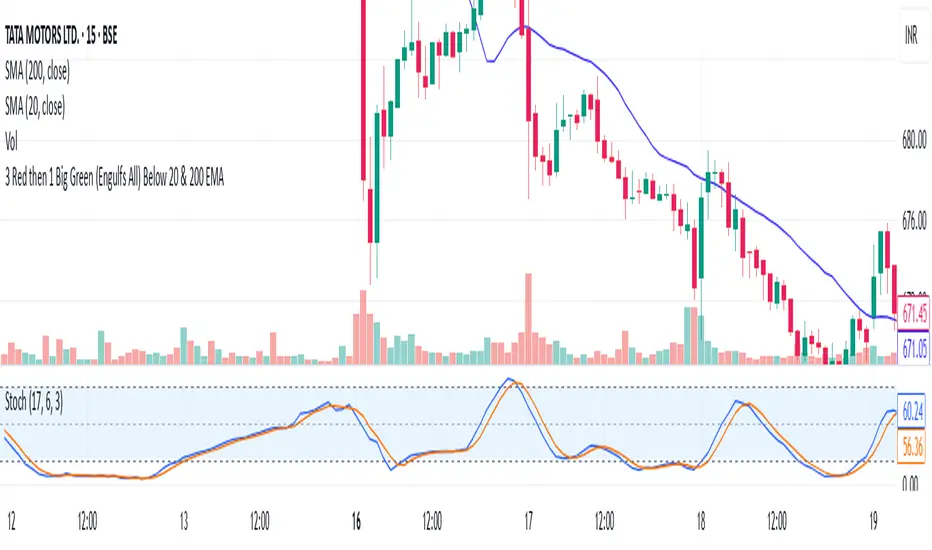
3 Red then 1 Big Green (Engulfs All) Below 20 & 200 EMAIt will tell if green canlde is big enough to engulf 3 red
Mother Candle at Support//@version=5
indicator("Mother Candle at Support", overlay=true)
length = input.int(50, title="Support Lookback")
bodyRatio = input.float(1.5, title="Body vs Avg Body Ratio")
// Calculate body size and average
candleSize = high - low
avgBody = ta.sma(high - low, 10)
// Identify Mother Candle (large range)
mother = candleSize > (avgBody * bodyRatio)
// Inside candles (1 or 2)
inside1 = high < high and low > low
inside2 = high < high and low > low
// Price near recent support (swing low)
swingLow = ta.lowest(low, length)
nearSupport = close <= swingLow * 1.03
// Combine all
signal = mother and (inside1 or inside2) and nearSupport
// Plot signal on chart
plotshape(signal, title="Mother Candle at Support", location=location.belowbar, color=color.green, style=shape.labelup, text="MC-S")

XAUUSD Trendline Breakout + RSI + MA Signal//@version=5
indicator("XAUUSD Trendline Breakout + RSI + MA Signal", overlay=true)
// --- Inputs ---
lengthFast = input.int(10, title="Fast MA Length")
lengthSlow = input.int(30, title="Slow MA Length")
rsiLength = input.int(14, title="RSI Length")
rsiOverbought = input.int(70, title="RSI Overbought Level")
rsiOversold = input.int(30, title="RSI Oversold Level")
// --- Moving Averages ---
fastMA = ta.sma(close, lengthFast)
slowMA = ta.sma(close, lengthSlow)
// --- RSI ---
rsi = ta.rsi(close, rsiLength)
// --- Trendline (Manual input) ---
// Use fixed default price values here, change manually based on your chart.
trend_x1 = input.int(20, title="Trendline Point 1 X (bars ago)")
trend_y1 = input.float(3000.0, title="Trendline Point 1 Y (price)") // constant default
trend_x2 = input.int(2, title="Trendline Point 2 X (bars ago)")
trend_y2 = input.float(3100.0, title="Trendline Point 2 Y (price)") // constant default
bar_idx1 = bar_index - trend_x1
bar_idx2 = bar_index - trend_x2
trendline_y_value(bar) =>
m = (trend_y2 - trend_y1) / (bar_idx2 - bar_idx1)
c = trend_y1 - m * bar_idx1
m * bar + c
trend_y_curr = trendline_y_value(bar_index)
trend_y_prev = trendline_y_value(bar_index - 1)
// --- Signals ---
// Trendline breakout
buyBreakout = (close < trend_y_prev) and (close > trend_y_curr)
sellBreakout = (close > trend_y_prev) and (close < trend_y_curr)
// MA crossover
maBuy = ta.crossover(fastMA, slowMA)
maSell = ta.crossunder(fastMA, slowMA)
// RSI confirmation
rsiBuy = rsi < rsiOversold
rsiSell = rsi > rsiOverbought
// Final buy/sell signal with all conditions
buySignal = buyBreakout and maBuy and rsiBuy
sellSignal = sellBreakout and maSell and rsiSell
// --- Plot ---
plot(fastMA, color=color.blue, title="Fast MA")
plot(slowMA, color=color.orange, title="Slow MA")
plotshape(buySignal, title="Buy Signal", location=location.belowbar, color=color.green, style=shape.labelup, text="BUY")
plotshape(sellSignal, title="Sell Signal", location=location.abovebar, color=color.red, style=shape.labeldown, text="SELL")
// Plot trendline
var line trendLine = na
if barstate.islast
if na(trendLine)
trendLine := line.new(bar_idx1, trend_y1, bar_idx2, trend_y2, color=color.yellow, width=2)
else
line.set_xy1(trendLine, bar_idx1, trend_y1)
line.set_xy2(trendLine, bar_idx2, trend_y2)
// --- Alerts ---
alertcondition(buySignal, title="Buy Alert", message="XAUUSD Buy Signal")
alertcondition(sellSignal, title="Sell Alert", message="XAUUSD Sell Signal")

Buy/Sell Labels-RR_AlgoAI (Telegram-RR_Algo_Indicators_Intraday)This indicator uses the Trend Movement to identify shifts in market trend. When the positive movement crosses above the negative, it signals a potential bullish move and marks the chart with a "BUY" label along with a green trend line from the candle's low. Conversely, when Negative movement crosses above Positive Movement, it signals bearish potential, showing a "SELL" label and a red trend line from the candle's high. It also plots the smoothed difference between to show trend strength.

Power candle addPower candle add++++Power candle add++++Power candle add++++Power candle add++++Power candle add++++Power candle add++++Power candle add++++Power candle add++++Power candle add++++Power candle add++++Power candle add++++Power candle add++++Power candle add++++


TrailingPE//@version=6
indicator("TrailingPE", shorttitle="TPE", overlay=true)
// === USER INPUTS ===
pos_x = input.string("Right", "Horizontal Position", options= )
pos_y = input.string("Top", "Vertical Position", options= )
text_color = input.color(color.white, "Text Color")
bg_color = input.color(color.new(color.blue, 80), "Background Color")
text_size = input.string("Normal", "Font Size", options= )
// === POSITION MAPPING ===
get_position_y() =>
switch pos_y
"Top" =>
switch pos_x
"Left" => position.top_left
"Center" => position.top_center
"Right" => position.top_right
"Middle" =>
switch pos_x
"Left" => position.middle_left
"Center" => position.middle_center
"Right" => position.middle_right
"Bottom" =>
switch pos_x
"Left" => position.bottom_left
"Center" => position.bottom_center
"Right" => position.bottom_right
get_text_size() =>
switch text_size
"Tiny" => size.tiny
"Small" => size.small
"Normal" => size.normal
"Large" => size.large
"Huge" => size.huge
// === PE CALCULATION ===
eps_ttm = request.financial(syminfo.tickerid, "EARNINGS_PER_SHARE_DILUTED", "TTM")
if na(eps_ttm)
eps_ttm := request.financial(syminfo.tickerid, "EARNINGS_PER_SHARE_BASIC", "TTM")
current_price = close
pe_ratio = eps_ttm > 0 ? current_price / eps_ttm : na
is_data_valid = not na(pe_ratio) and eps_ttm > 0
// === COMPACT SINGLE-LINE DISPLAY ===
if barstate.islast
var table pe_table = table.new(get_position_y(), 1, 1,
bgcolor=bg_color,
border_width=1,
border_color=color.gray)
table.clear(pe_table, 0, 0, 0, 0)
if is_data_valid
// Single line: "PE : Value" - removed text_style parameter
pe_rounded = math.ceil(pe_ratio)
pe_text = "PE : " + str.tostring(pe_rounded)
table.cell(pe_table, 0, 0, pe_text,
text_color=text_color,
text_size=get_text_size(),
bgcolor=bg_color)
else
table.cell(pe_table, 0, 0, "PE : N/A",
text_color=color.red,
text_size=get_text_size(),
bgcolor=bg_color)
