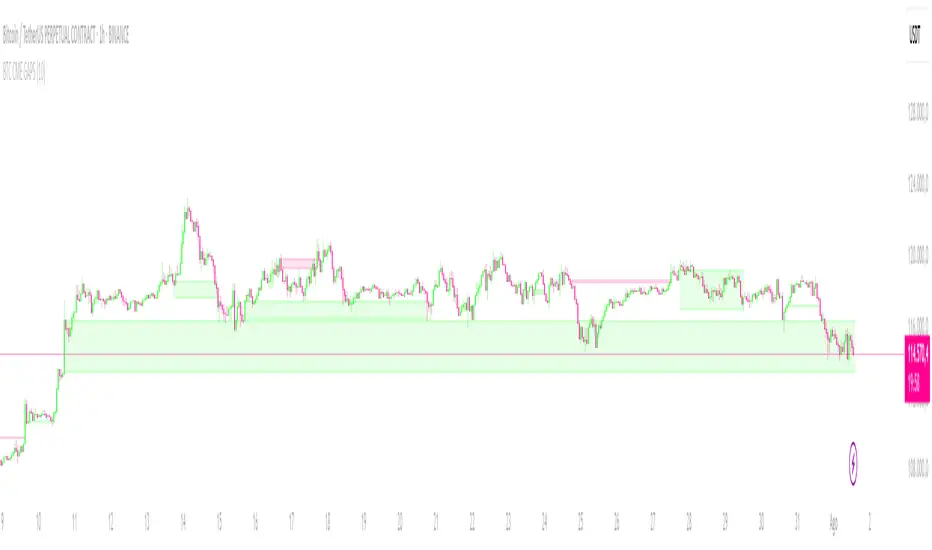
CRYPTO CME GAPS- Can be used in any crypto symbol of any exchange, (not necessarily the CME exchange)
- Displays the CME gaps with the colors green or red depending on the sentiment of the gap
- Extends the gaps displayed until they are filled.
- In the end of the code there are the boolean values 'filled_bull' and 'filled_bear' that can be used to create a strategy script.
Indicators and strategies
Invencible MACD Strategy Scalping)Invencible MACD Strategy
The Invencible MACD Strategy is a refined scalping system designed to deliver consistent profitability by optimizing the classic MACD indicator with trend and volatility filters. This strategy is built for short-term traders looking for precision entries and favorable risk-to-reward conditions on any asset and lower timeframes such as 1m, 5m, or 15m.
Core Logic
This strategy uses a multi-timeframe (MTF) approach to calculate the MACD, Signal Line, and Histogram. Trades are executed when all of the following conditions are met:
Long Entry:
The MACD crosses above the Signal Line.
The Histogram is rising with a defined impulse threshold.
Price is above the 200 EMA, confirming an uptrend.
Volatility, measured by ATR, is above a configurable minimum.
Short Entry:
The MACD crosses below the Signal Line.
The Histogram is falling with a defined impulse threshold.
Price is below the 200 EMA, confirming a downtrend.
ATR confirms sufficient volatility.
Risk Management
Take Profit is set higher than Stop Loss to ensure that the average winning trade is greater than the average losing trade.
Trailing stop is optional and can be disabled to allow full profit capture on strong moves.
Trade size is fixed to 1 contract, suitable for scalping with low exposure.
Customizable Parameters
MACD Fast, Slow, and Signal EMAs
Histogram impulse threshold
Minimum ATR filter
Take Profit and Stop Loss percentage
Trailing Stop activation and size
Timeframe resolution (can be customized or synced with chart)
Visual Aids
MACD and Signal Line are plotted below price.
Histogram bars help visualize momentum strength.
200 EMA is plotted on the main chart to show trend direction.
This strategy was designed to prioritize quality over quantity, avoiding weak signals and improving both the win rate and profit factor. It is especially effective on assets like gold (XAUUSD), indices, cryptocurrencies, and high-liquidity stocks.
Feel free to test and optimize parameters based on your trading instrument and timeframe.
Los 7 Capitales


Peak & Valley Screener RadarThis Pine Script indicator is designed to help traders and investors analyze the percentage distance of stock prices from their recent All-Time High (ATH) and All-Time Low (ALH) over a user-defined number of bars.
It functions as a multi-stock screener, scanning a customizable list of stocks (default: 40 BIST 500 stocks) and displaying results in a dynamic table on the chart.
The script identifies stocks that have pulled back more than a specified percentage from their ATH (potential buying opportunities) or risen less than a specified percentage from their ALH (potential caution zones).
Key Features:
Customizable Stock List: Users can input a comma-separated list of stock tickers (e.g., "AAPL,GOOGL,MSFT") to scan any symbols available on TradingView.
User-Defined Parameters: Adjust the lookback period (bars back, default 250), ATH pullback threshold (default 10%), and ALH rise threshold (default 10%).
Dynamic Table Display: Results are shown in a table with two columns: "Distance to TOP" (ATH pullbacks in red) and "Distance to BOTTOM" (ALH rises in green). The table includes input parameters for quick reference and can be positioned anywhere on the chart (top/bottom left/center/right).
Optional Plots: Toggle plots to visualize the percentage distances for the current chart symbol (red for ATH, green for ALH).
Efficient Data Handling: Uses request.security with tuples for optimized multi-symbol data fetching, supporting up to ~80 stocks without exceeding Pine Script limits (adjust table rows if needed for more).
Real-Time Updates: The table updates only on the last bar for performance efficiency.
How It Works:
The script calculates the highest high and lowest low over the specified bars for each stock.
It computes the percentage difference from the current close: negative for ATH (pullback) and positive for ALH (rise).
Stocks meeting the thresholds are listed in the table with their exact percentages.
Usage Tips:
Apply this indicator to any chart (e.g., a BIST index or stock) to run the screener in the background.
Ideal for swing traders scanning for undervalued stocks near ATH or overbought near ALH.
Note: Performance may vary with large stock lists due to TradingView's security call limits (~40-50 calls per script). Test with smaller lists if needed.
You can bypass the 40-stock limit by adding the indicator twice to the chart, entering 40 different stocks in the second indicator and setting a different table position from the first one, allowing you to scan 80 stocks simultaneously. In fact, this way, you can scan as many stocks as your plan's limits allow.
This script is released under the Mozilla Public License 2.0. Feedback and suggestions are welcome, but please adhere to TradingView's House Rules—no guarantees of profitability, use at your own risk.Disclaimer: This is not financial advice. Past performance does not predict future results. Always conduct your own research.


ALMA X/Y🔍 ALMA X/Y Indicator Description
This indicator combines two different ALMA ( Arnaud Legoux Moving Average ) values into a single script, allowing you to visualize both short-term and long-term trends on the same chart.
📌 X: First ALMA length (typically for short-term trends)
📌 Y: Second ALMA length (typically for long-term trends)
🎯 Purpose:
– Track overall trend direction and potential reversals
– Generate buy/sell signals based on ALMA X and Y crossovers
– Analyze market momentum across timeframes

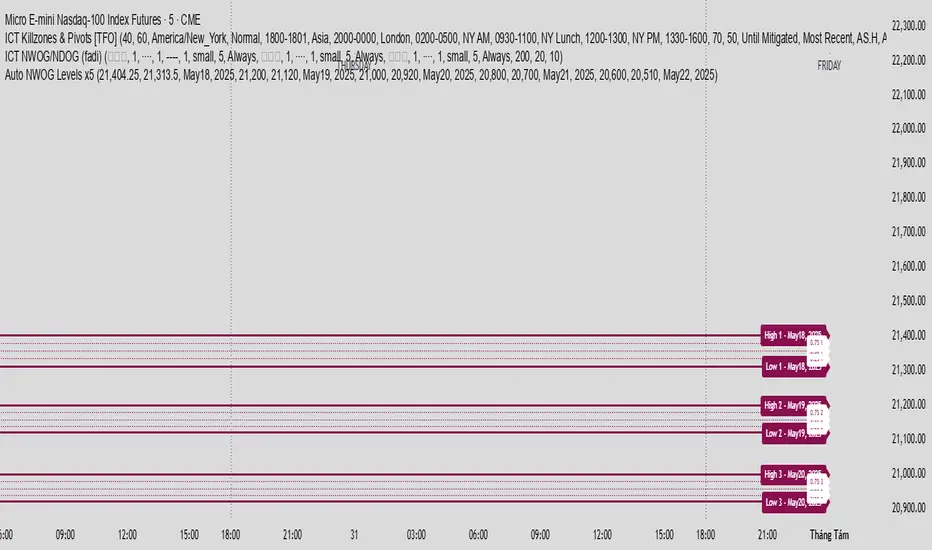
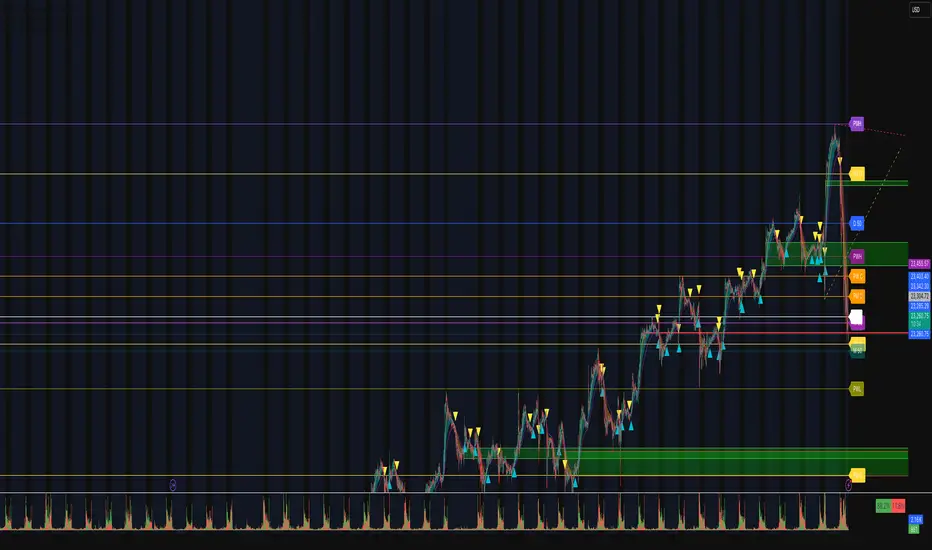
Auto NWOG Levels x5Indicator Name: Auto NWOG Levels with Labels
Description:
This indicator automatically plots the NWOG (Naked Weekly Open Gap) price levels on your chart. It includes:
NWOG High & Low: Solid maroon lines representing the high and low boundaries of the NWOG zone.
Intermediate Levels: Dotted maroon lines at 25%, 50%, and 75% levels within the NWOG range, providing visual guidance for possible support/resistance zones.
Labels: Each level is labeled on the right side of the chart, including a customizable date label for context.
Extendable Lines: All lines extend horizontally for a customizable number of bars (default: 500 bars) for better visibility over time.
Inputs:
NWOG High: Price level of the NWOG high.
NWOG Low: Price level of the NWOG low.
Date Label: Text to be displayed on the labels (e.g., the week of the NWOG).
This tool is useful for traders who monitor weekly price gaps and want clear, persistent levels drawn automatically on their charts.
3 EMA cross overThis Pine Script displays the 3 EMA trend status for a list of popular stocks in a dynamic table. It calculates and monitors 13 EMA, 48 EMA, and 200 EMA for each ticker to detect bullish or bearish alignment.
Best Use:
Use this script to quickly scan market trends across multiple stocks and identify potential trade opportunities based on EMA alignment.

Buy/Sell Demand Pressure SMAThis indicator shows when competing buying and selling pressure has changed.
When bullish buying offsets bearish transaction volume, the indicator turns green. When bearish selling pressure offsets bullish buying volume the indicator is red.
Can be used as a normal SMA or to confirm buy/sell signals of other indicators.
Works best at the start of trades...and not exits but if set properly, it is a good indicator of when a trend has reversed.
~ jb tuttle

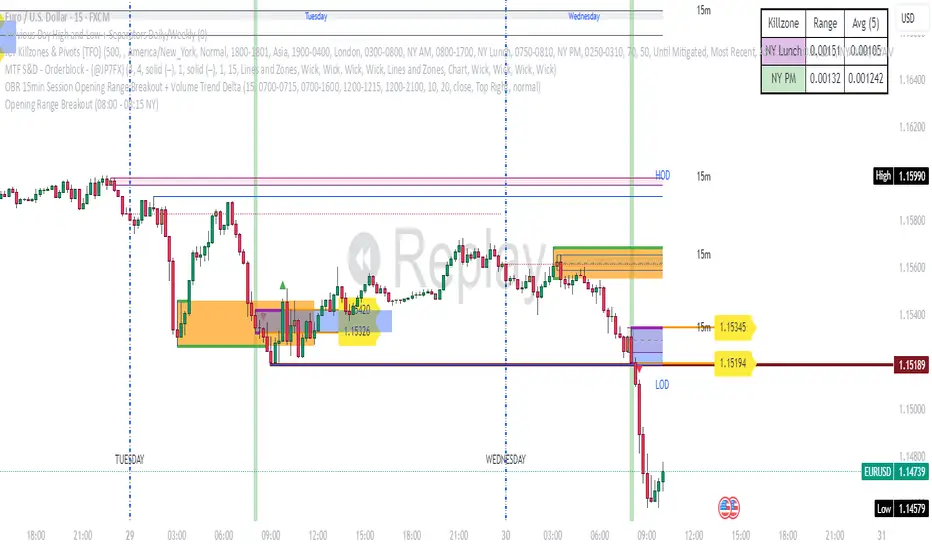
Opening Range Breakout (08:00 - 08:15 NY) - AAPNIndicador que marca la apertura de Forex en NY a 15 minitos, la primera vela

Position Sizing Based on 21-Day ATR % (30 Holdings) 40 volATR portion sizing based on 40 vol to get is close to STD DEV weightings.

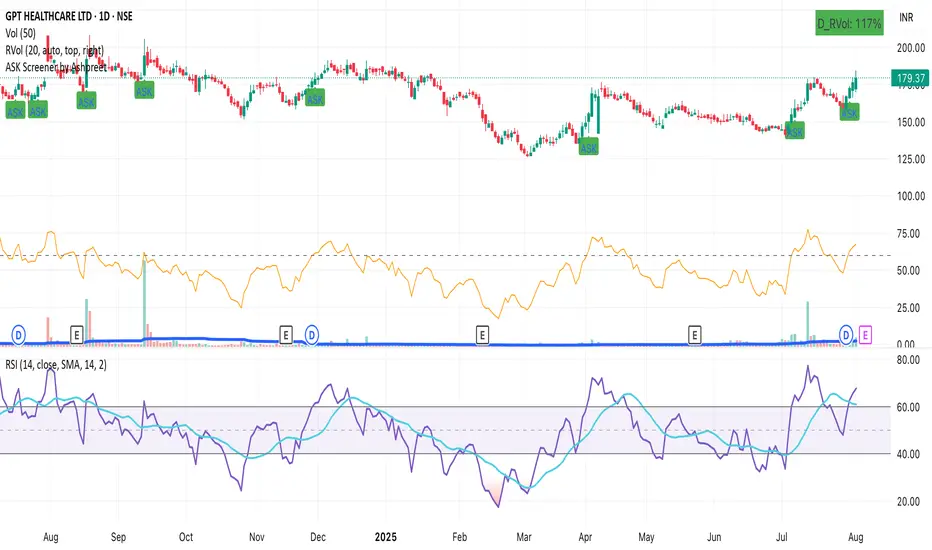
ASK Screener by AshpreetThe ASK Indicator is a custom-built breakout and trend continuation system designed for swing traders seeking high-probability entries with strong risk-reward ratios. Built using a combination of moving averages, momentum filters, volume confirmation, and price structure, this indicator helps identify stocks poised for explosive moves.
It uses three key moving averages: the 44-period SMA (medium trend), 20-period DEMA (short-term strength, custom-coded), and 50-period WEMA (institutional trendline). Trades are only triggered when the price is above 50 WEMA, and the 20 DEMA is above the 44 SMA.
Momentum is confirmed using RSI(14) within a healthy zone of 40–60, ensuring the stock is not overbought or oversold. To focus on breakout candidates, the stock must be trading within 10% of its 52-week high, and the weekly candle range must be under 10%, signaling compression before expansion.
A valid ASK Signal occurs when these conditions are met along with a breakout above the previous day’s high and volume exceeding 1.5× the 20-day average. Once triggered, the indicator auto-plots the stop-loss (1× ATR) and two profit targets: 1:2 (TP1) and 1:4 (TP2).
Additionally, the system detects a narrow range setup, where the last 3 daily candles are inside the previous 3-day range — a powerful consolidation signal. Alerts for both ASK entries and narrow ranges are included.
This system is ideal for positional and short-term swing traders who want to combine structure, momentum, and volume in one powerful tool.
DEMACROSSOVA BY FLACODouble EMAs for entry signals
ATR Bands for stoploss
Fibonacci bollinger bands for early exit confirmation


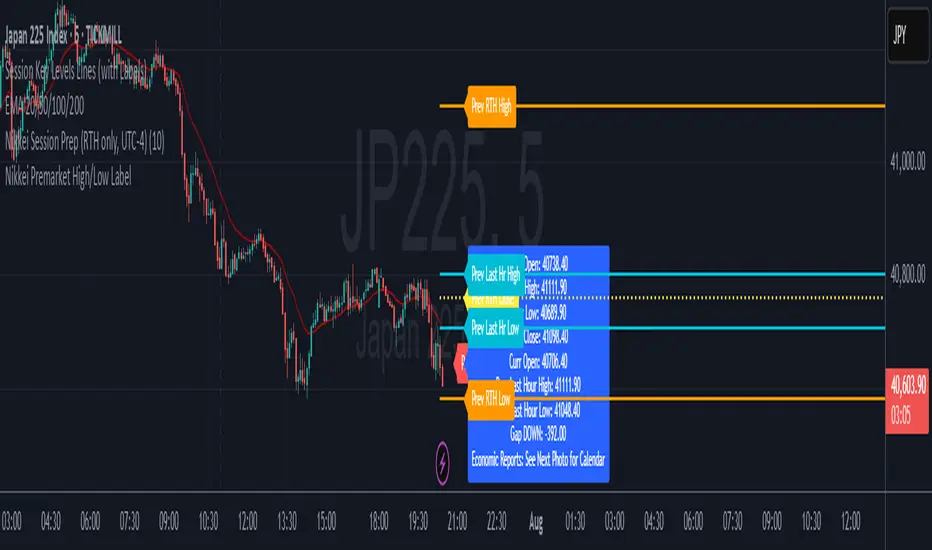
Nikkei Premarket High/Low LabelThis is Nikkei Premarket High/Low Label. shows you the premarket high and low. hope it helps :)

Moving Average RibbonMoving Averages creating a what I call internally a "ribbon". Rename as see fit.

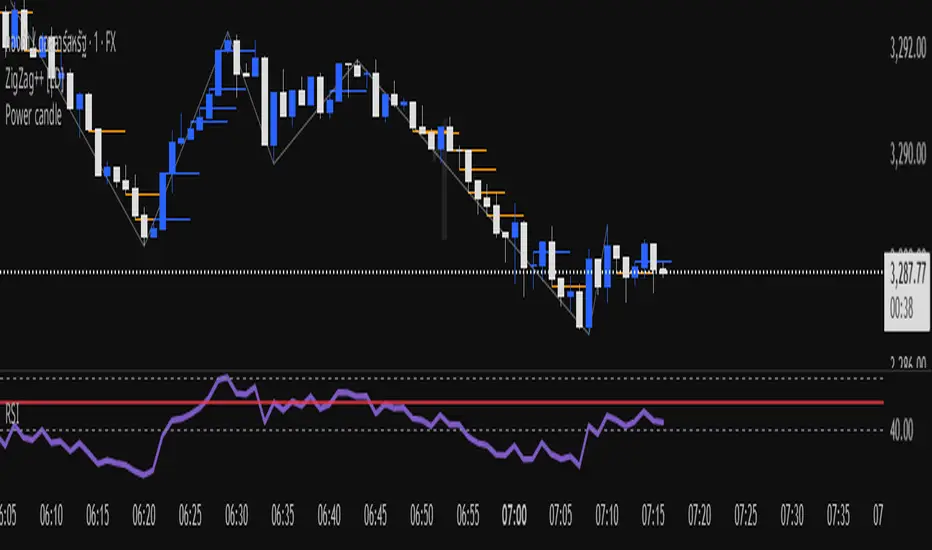
Power candlePower candle --------------------------Power candle --------------------------Power candle --------------------------Power candle --------------------------Power candle --------------------------Power candle --------------------------Power candle --------------------------Power candle --------------------------Power candle --------------------------Power candle --------------------------Power candle --------------------------Power candle --------------------------Power candle --------------------------Power candle --------------------------Power candle --------------------------

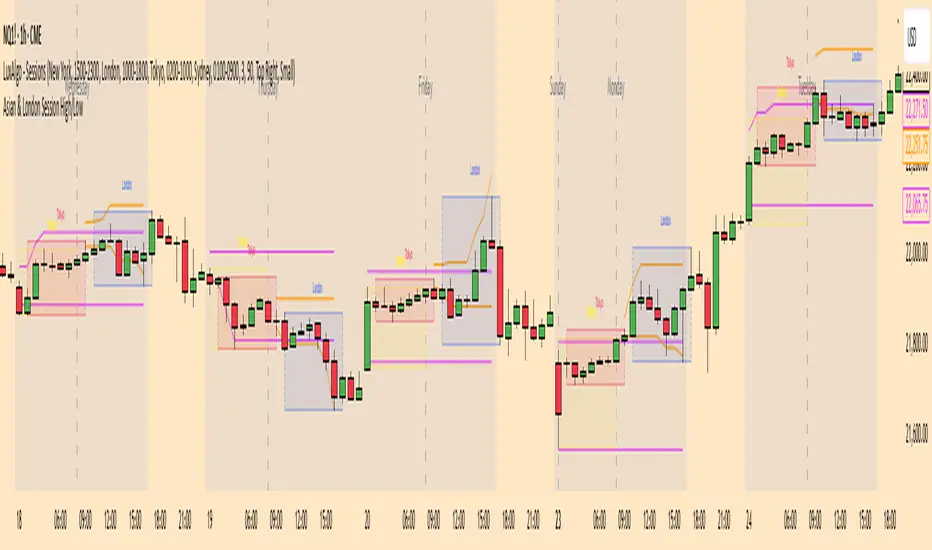
Asian & London Session High/LowThis Pine Script v6 indicator plots the high and low of the Asian and London trading sessions on the chart before the New York session opens.
Asian session is defined from 00:00 to 08:00 (Europe/Sofia time).
London session is defined from 09:00 to 16:30 (Europe/Sofia time).
The session highs and lows are tracked live and updated as new candles form within the session time ranges.
At 16:30, when the New York session opens, all high/low values are reset to na to prepare for the next day.
Horizontal lines are plotted using plot.style_linebr to extend the lines until the next candle.
This tool helps traders identify key support/resistance zones formed during the most active pre-New York hours.