Step 3: Multi-Timeframe Trading SessionsFor editing purposes,
This is for editing purposes for developer to edit it before publishing.
Indicators and strategies

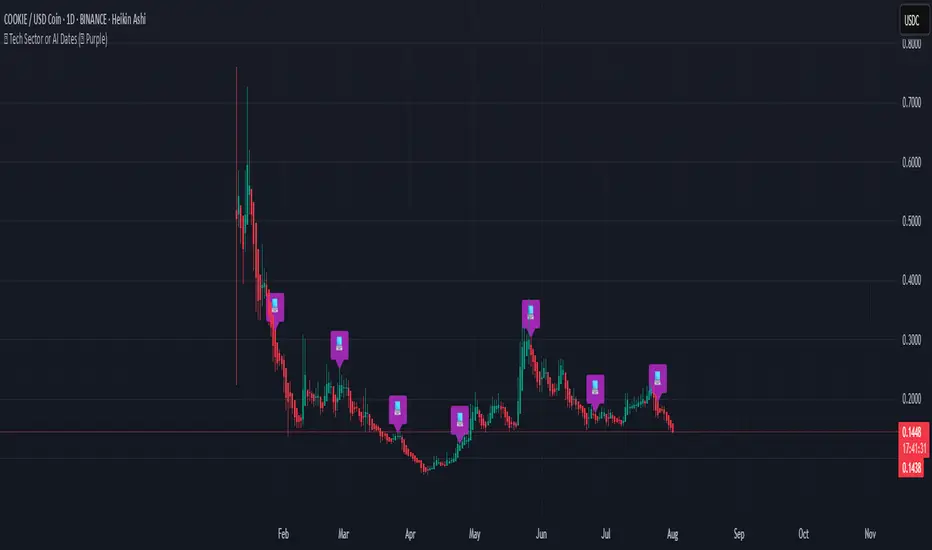
RSI Z‑Score + TableRSI Z-Score + Table
This script calculates the Z-Score of the RSI (Relative Strength Index), which standardizes RSI based on its own recent history.
What It Shows:
RSI Z-Score = (Current RSI - Mean RSI) / Standard Deviation
This tells you how extreme the current RSI is compared to its historical values.
A table displays:
Current RSI
Rolling Mean
RSI Z-Score
How to Use:
Z-Score > +2 = Statistically overbought
Z-Score < -2 = Statistically oversold
Use it to time reversals or overextension in RSI behavior.
🔒 Based on rolling lookback window — fully customizable.
Author:
Tags: #RSI #ZScore #Momentum #StatisticalEdge #MeanReversion #Crypto

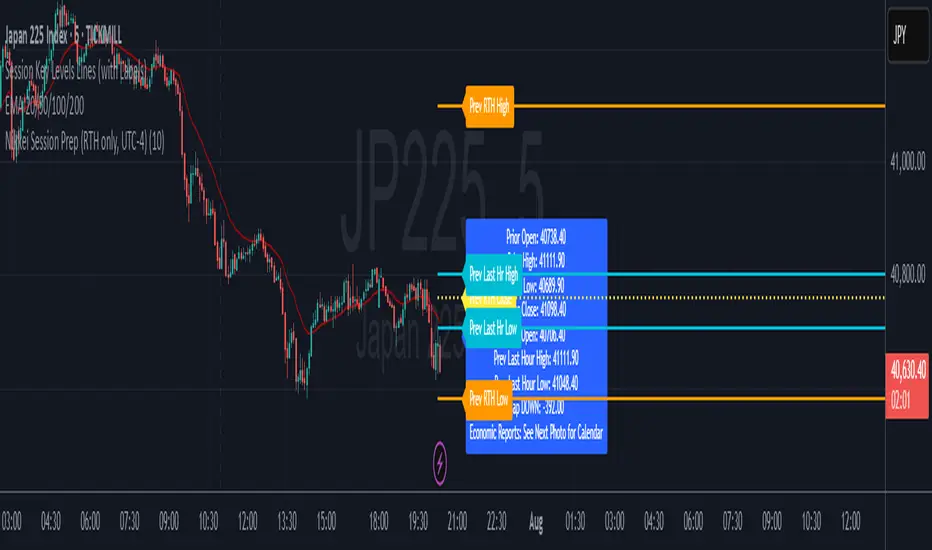
Nikkei Session Key Levels Lines (with Labels) - Nikkei CFDThis is Nikkei Session Key Levels Lines (with Labels) - Nikkei CFD. shows you all the key level lines that you need to be aware. hope it helps :)

Manual 1H Trend BackgroundThis TradingView Pine Script v6 indicator allows you to manually set the trend direction (based on your analysis of the 1-hour timeframe), and it will change the background color of your chart based on that input:
"Buy" → chart background turns green
"Sell" → chart background turns red
"Neutral" → no background color (transparent)

Nikkei Session Prep (RTH only, UTC-4)This is Nikkei Session Prep (RTH only, UTC-4). hope it helps :)
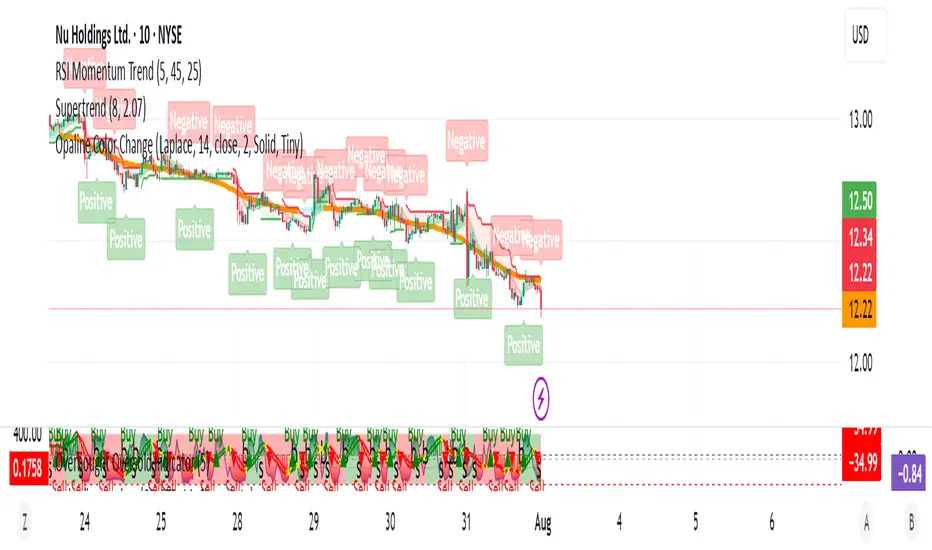
Opaline Color ChangeONLY USE for serious full time trading strategy, or running away from Military/City.
Multi Kernel Regression with Alert.
EMA9, EMA200 with Bollinger BandsThe indicator includes the EMA9 line, the EMA200 line and the Bollinger Bands into a single indicator plot.

First Candle Low Break SignalTheory: If the SPY (or anything really) starts the day with a green candle, it never breaks below that candle on that day.
This indicator was quickly made to check that theory with some interesting results.
Requirement: The Symbol must be set to "extended trading hours", otherwise the script cannot see the changes between days.

Trend Strength Index [Alpha Extract]The Trend Strength Index leverages Volume Weighted Moving Average (VWMA) and Average True Range (ATR) to quantify trend intensity in cryptocurrency markets, particularly Bitcoin. The combination of VWMA and ATR is particularly powerful because VWMA provides a more accurate representation of the market's true average price by weighting periods of higher trading volume more heavily—capturing genuine momentum driven by increased participation rather than treating all price action equally, which is crucial in volatile assets like Bitcoin where volume spikes often signal institutional interest or market shifts.
Meanwhile, ATR normalizes this measurement for volatility, ensuring that trend strength readings remain comparable across different market conditions; without ATR's adjustment, raw price deviations from the mean could appear artificially inflated during high-volatility periods (like during news events or liquidations) or understated in low-volatility sideways markets, leading to misleading signals. Together, they create a volatility-adjusted, volume-sensitive metric that reliably distinguishes between meaningful trend developments and noise.
This indicator measures the normalized distance between price and its volume-weighted mean, providing a clear visualization of trend strength while accounting for market volatility. It helps traders identify periods of strong directional movement versus consolidation, with color-coded gradients for intuitive interpretation.
🔶 CALCULATION
The indicator processes price data through these analytical stages:
Volume Weighted Moving Average: Computes a smoothed average weighted by trading volume
Volatility Normalization: Uses ATR to account for market volatility
Distance Measurement: Calculates absolute deviation between current price and VWMA
Strength Normalization: Divides price deviation by ATR for a volatility-adjusted metric
Formula:
VWMA = Volume-Weighted Moving Average of Close over specified length
ATR = Average True Range over specified length
Price Distance = |Close - VWMA|
Trend Strength = Price Distance / ATR
🔶 DETAILS Visual Features:
VWMA Line: Blue line overlay on the price chart representing the volume-weighted mean
Trend Strength Area: Histogram-style area plot with dynamic color gradient (red for weak trends, transitioning through orange and yellow to green for strong trends)
Threshold Line: Horizontal red line at the customizable Trend Enter level
Background Highlight: Subtle green background when trend strength exceeds the enter threshold for strong trend visualization
Alert System: Triggers notifications for strong trend detection
Interpretation:
0-Weak (Red): Minimal trend strength, potential consolidation or ranging market
Mid-Range (Orange/Yellow): Building momentum, watch for breakout potential
At/Above Enter Threshold (Green): Strong trend conditions, potential for continued directional moves
Threshold Crossing: Trend strength crossing above the enter level signals increasing conviction in the current direction
Color Transitions: Gradual shifts from warm (red/orange) to cool (green) tones indicate strengthening trends
🔶 EXAMPLES
Strong Trend Entry: When trend strength crosses above the enter threshold (e.g., 1.2), it identifies the onset of a powerful move where price deviates significantly from the mean.
Example: During a rally, trend strength rising from yellow (around 1.0) to green (1.2+) often precedes sustained upward momentum, providing entry opportunities for trend followers.
Consolidation Detection: Low trend strength values in red shades (below 0.5) highlight periods of low volatility and mean reversion potential.
Example: After a sharp sell-off, persistent red values signal a likely sideways phase, allowing traders to avoid whipsaws and wait for orange/yellow transitions as a precursor to recovery.
Volatility-Adjusted Pullbacks: In volatile markets, the ATR component ensures trend strength remains accurate; a dip back to yellow from green during minor corrections can indicate healthy pullbacks within a strong trend.
Example: Trend strength briefly falling to yellow levels (e.g., 0.8-1.1) after hitting green provides profit-taking signals without invalidating the overall bullish bias if the VWMA holds as support.
Threshold Alert Integration: The alert condition combines strength value with the enter threshold for timely notifications.
Example: Receiving a "Strong Trend Detected" alert when the area plot turns green helps confirm Bitcoin's breakout from consolidation, aligning with increased volume for higher-probability trades.
🔶 SETTINGS
Customization Options:
Lengths: VWMA length (default 14), ATR length (default 14)
Thresholds: Trend enter (default 1.2, step 0.1), trend exit (default 1.15, for potential future signal enhancements)
Visuals: Automatic color scaling with red at 0, transitioning to green at/above enter threshold
Alert Conditions: Strong trend detection (when strength > enter)
The Trend Strength Index equips traders with a robust, easy-to-interpret tool for gauging trend intensity in volatile markets like Bitcoin. By normalizing price deviations against volatility, it delivers reliable signals for identifying high-momentum opportunities while the gradient coloring and alerts facilitate quick assessments in both trending and choppy conditions.

Z-Score Mean ReversionThe "Mean Reversion Z-Score" indicator is a statistical tool that helps traders identify potential price reversals by measuring how far the current price has deviated from its mean (average) in terms of standard deviations. Here's what it does:
Calculates the Z-score by comparing the current price to its moving average, then dividing by the standard deviation of prices over a specified period (default 14 periods).
Identifies when the price has moved too far from its mean, suggesting a potential reversion opportunity:
Values above +2 indicate overbought conditions (potential sell)
Values below -2 indicate oversold conditions (potential buy)
Generates clear visual signals:
Green triangle (▲) for buy signals when crossing above -2
Red triangle (▼) for sell signals when crossing below +2
Color-coded background for quick visual reference
Plots reference lines at ±1.5 and ±2.0 standard deviations to help gauge the strength of the current trend.
This indicator is particularly useful for range-bound markets and mean reversion trading strategies, helping traders spot potential entry and exit points based on statistical extremes.

Buy and Sell Signals by Raja Saien📈 Buy and Sell Signals by Raja Saien 💹
"Simple. Clean. Powerful."
🔥 This indicator is built for those who believe in price action and clarity. No confusion, no clutter — just pure EMA crossover logic to catch early trends and filter false moves.
✅ Buy Signal when the 9 EMA crosses above the 21 EMA — indicating momentum shift to the upside.
❌ Sell Signal when the 9 EMA crosses below the 21 EMA — signaling potential downside momentum.
🧠 Designed for traders who trust the trend, respect momentum, and want to stay ahead of the crowd.
🔍 Perfect for scalping, intraday, and swing trading. Combine it with support/resistance or price action zones for even more 🔥 accuracy.
✨ Created by Raja Saien — for serious traders only.
💪 "Indicators don’t make you money, but discipline with clarity does."
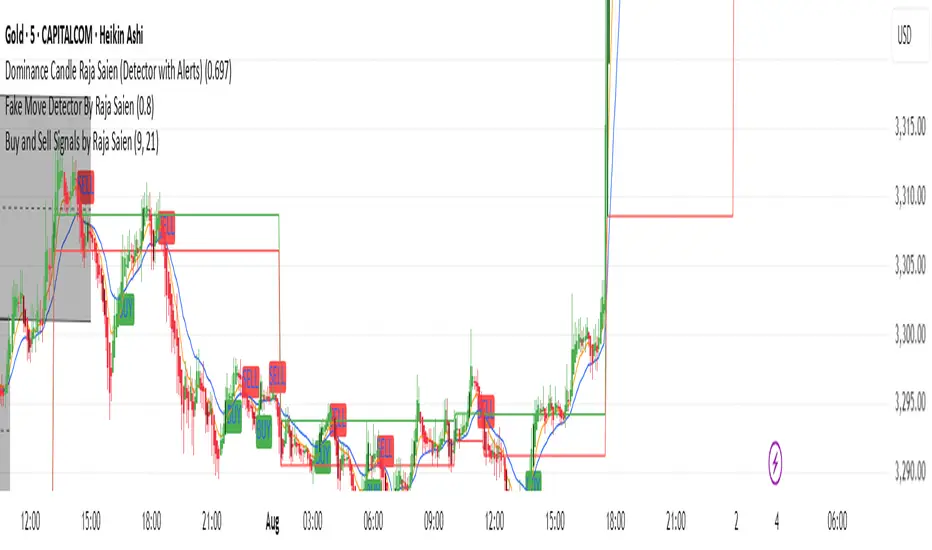
Tradeable Candle Detection By Raja SaienTradeable Candle Detection By Raja Saien
Overview:
This advanced candle detection tool is designed to help traders identify high-quality trade setups and avoid fake moves, based on candle structure, volume, and RSI conditions. Unlike many indicators that are limited to specific sessions, this script works across all market sessions, giving you full flexibility to trade 24/7.
🔍 Key Features:
All Session Support (24/7 Trading)
Detects tradeable setups during any time of the day, including Asian, London, New York, and overlapping hours.
No restriction to any specific session — trade when the opportunity is there!
Fake Move Detection 🚫
Identifies candles with long wicks, small bodies, and low volume — typical signs of manipulation or indecision.
Displays a “No Trade Zone – Fake Move” label to help you avoid poor entries.
Real Move Detection ✅
Highlights candles with strong bodies, short wicks, and high volume — ideal conditions for trade entries.
Helps you focus only on high-probability, momentum-driven moves.
RSI-Based Confirmation
Uses RSI to ensure trade entries align with momentum:
Bullish Entry Allowed: Candle is bullish + RSI between 50–75.
Bearish Entry Allowed: Candle is bearish + RSI between 25–50.
Avoid Trades: RSI is overbought/oversold or showing divergence.
Divergence Detection
Detects bearish divergence in bullish setups and bullish divergence in bearish setups — warns against risky entries.
Visual Zones & Candle Highlights
Plots horizontal lines at candle highs/lows and extended zones based on candle range.
Dominant candles are highlighted in black for quick visual spotting.
⚙️ Custom Inputs:
Minimum Body Size Threshold
Wick-to-Body Ratio for Fake Move
Volume Strength Multiplier
Candle Dominance Precision (% of range)
RSI Period and Source
Optional session filter (can be turned off to enable all-session detection)
🛎️ Alerts Included:
✅ Long Entry Confirmed – Strong bullish candle with supporting RSI
✅ Short Entry Confirmed – Strong bearish candle with supporting RSI
🚫 Fake Move Detected – Weak structure + low volume, no trade
🧠 How to Use:
Wait for a dominant black candle to appear.
Read the label to understand:
✅ Green = Trade Allowed
⚠️ Orange = Avoid (due to RSI or divergence)
🚫 Red = Fake Move (stay out)
Combine with support/resistance, SMC, or price action strategy for confluence.
🟢 "Trade any session, any time – with confidence, precision, and control. Powered by Raja Saien."
Built for traders who value smart entries and reliable signals across all time zones.

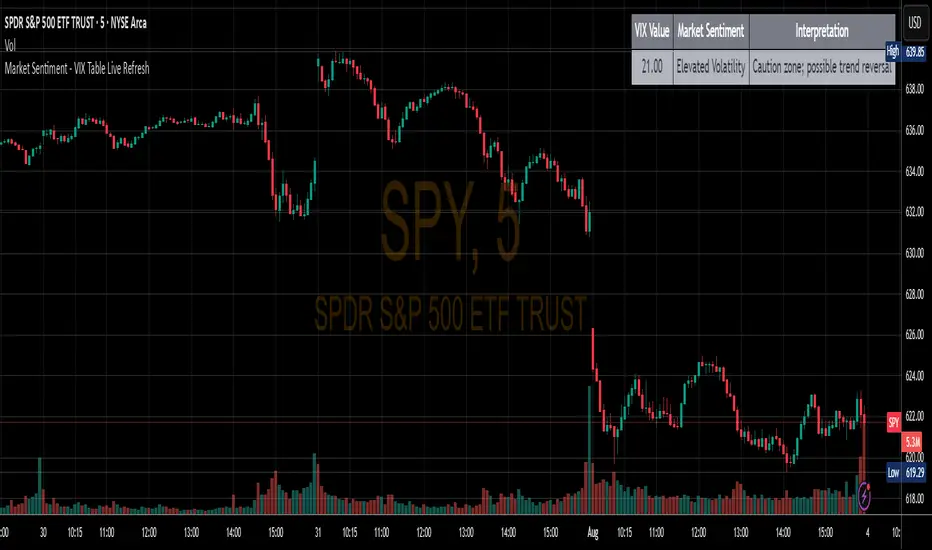
Market Sentiment - VIX Table Live RefreshProvides Market sentiment visual representation for easy understanding - using CBOE:VIX values
The VIX Sentiment Table provides an at-a-glance assessment of market mood by visualizing live data from the CBOE Volatility Index (VIX). Updated in sync with your chart’s resolution, this intuitive tool breaks down the current VIX level into clear sentiment zones—ranging from “Complacency” to “Panic”—paired with concise interpretations to guide your trading decisions.
Double Bollinger Bands - SF2000twin BB's. One bb can be set for , eg 20 period. The other set for - eg - 50 period. compare the channels.
SITFX_FuturesSpec_v17SITFX_FuturesSpec_v17 – Universal Futures Contract Library
Full-scale futures contract specification library for Pine Script v6. Covers CME, CBOT, NYMEX, COMEX, CFE, Eurex, ICE, and more – including minis, micros, metals, energies, FX, and bonds.
Key Features:
✅ Instrument‑agnostic: ES/MES, NQ/MNQ, YM/MYM, RTY/M2K, metals, energies, FX, bonds
✅ Full contract data: Tick size, tick value, point value, margins
✅ Continuation‑safe: Single‑line logic, no arrays or continuation errors
✅ Foundation for SITFX tools: Gann, Fibs, structure, and risk modules
Usage example:
import SITFX_FuturesSpec_v17/1 as fs
spec = fs.get(syminfo.root)
label.new(bar_index, high, str.format("{0}: Tick={1}, Value=${2}", spec.name, spec.tickSize, spec.tickValue))

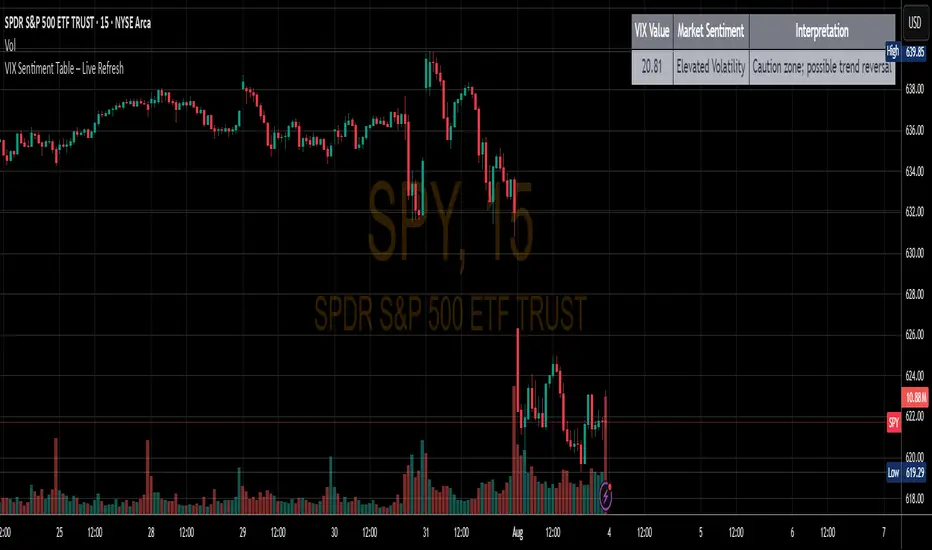
VIX Sentiment Table – ResolutionThis indicator provides verbal representation of the current VIX value and likely market trend for easy to view and interpret
SMA50 - Relleno + AlertasThis is about the 50 SMA and its relationship to price. When the price is above the 50 SMA, it is colored green, indicating a bullish trend. If the price is below the 50 SMA, it is colored red, indicating a bearish trend. It also has alerts when the trend crosses the 50 SMA.

Contrarian Investor📌 Indicator Overview
Name:Contrarian investor
Purpose: Identify oversold or overbought conditions for simple reversal trades.
Key Features:
Uses the 200-period moving average (200MA) to determine the market trend.
Uses RSI to detect oversold and overbought levels.
Includes a signal interval filter to prevent excessive signals.
📌 Signal Conditions
BUY (Reversal Buy)
Price is below the 200MA
RSI is below the oversold threshold (default: 30)
When both conditions are met, a "BUY" label is plotted below the bar.
SELL (Reversal Sell)
Price is above the 200MA
RSI is above the overbought threshold (default: 70)
When both conditions are met, a "SELL" label is plotted above the bar.
📌 Parameters
MA Length: Default 200 (used for trend detection)
RSI Length: Default 14
RSI Oversold: Default 30 (trigger for BUY signals)
RSI Overbought: Default 70 (trigger for SELL signals)
Signal Interval (bars): Default 10 (prevents duplicate signals)
📌 How to Use
Use the 200MA to confirm the trend direction.
Wait for RSI to reach extreme levels (oversold or overbought).
When a "BUY" or "SELL" label appears, consider a potential entry.
For better accuracy, combine with support/resistance or price action confirmation.
📌 Notes
This indicator is designed as a supplementary tool, not a standalone entry system.
Adjust the signal interval based on your trading style (e.g., shorter for scalping, longer for swing trading).
In strong trending markets, reversal signals may fail frequently, so additional confluence is recommended.
You need to adjust the settings depending on the market conditions.
This indicator is not intended for use during strong trending markets, such as after major economic news releases.
It is best suited for range-bound markets and scalping within a few-dollar price range.
📌 インジケーターの概要
名前:Contrarian investor
目的:過剰に売られた/買われたタイミングでの逆張りシグナルを簡単に確認
特徴:
200MAを基準にトレンド方向を判定
RSIで売られすぎ・買われすぎを検出
過剰なシグナルを防ぐための「シグナル間隔制限」付き
📌 シグナルの条件
BUY(逆張り買い)
現在の価格が 200MAより下
RSIが 設定値(初期値30)以下
この条件で「BUY」ラベルがチャート下に表示されます。
SELL(逆張り売り)
現在の価格が 200MAより上
RSIが 設定値(初期値70)以上
この条件で「SELL」ラベルがチャート上に表示されます。
📌 パラメータ設定
MA期間:デフォルト200(200MAで長期トレンドを判定)
RSI期間:デフォルト14
RSI売られすぎ:デフォルト30(BUYの発生条件)
RSI買われすぎ:デフォルト70(SELLの発生条件)
シグナル間隔(バー):デフォルト10(重複シグナル防止)
📌 使い方
200MAでトレンド方向を確認
RSIが極端な水準に達したら逆張りシグナル発生
「BUY」または「SELL」のラベルが出たら検討
他のテクニカル(サポレジ・プライスアクション)と組み合わせると精度向上
📌 注意点
単独でのエントリー判断には使わず、補助的に活用するのが推奨
シグナル間隔は調整可能(例:スキャルピングなら短め、スイングなら長め)
トレンドが強い相場では逆張りシグナルが連続して外れる可能性あり
相場環境によって設定を変える必要がある
指標発表後など強いトレンドが出る時ではなくレンジ相場で数ドル幅のスキャルピングをするのに向いている。

4 Anchored VWAPs This indicator shows 4 periods of Anchored VWAPs according to specific dates the user chose.

RahuCycleLibrary "RahuCycle"
drawRahuTable(table_position, table_size)
Parameters:
table_position (string)
table_size (string)
getBackgroundColor()
drawEventLabels()

Asian & London Session High/LowMarks out asian session high and low, aswell as london session high and low, this makes it easier for you to have crucial key levels on your chart at all times

EZThis script is designed to provide a clear, visual confirmation of trend direction, momentum shifts, and institutional bias by combining multiple EMA layers and smoothed Heiken Ashi waves.
Features:
• EMA Trend Band (8, 13, 21 EMA): Highlights short-term trend strength and clean stacking conditions.
• 35 EMA Momentum Line: Captures medium-term momentum shifts for better trade entries.
• 200 SMA Institutional Bias Line: Filters trades aligned with higher timeframe bias.
• Triple-Smoothed Heiken Ashi Waves: Changes background & candle colors to reflect momentum waves, filtering out noise and false signals.
• Liquidity Sweep Zones & Inverse FVGs (Optional): Helps identify smart money footprints and potential reversal zones.
Use Case:
• Best suited for trend-following traders, scalpers, and swing traders who rely on multi-timeframe confluence.
• Works effectively on Forex, Futures, Indices, and Crypto charts.
• Designed to filter out fakeouts and highlight high-probability trade zones.
Disclaimer:
This script is for educational purposes only. It does not guarantee profits and should be used in combination with proper risk management and trading experience.
